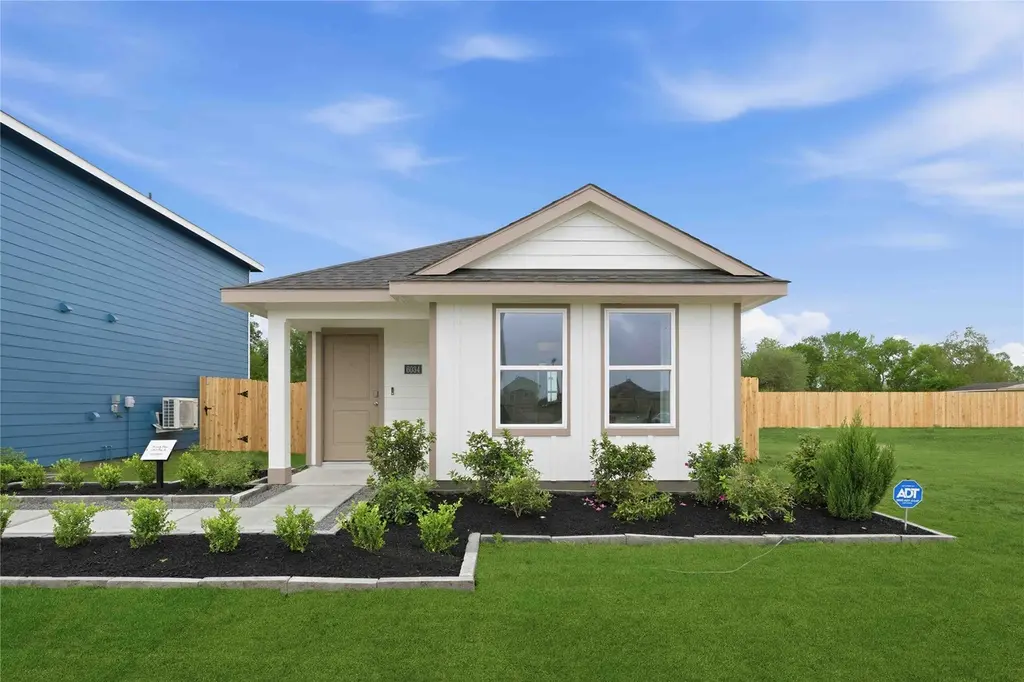
6011 Pineapple St · Houston, TX
Flood risk No data
- FEMA flood zone
- —
- Chance of flooding over 30 yrs
- —
- Est. flood insurance / yr
- —
Fire risk No data
- Est. fire insurance / yr
- —
Heat risk No data
- Hot days now (above threshold)
- —
- Hot days in 30 yrs
- —
Wind risk No data
- Chance of severe wind over 30 yrs
- —
Air-quality risk No data
- Unhealthy air days now
- —
- Unhealthy air days in 30 yrs
- —
Risk factors via First Street. Map © Google.
Why this score? — see what drove the F grade
The composite is a weighted blend of 9 inputs, each scored 0–100. Each bar is that input's sub-score; the figure is the points it added to the 100-point composite (weight × sub-score).
- ARV discount +9.2/15.0
- Appreciation +6.3/10.0
- Cash flow +5.2/30.0
- Livability +3.7/5.0
- Rent growth +2.8/5.0
- Schools +2.7/10.0
- Condition / age +2.5/5.0
- 1% rule +1.1/10.0
- DSCR +0.0/10.0
$234,990
🖨 Deal sheet 📄 Offer letter ✓ Due diligence
Listing remarks MLS
Step inside through the inviting Wyeth into a spacious family room that flows seamlessly into the dining area and kitchen perfect for entertaining and everyday living. The kitchen offers a central island, ample cabinet space, and a layout that keeps everyone connected. The private primary suite (Bedroom 1) is tucked away at the rear of the home and features a walk-in closet and an en-suite bath for added comfort and privacy. Two additional bedrooms are positioned on the opposite side of the home with a shared full bath ideal for family, guests, or a home office setup. Enjoy indoor outdoor living with a covered patio, perfect for relaxing evenings, morning coffee, or weekend gatherings.
Key facts
- Central island
- Walk-in closet
- Covered patio
Tags
Neighborhood map
What this means for you Summary
Snapshot
- This is a 3-bed/2.0-bath land listed at $235k.
Deal economics
- At list price, monthly cash flow is $-535 ($-6k/yr) — negative.
- To cash-flow at today's rent, offer at most $158k (33.0% below list).
- To meet the 1% rule (rent ≥ 1% of price), the offer needs to be $143k (39.3% below list).
- Recommended offer: $143k (39.3% below list) — sets the bar for 1% rule.
Location & tenants
- Location reads 74/100 on livability (#184 in TX, #4,771 nationally) — a middle-class / working-renter tenant base. Strengths: amenities A+, cost of living A+, housing A+; Watch: schools D, crime F.
- Houston ISD (urban): math 27% / reading 35% proficiency, ranked #593 of 826 in TX (top 72%) — families likely to look elsewhere, expect single-tenant / working-renter base with shorter leases; 71% free/reduced lunch — lower-income household profile, screen leases tightly.
- Market conditions: Rents rising (+1.2%/yr); 303 active listings in the ZIP; 19 comparable units currently listed for rent nearby; rentals leasing fast (median 11d on market — plan ~1-2 weeks tenant-placement turnaround); 29,883 units permitted in Harris County in 2024 (8,621 in 5+ unit buildings).
- This rent runs 30% of the median local income ($57k/yr) — at the standard rent-burdened threshold; future hikes will face affordability resistance.
Forward outlook
- In year one you build about $8k of equity ($2k loan paydown + $6k appreciation (2.6% local appreciation)).
- Harris County population projected at +47% by 2050 — long-run rental-demand tailwind backs the buy-and-hold thesis.
- By year 5, paydown + projected appreciation supports a ~$34k cash-out refi (75% LTV) — recoverable capital for the next deal without selling this one.
Negotiation context
- It's been on market 72 days — a 6% lower offer ($221k) is reasonable based on typical stale-listing flexibility.
Questions for the listing agent
- What do current leases actually rent for vs. the listed asking? Can we see a recent rent roll and the last 12 months of T-12 income?
- It's been on market 72 days. Have you received any prior offers? Is the seller open to a 39% concession, seller financing, or rate buy-down credit?
- What does the HOA fee cover, when was the last increase, and are there any pending special assessments or reserve-fund shortfalls?
- Why hasn't it sold? Are there any deal-killer items the seller is aware of (foundation, flood, title, zoning, code violations)?
- Is there a deadline driving the sale (1031 exchange, divorce, estate, relocation)? That informs how much negotiation room exists.
- Schools are D-rated, which usually means shorter tenancies and higher turnover. Who's the typical renter profile here, and what's been the actual vacancy rate?
- Crime grade is F in this area — have there been break-ins, vandalism, or insurance claims at this property in the last 3 years? What carrier currently insures it and at what premium?
- The area grade is low — what's the realistic commute time and amenity access for the typical tenant pool here? Any planned neighborhood developments (good or bad) we should know about?
- What's the average days-on-market for RENTAL listings here right now (not sales)? A rising rental-DOM trend means longer vacancies and softer asking-rent achievability than the comps imply.
- What's the recent tenant-quality profile in this submarket — average credit score on applications, eviction rate, late-payment / NSF rate, and stable-employment percentage? A property-management company in the area should have these aggregated.
- How much new for-sale + rental construction is in the pipeline within 1–3 miles? Heavy new supply typically softens prices + rents 12–24 months out; constrained supply supports both.
Investment metrics
- 1% rule
- 0.61% ✗
- Cap rate
- 3.56%
- Cash-on-cash
- -9.76%
- DSCR
- 0.57
- GRM
- 13.7
CMA / ARV
- ARV (median comp)
- $243,990
- List price
- $234,990
- Delta
- -3.69%
- Verdict
- FAIR
- Comps
- 20 within 1.0 mi
Projected returns pro-forma
2.61% appreciation · 1.17% rent growth · sell at horizon
- IRR
- -3.6%
- Equity multiple
- 0.80×
- Total profit
- $-13,112
- Equity at exit
- $100,563
- IRR
- 0.4%
- Equity multiple
- 1.06×
- Total profit
- $3,990
- Equity at exit
- $151,126
Cash invested: $65,797 (down + closing). Projections, not guarantees.
Landlord ↔ Tenant lean methodology
- Overall (STATE)
- 87 Strongly Landlord-Friendly
- State Texas
- 87 Strongly Landlord-Friendly · R+5
- County
- — inherits STATE
- City
- — inherits STATE
ZIP-level market 77048
- Home prices YoY
- 1.0%
- Rents YoY
- 1.2%
- Active inventory
- 303
- Price-to-rent
- 13.7×
Monthly cashflow live
- Estimated rent
- $1,426 high interval (Pro) →
- Mortgage (P&I)
- −$1,232
- Tax est. 1.5%
- −$294 /mo · $3,525/yr
- Insurance
- −$98
- HOA
- −$38
- Vacancy / Maint / Mgmt
- −$299
- Net cashflow
- $-535
Break-even live
UW: 25.0% down · 7.5% · 30yr · 1.5% tax · 5.0% vac · 8.0% maint · 8.0% mgmt
Financing live
Cash to close
- Down payment
- $58,748
- Closing costs
- $7,050
- Reserves months
- —
- Total cash needed
- —
Loan-product check · same deal, 3 products live
Conventional
25% down · 7.5% · 30yr
- Down + closing
- —
- Monthly P&I
- —
- Monthly cashflow
- —
- DSCR
- —
- Eligible?
- —
Personal DTI + credit; lowest rate.
DSCR
20% down · 8.5% · 30yr
- Down + closing
- —
- Monthly P&I
- —
- Monthly cashflow
- —
- DSCR
- —
- Eligible?
- —
No personal income docs; deal must DSCR.
Hard money
10% down · 12.0% · 12mo
- Down + closing
- —
- Monthly P&I
- —
- Monthly cashflow
- —
- DSCR
- —
- Eligible?
- —
Short-term bridge; refi at stabilization.
Rent comps 19 comps
| Address | Beds | Baths | Sqft | Rent | $/sqft | DOM | Units | Dist |
|---|---|---|---|---|---|---|---|---|
| 6160 Madden Ln Houston, TX | 1.0–2.0 | 1.0–2.0 | 911 | $1,209 | $1.33 | 4d | 267 | 0.28mi |
| 6107 El Granate Dr Houston, TX | 3.0 | 2.0 | 1192 | $1,000 | $0.84 | 5d | 1 | 0.35mi |
| 5602 Selinsky Rd Unit 2187 Houston, TX | 2.0 | 2.0 | 1062 | $1,081 | $1.02 | 2d | 1 | 0.62mi |
| 5602 Selinsky Rd Unit 3187 Houston, TX | 3.0 | 2.0 | 1167 | $1,281 | $1.10 | 2d | 1 | 0.62mi |
| 5602 Selinsky Rd Unit 5659 Houston, TX | 2.0 | 2.0 | 1062 | $1,113 | $1.05 | 10d | 1 | 0.62mi |
| 5602 Selinsky Rd Unit 510 Houston, TX | 3.0 | 2.0 | 1167 | $1,313 | $1.13 | 10d | 1 | 0.62mi |
| 5602 Selinsky Rd Unit 422 Houston, TX | 2.0 | 2.0 | 1062 | $1,089 | $1.03 | 7d | 1 | 0.62mi |
| 5602 Selinsky Rd Unit 421 Houston, TX | 2.0 | 2.0 | 1062 | $1,089 | $1.03 | 5d | 1 | 0.62mi |
| 5602 Selinsky Rd Unit 2047 Houston, TX | 2.0 | 2.0 | 1062 | $1,113 | $1.05 | 2d | 1 | 0.62mi |
| 5602 Selinsky Rd Unit 3047 Houston, TX | 3.0 | 2.0 | 1167 | $1,324 | $1.13 | 10d | 1 | 0.62mi |
| 6505 Wide Meadow Dr Houston, TX | 3.0–4.0 | 2.0–2.5 | 1696 | $2,185 | $1.29 | 15d | 1 | 0.77mi |
| 10902 Faircroft Dr Houston, TX | 3.0 | 1.0 | 1308 | $1,480 | $1.13 | 43d | 1 | 0.78mi |
| 11911 Martin Luther King Junior Blvd Houston, TX | 1.0–2.0 | 1.0 | 701 | $1,050 | $1.50 | 7d | 1 | 0.80mi |
| 11917 Martin Luther King Blvd Houston, TX | 2.0 | 1.0 | 805 | $1,025 | $1.27 | 21d | 1 | 0.83mi |
| 11917 Martin Luther King Blvd Houston, TX | 2.0 | 1.0 | 805 | $1,025 | $1.27 | 18d | 1 | 0.83mi |
| 5425 E Orem Dr Houston, TX | 1.0–4.0 | 1.0–2.0 | 1040 | $1,472 | $1.42 | 4d | 13 | 0.93mi |
| 5426 Greylog Dr Houston, TX | 3.0 | 2.0 | 1205 | $1,750 | $1.45 | 24d | 1 | 0.95mi |
| 5919 Allison Rd Unit B Houston, TX | 4.0 | 2.5 | 1450 | $1,850 | $1.28 | 43d | 1 | 1.33mi |
| 11319 Murr Way Houston, TX | 3.0 | 1.5 | 1213 | $1,699 | $1.40 | 18d | 1 | 1.42mi |
HOA detail
- Monthly dues
- $38 · $456/yr
Listing history 12 events
-
2026-06-18days on market $234,990 Active 72 DOM
-
2026-06-17days on market $234,990 Active 71 DOM
-
2026-06-16days on market $234,990 Active 70 DOM
-
2026-06-15days on market $234,990 Active 69 DOM
-
2026-06-13days on market $234,990 Active 67 DOM
-
2026-06-10days on market $234,990 Active 63 DOM
-
2026-06-08days on market $234,990 Active 62 DOM
-
2026-06-07days on market $234,990 Active 61 DOM
-
2026-06-04days on market $234,990 Active 58 DOM
-
2026-06-01days on market $234,990 Active 55 DOM
-
2026-05-31days on market $234,990 Active 54 DOM
-
2026-04-07$234,990 Active 694-char remark
Show marketing remark (694 chars)
Step inside through the inviting Wyeth into a spacious family room that flows seamlessly into the dining area and kitchen perfect for entertaining and everyday living. The kitchen offers a central island, ample cabinet space, and a layout that keeps everyone connected. The private primary suite (Bedroom 1) is tucked away at the rear of the home and features a walk-in closet and an en-suite bath for added comfort and privacy. Two additional bedrooms are positioned on the opposite side of the home with a shared full bath ideal for family, guests, or a home office setup. Enjoy indoor outdoor living with a covered patio, perfect for relaxing evenings, morning coffee, or weekend gatherings.
ⓘ Source: listings_history table (triggers on properties + properties_extension) + one-shot
backfill from property_details.listing_events for pre-trigger history.
Nearby sold comps map
Loading sold comps map…
Walkable amenities ~0.75 mi
Loading nearby amenities…
Taxation est. · year 1
- Rental income
- $17,114
- − Mortgage interest
- −$13,163
- − Property taxes
- −$3,525
- − Insurance
- −$1,175
- − Repairs & maintenance
- −$1,369
- − Management
- −$1,369
- − HOA
- −$456
- − Depreciation
- −$6,836
- Taxable loss
- −$10,779
- Est. tax savings @ 24.0%
- +$2,587
- After-tax cash flow
- $-3,836/yr
For passive investors: Depreciation is non-cash, so a rental often shows a tax loss while cash-flowing — sheltering income. Rental losses are passive: they offset passive income freely, and up to $25,000/yr can offset ordinary (W-2) income if you actively participate and your MAGI is under $100k (phasing out to $0 by $150k); unused losses carry forward. On sale, claimed depreciation is recaptured at up to 25%, and gains may owe capital-gains tax (a 1031 exchange can defer both). Figures are a year-1 estimate at your 24.0% rate — not tax advice; consult a CPA.
Schools (NCES district)
- District
- Houston ISD
- NCES district ID
- 4823640
- Math proficiency
- 27% ▼ -18.00%
- Reading proficiency
- 35% ▼ -6.00%
- Median HH income
- $46,054
- Composite
- 26.63/100
- National rank
- #7173
- State rank
- #593 of 826 in TX
Livability — Houston
- Score
- 74/100
- State rank
- #184
- US rank
- #4771
Category grades
Schools grade is shown separately in the Schools card above.
Census & demographics
- Census place
- Houston, TX
- County
- Harris County · 4,702,590 people
- City population
- 3,226,434
- Metro
- Houston-The Woodlands-Sugar Land, TX
- Population (ZIP)
- 21,151
- Household income
- $56,747
- Rent vs Own
- Severe rent burden
- 1117.0
Population outlook (Harris County) Hauer SSP2
- Today (2025)
- 5,571,493 people
- By 2030
- 6,089,821 · +9.3%
- By 2040
- 7,142,806 · +28.2%
- By 2050
- 8,185,864 · +46.9%
- By 2075
- 10,574,329 · +89.8%
- By 2100
- 12,109,958 · +117.4%
Race, ethnicity, and origin ACS 2023
- Neighborhood character
- Predominantly Black (69%)
- Race & ethnicity
- Black 69% Hispanic / Latino 24% Two or more races 6% Asian 3% White 2%
- Hispanic origin (detail)
- Mexican 17% Puerto Rican 1%
- Foreign-born
- 12% · Canada, Vietnam
- Languages at home
- 76% English-only · Spanish 20% Tagalog/Filipino 2% Vietnamese 1%
Political lean MEDSL · Harris
- 2024 margin
- Lean D (+5.5) · D 52.0% · R 46.4% · Other 1.6%
- 2008→2024 swing
- +3.9pp toward D · 2008: 1.6pp · 2024: 5.5pp
- All cycles
- 2024: D+5.5 2020: D+13.3 2016: D+12.4 2012: D+0.1 2008: D+1.6
Not yet ingested
- Civics
- —
Market trends
- HPI YoY
- ▲ 2.61%
- Current HPI
- 266.4468
- Rent YoY
- ▲ 1.17%
- Metro
- Houston-The Woodlands-Sugar Land, TX
- State GDP YoY
- ▲ 3.95%
- F500 in state
- 110
Industry mix (Fortune 500 HQ in TX)
| Industry | F500 HQs | Revenue |
|---|---|---|
| Energy | 16 | $1,198B |
|
||
| Technology | 5 | $198B |
|
||
| Engineering / Construction | 4 | $72B |
|
||
| Energy Services | 3 | $60B |
|
||
| Utilities | 3 | $41B |
|
||
| Healthcare | 2 | $330B |
|
||
Price history
1 event — show timeline
- 2026-04-07 Listed $234,990 HARMLS
Property tax history
+1.6%/yrLatest (2025): $346 · +1.6% YoY. Source: county tax records.
Cash-flow waterfall
monthlySold comps — $/sqft
last 12 mo · ≤1 miLoading sold comps…