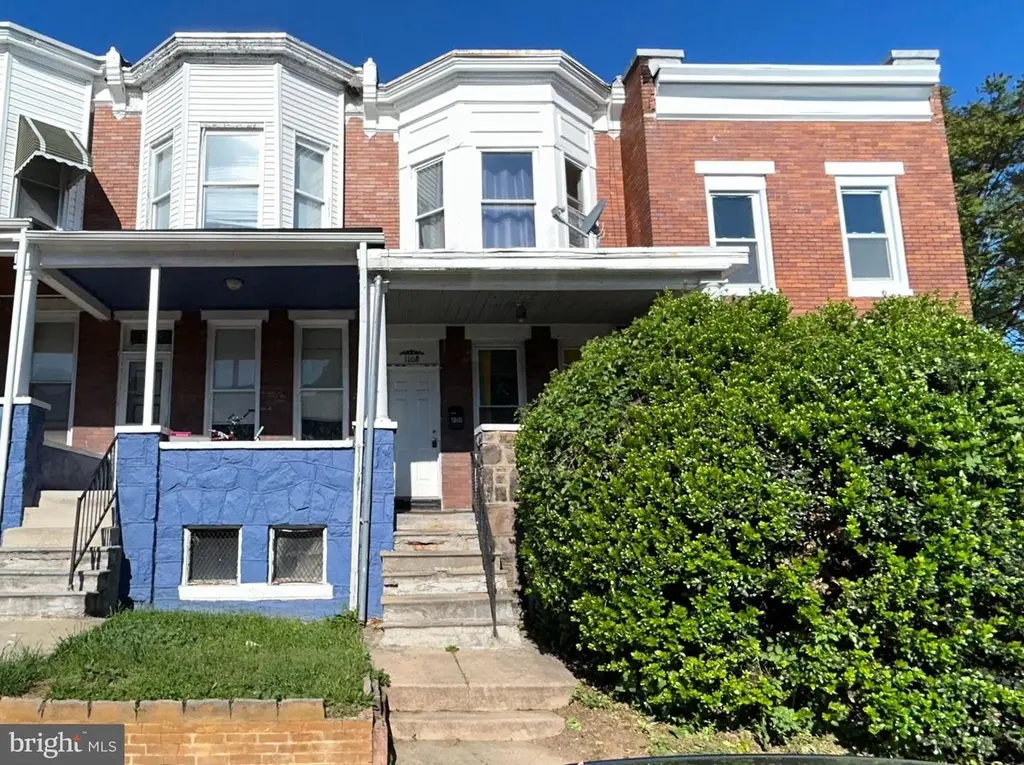
1108 N Dukeland St · Baltimore, MD
Flood risk 1/10 · Minimal
- FEMA flood zone
- X (unshaded)
- Chance of flooding over 30 yrs
- 0.0%
- Est. flood insurance / yr
- $473 – $860
Fire risk 1/10 · Minimal
- Est. fire insurance / yr
- $755 – $1,403
Heat risk 7/10 · Major
- Hot days now (above 103°F)
- 7 days/yr
- Hot days in 30 yrs
- 15 days/yr
Wind risk 6/10 · Moderate
- Chance of severe wind over 30 yrs
- 27.0%
Air-quality risk 3/10 · Minor
- Unhealthy air days now
- 3 days/yr
- Unhealthy air days in 30 yrs
- 4 days/yr
Risk factors via First Street. Map © Google.
Why this score? — see what drove the B+ grade
The composite is a weighted blend of 9 inputs, each scored 0–100. Each bar is that input's sub-score; the figure is the points it added to the 100-point composite (weight × sub-score).
- Cash flow +30.0/30.0
- ARV discount +15.0/15.0
- 1% rule +10.0/10.0
- DSCR +10.0/10.0
- Rent growth +4.0/5.0
- Livability +3.8/5.0
- Condition / age +2.5/5.0
- Schools +1.0/10.0
- Appreciation +0.0/10.0
$59,900
🖨 Deal sheet 📄 Offer letter ✓ Due diligence
Listing remarks
Discover this nice colonial townhouse nestled in the desirable Winchester subdivision. Built in 1920, this residence blends historic character with modern comforts, offering a unique living experience. Step inside to find an inviting open floor plan with laminated flooring and large windows that enhances the flow of natural light. The cozy dining area is perfect for intimate gatherings, while the country-style kitchen, complete with ample table space, invites culinary creativity. Skylights illuminate the upper-level bedroom and bathroom creating a warm ambiance. The well-appointed bathroom features a classic tub shower, providing a serene retreat for relaxation. With two spacious bedrooms,
Key facts
- Large windows
- Colonial townhouse
- Open floor plan
Tags
Property features AI
Finance
- Other: Estimated year built; Approximately 1,288 finished above-grade square feet (assessor source); Approximately 644 below-grade unfinished square feet
Exterior
- Parking: On-street parking
- Utilities: Public water; Public sewer; Natural gas hot water
- Home design: Interior townhouse/rowhouse; Fee simple ownership
- Construction: Brick construction; Concrete perimeter foundation; Above-grade and below-grade structures
- Exterior features: Rear fencing; Porch(es); Sidewalks; Street lights
Interior
- Kitchen: Country-style kitchen with table space
- Bedrooms: Two bedrooms on the first upper level
- Flooring: Carpet; Laminate plank
- Bathrooms: One full bathroom (all upper levels)
- Heating & cooling: Radiator heating; Forced air heating; Natural gas fuel for heat and hot water
- Interior features: Open floor plan; Dining area; Country-style kitchen with table space; Skylight(s); Tub with shower; Drywall walls and ceilings; Level entry to main floor
- Laundry & utility: Unfinished basement with interior access and connecting stairway; Sump pump; Basement windows
Neighborhood map
What this means for you Summary
Snapshot
- This is a 2-bed/1.0-bath townhouse listed at $60k.
Deal economics
- At list price, monthly cash flow is $880 ($11k/yr) — positive.
- The deal already cash-flows at list — no discount required.
- Meets the 1% rule at list price ($2k rent vs $60k).
- Recommended offer: $58k (3.0% below list) — sets the bar for market timing.
- Cap rate 23.9% vs local median 6.0% in Baltimore — top-decile yield for the area; either an underpriced asset or a hidden risk that comps aren't pricing in. Stress-test before assuming the spread holds.
Location & tenants
- Location reads 76/100 on livability (#90 in MD, #3,396 nationally) — a middle-class / working-renter tenant base. Strengths: amenities A+, commute A+, housing A+; Watch: schools D, crime F.
- Baltimore City Public Schools (urban): math 7% / reading 16% proficiency, ranked #24 of 24 in MD (top 100%) — low school quality limits family demand, transient renter base, plan for 1-2y turnover; 79% free/reduced lunch — lower-income household profile, screen leases tightly.
- Market conditions: Rents rising fast (+6.1%/yr); 252 active listings in the ZIP; 40 comparable units currently listed for rent nearby; rentals at typical pace (median 24d on market — plan ~3-4 weeks tenant-placement turnaround); lower-income renter base — watch delinquency; 1,273 units permitted in Baltimore city in 2024 (1,104 in 5+ unit buildings).
- At $1,638/mo this rent would consume 47% of the median local household income ($42k/yr) (locally 2264% of renters already pay >50% of income on rent) — very limited rent-growth headroom before tenants either downsize or default.
Forward outlook
- Local home prices are declining (-3.0%/yr); year-one equity from $414 of loan paydown is wiped out by about $2k of value loss. Plan a longer hold.
- Baltimore County population projected to shrink 4% by 2050 — rents likely to lag national; underwrite the cash flow, not the appreciation.
- At projected returns (-3.0% appreciation + 6.1% rent growth), your $17k cash investment doubles in ~2 years — after that, you're playing with house money.
Negotiation context
- It's been on market 31 days — a 3% lower offer ($58k) is reasonable based on typical stale-listing flexibility.
Risks & watch-outs
- Watch-outs: built in 1920 — expect roof / HVAC / electrical / plumbing capex.
- Climate carrying-cost: major wind risk, 27% chance of damaging wind over 30y; extreme-heat days projected 7→15/yr by 2055 (HVAC capex compounding) — expect insurance premiums to compound above CPI over the hold.
Questions for the listing agent
- It's been on market 31 days. Have you received any prior offers? Is the seller open to a 3% concession, seller financing, or rate buy-down credit?
- Built in 1920 — when were the roof, HVAC, electrical panel, plumbing, and water heater last replaced?
- Is there a deadline driving the sale (1031 exchange, divorce, estate, relocation)? That informs how much negotiation room exists.
- Schools are D-rated, which usually means shorter tenancies and higher turnover. Who's the typical renter profile here, and what's been the actual vacancy rate?
- Crime grade is F in this area — have there been break-ins, vandalism, or insurance claims at this property in the last 3 years? What carrier currently insures it and at what premium?
- What's the average days-on-market for RENTAL listings here right now (not sales)? A rising rental-DOM trend means longer vacancies and softer asking-rent achievability than the comps imply.
- What's the recent tenant-quality profile in this submarket — average credit score on applications, eviction rate, late-payment / NSF rate, and stable-employment percentage? A property-management company in the area should have these aggregated.
- How much new for-sale + rental construction is in the pipeline within 1–3 miles? Heavy new supply typically softens prices + rents 12–24 months out; constrained supply supports both.
Investment metrics
- 1% rule
- 2.73% ✓
- Cap rate
- 23.92%
- Cash-on-cash
- 62.96%
- DSCR
- 3.80
- GRM
- 3.0
CMA / ARV
- ARV (on-the-fly)
- $92,736
- Comps found
- 12
Show comp detail 12 sales within ~0.75 mi
| Address | Dist | Beds/Ba | Sqft | Sold | Price | $/sf | Match |
|---|---|---|---|---|---|---|---|
| 2711 Riggs Ave | 0.10mi | 3/1.0 (+1) | 1,288 (0%) | 2mo | $134,000 | $104 | 89 |
| 3004 Brighton St | 0.37mi | 3/1.0 (+1) | 1,288 (0%) | 1mo | $44,000 | $34 | 77 |
| 1083 Ellicott Driveway | 0.26mi | 3/1.0 (+1) | 1,350 (+5%) | 3mo | $69,900 | $52 | 72 |
| 3043 Arunah Ave | 0.48mi | 3/1.0 (+1) | 1,314 (+2%) | 3mo | $95,000 | $72 | 67 |
| 2435 Lauretta Ave | 0.65mi | 3/1.0 (+1) | 1,260 (-2%) | 1mo | $45,000 | $36 | 60 |
| 1528 N Ellamont St | 0.49mi | 3/2.5 (+1) | 1,328 (+3%) | 1mo | $209,000 | $157 | 60 |
| 3224 Belmont Ave | 0.43mi | 3/1.5 (+1) | 1,178 (-8%) | 1mo | $77,000 | $65 | 58 |
| 1625 N Rosedale St | 0.49mi | 3/1.0 (+1) | 1,396 (+8%) | 2mo | $36,000 | $26 | 57 |
| 2727 Baker St | 0.36mi | 3/1.0 (+1) | 1,116 (-13%) | 3mo | $125,000 | $112 | 54 |
| 2920 Brighton St | 0.35mi | 3/2.5 (+1) | 1,440 (+12%) | 2mo | $247,500 | $172 | 52 |
| 2404 W Lafayette Ave | 0.48mi | 3/2.0 (+1) | 1,476 (+15%) | 2mo | $135,000 | $91 | 43 |
| 2416 W Franklin St | 0.67mi | 3/2.0 (+1) | 1,435 (+11%) | 2mo | $67,000 | $47 | 39 |
Match score weights: distance 35% · size 25% · config 20% · recency 20%. Top-matched comps best support the ARV.
Projected returns pro-forma
-3.0% appreciation · 6.1% rent growth · sell at horizon
- IRR
- 65.4%
- Equity multiple
- 4.08×
- Total profit
- $51,629
- Equity at exit
- $8,931
- IRR
- 70.8%
- Equity multiple
- 9.36×
- Total profit
- $140,259
- Equity at exit
- $5,179
Cash invested: $16,772 (down + closing). Projections, not guarantees.
Landlord ↔ Tenant lean methodology
- Overall (CITY)
- 12 Strongly Tenant-Friendly
- State Maryland
- 27 Tenant-Leaning · D+14
- County
- — inherits STATE
- City Baltimore
- 12 Strongly Tenant-Friendly · D+58
ZIP-level market 21216
- Rents YoY
- 6.1%
- Active inventory
- 252
- Price-to-rent
- 3.0×
Monthly cashflow live
- Estimated rent
- $1,638 high interval (Pro) →
- Mortgage (P&I)
- −$314
- Tax est. 1.5%
- −$75 /mo · $898/yr
- Insurance
- −$25
- HOA
- −$0
- Vacancy / Maint / Mgmt
- −$344
- Net cashflow
- $880
Break-even live
UW: 25.0% down · 7.5% · 30yr · 1.5% tax · 5.0% vac · 8.0% maint · 8.0% mgmt
Financing live
Cash to close
- Down payment
- $14,975
- Closing costs
- $1,797
- Reserves months
- —
- Total cash needed
- —
Loan-product check · same deal, 3 products live
Conventional
25% down · 7.5% · 30yr
- Down + closing
- —
- Monthly P&I
- —
- Monthly cashflow
- —
- DSCR
- —
- Eligible?
- —
Personal DTI + credit; lowest rate.
DSCR
20% down · 8.5% · 30yr
- Down + closing
- —
- Monthly P&I
- —
- Monthly cashflow
- —
- DSCR
- —
- Eligible?
- —
No personal income docs; deal must DSCR.
Hard money
10% down · 12.0% · 12mo
- Down + closing
- —
- Monthly P&I
- —
- Monthly cashflow
- —
- DSCR
- —
- Eligible?
- —
Short-term bridge; refi at stabilization.
Rent comps 40 comps
| Address | Beds | Baths | Sqft | Rent | $/sqft | DOM | Units | Dist |
|---|---|---|---|---|---|---|---|---|
| 2806 Riggs Ave Baltimore, MD | 3.0 | 2.5 | 1412 | $1,900 | $1.35 | 3d | 1 | 0.04mi |
| 2728 Winchester St Baltimore, MD | 3.0 | 1.5 | 1260 | $1,800 | $1.43 | 3d | 1 | 0.09mi |
| 2800 Presstman St Baltimore, MD | 3.0 | 2.5 | 1460 | $1,799 | $1.23 | 23d | 1 | 0.27mi |
| 1042 Ellicott Dr Baltimore, MD | 2.0 | 1.0 | 900 | $1,450 | $1.61 | 43d | 1 | 0.27mi |
| 3003 Presstman St Unit 2 Baltimore, MD | 2.0 | 1.0 | 1450 | $1,300 | $0.90 | 23d | 1 | 0.30mi |
| 3003 Presstman St Unit 1 Baltimore, MD | 2.0 | 2.0 | 1450 | $1,400 | $0.97 | 44d | 1 | 0.30mi |
| 3015 Rayner Ave Baltimore, MD | 3.0 | 1.0 | 1152 | $1,350 | $1.17 | 43d | 1 | 0.37mi |
| 3238 Westmont Ave Baltimore, MD | 3.0 | 1.0 | 1280 | $1,600 | $1.25 | 43d | 1 | 0.38mi |
| 1530 N Rosedale St Baltimore, MD | 3.0 | 2.0 | 1641 | $1,895 | $1.15 | 14d | 1 | 0.42mi |
| 1513 N Ellamont St Baltimore, MD | 3.0 | 1.0 | 1700 | $1,700 | $1.00 | 23d | 1 | 0.43mi |
| 607 N Longwood St Baltimore, MD | 1.0 | 1.0 | 1750 | $650 | $0.37 | 4d | 1 | 0.44mi |
| 2922 Edmondson Ave Baltimore, MD | 3.0 | 2.0 | 1620 | $1,900 | $1.17 | 43d | 1 | 0.45mi |
| 3127 Baker St Baltimore, MD | 3.0 | 1.0 | 1000 | $1,300 | $1.30 | 43d | 1 | 0.46mi |
| 2636 Lauretta Ave Baltimore, MD | 3.0 | 2.5 | 1232 | $1,900 | $1.54 | 43d | 1 | 0.52mi |
| 3309 Brighton St Baltimore, MD | 3.0 | 1.0 | 1134 | $1,700 | $1.50 | 43d | 1 | 0.52mi |
| 2301 Riggs Ave Baltimore, MD | 3.0 | 2.0 | 1072 | $1,600 | $1.49 | 23d | 1 | 0.53mi |
| 2609 Lauretta Ave Baltimore, MD | 3.0 | 1.0 | 1286 | $1,675 | $1.30 | 23d | 1 | 0.55mi |
| 918 N Bentalou St Baltimore, MD | 3.0 | 1.5 | 1485 | $1,750 | $1.18 | 43d | 1 | 0.57mi |
| 3003 W North Ave Baltimore, MD | 1.0–2.0 | 1.0 | 841 | $935 | $1.11 | 2d | 3 | 0.57mi |
| 1617 Moreland Ave Baltimore, MD | 2.0 | 1.0 | 900 | $1,450 | $1.61 | 23d | 1 | 0.61mi |
| 2636 W North Ave Baltimore, MD | 2.0–3.0 | 1.0–2.0 | 975 | $1,300 | $1.33 | 4d | 1 | 0.63mi |
| 1617-A Moreland Ave Unit 2nd Flr Baltimore, MD | 2.0 | 1.0 | 1500 | $1,400 | $0.93 | 43d | 1 | 0.63mi |
| 780 Linnard St Baltimore, MD | 3.0 | 2.0 | 1224 | $1,590 | $1.30 | 43d | 1 | 0.64mi |
| 798 N Grantley St Baltimore, MD | 3.0 | 2.0 | 1360 | $2,295 | $1.69 | 23d | 1 | 0.65mi |
| 787 N Grantley St Baltimore, MD | 3.0 | 1.0 | 1116 | $1,575 | $1.41 | 23d | 1 | 0.66mi |
| 2812 Clifton Ave Baltimore, MD | 3.0 | 1.5 | 1650 | $1,850 | $1.12 | 43d | 1 | 0.73mi |
| 1816 N Bentalou St Baltimore, MD | 3.0 | 2.0 | 1350 | $1,700 | $1.26 | 10d | 1 | 0.76mi |
| 1816 N Bentalou St Baltimore, MD | 3.0 | 2.0 | 1350 | $1,700 | $1.26 | 23d | 1 | 0.76mi |
| 3423 Edmondson Ave Baltimore, MD | 2.0 | 1.5 | 1400 | $1,710 | $1.22 | 43d | 1 | 0.76mi |
| 1501 N Payson St Baltimore, MD | 3.0 | 1.0 | 1400 | $1,550 | $1.11 | 43d | 1 | 0.84mi |
| 3017 Poplar Ter Baltimore, MD | 2.0 | 1.0 | 880 | $1,349 | $1.53 | 23d | 1 | 0.85mi |
| 3712 Gelston Dr Baltimore, MD | 3.0 | 2.0 | 1250 | $2,500 | $2.00 | 23d | 1 | 0.89mi |
| 2204 Clifton Ave Baltimore, MD | 3.0 | 1.0 | 1400 | $1,450 | $1.04 | 4d | 1 | 0.94mi |
| 202 N Edgewood St Baltimore, MD | 3.0 | 2.0 | 1710 | $2,250 | $1.32 | 23d | 1 | 0.97mi |
| 1722 N Monroe St Baltimore, MD | 3.0 | 1.5 | 1000 | $1,350 | $1.35 | 23d | 1 | 0.98mi |
| 62 N Gorman Ave Baltimore, MD | 3.0 | 2.0 | 1100 | $2,500 | $2.27 | 17d | 1 | 0.99mi |
| 2012 W Saratoga St Baltimore, MD | 3.0 | 1.0 | 1300 | $1,700 | $1.31 | 23d | 1 | 1.00mi |
| 1930 N Payson St Baltimore, MD | 2.0 | 2.0 | 980 | $1,500 | $1.53 | 23d | 1 | 1.00mi |
| 147 Denison St Baltimore, MD | 1.0 | 1.0 | 1370 | $1,100 | $0.80 | 23d | 1 | 1.01mi |
| 1433 N Fulton Ave Baltimore, MD | 2.0 | 1.0 | 1200 | $1,500 | $1.25 | 43d | 1 | 1.01mi |
Listing history 17 events
-
2026-06-18days on market $59,900 Active 31 DOM
-
2026-06-17days on market $59,900 Active 30 DOM
-
2026-06-16days on market $59,900 Active 29 DOM
-
2026-06-15days on market $59,900 Active 28 DOM
-
2026-06-13days on market $59,900 Active 26 DOM
-
2026-06-09days on market $59,900 Active 22 DOM
-
2026-06-08days on market $59,900 Active 21 DOM
-
2026-06-07days on market $59,900 Active 20 DOM
-
2026-06-04days on market $59,900 Active 17 DOM
-
2026-06-03days on market $59,900 Active 16 DOM
-
2026-06-02days on market $59,900 Active 15 DOM
-
2026-06-01days on market $59,900 Active 14 DOM
-
2026-05-31days on market $59,900 Active 13 DOM
-
2026-05-18$59,900 Active
-
2023-08-02soldstatus $203,000
-
2023-05-17soldstatus $75,500
-
1997-06-12soldstatus $27,000
ⓘ Source: listings_history table (triggers on properties + properties_extension) + one-shot
backfill from property_details.listing_events for pre-trigger history.
Climate risk First Street
- Flood 1/10 Low FEMA zone X (unshaded) · 0% chance over 30 yrs
- Wildfire 1/10 Low
- Heat 7/10 Severe 7 d/yr ≥103°F today · 15 d/yr by 30 yrs out
- Wind 6/10 Major 27% chance of damaging wind over 30 yrs
- Air quality 3/10 Moderate 3 unhealthy d/yr today · 4 by 30 yrs out
Nearby sold comps map
Loading sold comps map…
Walkable amenities ~0.75 mi
Loading nearby amenities…
Taxation est. · year 1
- Rental income
- $19,654
- − Mortgage interest
- −$3,355
- − Property taxes
- −$898
- − Insurance
- −$300
- − Repairs & maintenance
- −$1,572
- − Management
- −$1,572
- − Depreciation
- −$1,743
- Taxable income
- $10,214
- Est. tax owed @ 24.0%
- −$2,451
- After-tax cash flow
- $8,108/yr
For passive investors: Depreciation is non-cash, so a rental often shows a tax loss while cash-flowing — sheltering income. Rental losses are passive: they offset passive income freely, and up to $25,000/yr can offset ordinary (W-2) income if you actively participate and your MAGI is under $100k (phasing out to $0 by $150k); unused losses carry forward. On sale, claimed depreciation is recaptured at up to 25%, and gains may owe capital-gains tax (a 1031 exchange can defer both). Figures are a year-1 estimate at your 24.0% rate — not tax advice; consult a CPA.
Schools (NCES district)
- District
- Baltimore City Public Schools
- NCES district ID
- 2400090
- Math proficiency
- 7% ▼ -9.00%
- Reading proficiency
- 16% ▼ -5.00%
- Median HH income
- $42,108
- Composite
- 10.08/100
- National rank
- #9805
- State rank
- #24 of 24 in MD
Livability — Baltimore
- Score
- 76/100
- State rank
- #90
- US rank
- #3396
Category grades
Schools grade is shown separately in the Schools card above.
Census & demographics
- Census place
- Baltimore, MD
- County
- Baltimore City · 558,601 people
- City population
- 588,727
- Metro
- Baltimore-Columbia-Towson, MD
- Population (ZIP)
- 29,426
- Household income
- $42,031
- Rent vs Own
- Severe rent burden
- 2264.0
Population outlook (Baltimore County) Hauer SSP2
- Today (2025)
- 624,249 people
- By 2030
- 621,541 · -0.4%
- By 2040
- 609,756 · -2.3%
- By 2050
- 597,249 · -4.3%
- By 2075
- 552,236 · -11.5%
- By 2100
- 513,934 · -17.7%
Race, ethnicity, and origin ACS 2023
- Neighborhood character
- Predominantly Black (91%)
- Race & ethnicity
- Black 91% Hispanic / Latino 4% Two or more races 3% White 2%
- Foreign-born
- 3% · Canada
- Languages at home
- 96% English-only · Spanish 3% French/Haitian/Cajun 1%
Political lean MEDSL · Baltimore
- 2024 margin
- Solid D (+73.0) · D 85.2% · R 12.2% · Other 2.6%
- 2008→2024 swing
- -2.5pp toward R · 2008: 75.5pp · 2024: 73.0pp
- All cycles
- 2024: D+73.0 2020: D+76.6 2016: D+74.6 2012: D+76.4 2008: D+75.5
Not yet ingested
- Civics
- —
Market trends
- HPI YoY
- ▼ -107.42%
- Current HPI
- 164.3933
- Rent YoY
- ▲ 6.10%
- Metro
- Baltimore-Columbia-Towson, MD
- State GDP YoY
- ▲ 2.97%
- F500 in state
- 12
Industry mix (Fortune 500 HQ in MD)
| Industry | F500 HQs | Revenue |
|---|---|---|
| Aerospace / Defense | 1 | $71B |
|
||
| Utilities | 1 | $25B |
|
||
| Hotels | 1 | $24B |
|
||
| Consumer Goods | 1 | $7B |
|
||
| Real Estate | 1 | $6B |
|
||
| Chemicals | 1 | $2B |
|
||
Price history
+121.9% since first listed4 events — show timeline
- 2026-05-18 Listed $59,900 BRIGHT MLS
- 2023-08-02 Sold (Public Records) $203,000 Public Records
- 2023-05-17 Sold (Public Records) $75,500 Public Records
- 1997-06-12 Sold (Public Records) $27,000 Public Records
Property tax history
+11.6%/yrLatest (2025): $3,484 · +53.4% YoY. Source: county tax records.
Cash-flow waterfall
monthlySold comps — $/sqft
last 12 mo · ≤1 miLoading sold comps…