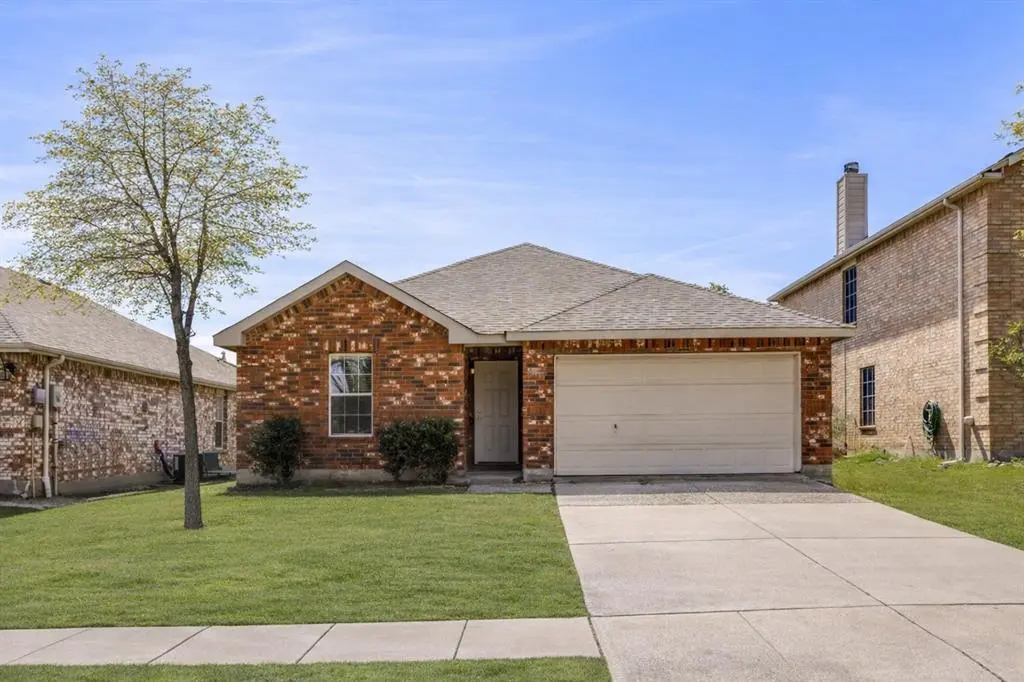
1442 Whitewater Dr · Little Elm, TX
Flood risk 1/10 · Minimal
- FEMA flood zone
- X (unshaded)
- Chance of flooding over 30 yrs
- 0.0%
- Est. flood insurance / yr
- $507 – $1,088
Fire risk 4/10 · Minor
- Est. fire insurance / yr
- $1,222 – $2,270
Heat risk 7/10 · Major
- Hot days now (above 109°F)
- 7 days/yr
- Hot days in 30 yrs
- 23 days/yr
Wind risk 6/10 · Moderate
- Chance of severe wind over 30 yrs
- 27.0%
Air-quality risk 4/10 · Minor
- Unhealthy air days now
- 4 days/yr
- Unhealthy air days in 30 yrs
- 5 days/yr
Risk factors via First Street. Map © Google.
Why this score? — see what drove the D- grade
The composite is a weighted blend of 9 inputs, each scored 0–100. Each bar is that input's sub-score; the figure is the points it added to the 100-point composite (weight × sub-score).
- ARV discount +14.8/15.0
- Cash flow +7.8/30.0
- Schools +3.6/10.0
- 1% rule +3.2/10.0
- Livability +3.2/5.0
- Condition / age +2.5/5.0
- Rent growth +2.1/5.0
- DSCR +1.8/10.0
- Appreciation +0.0/10.0
$279,900
🖨 Deal sheet (PDF) 📄 Offer letter ✓ Due diligence
Listing remarks MLS
Welcome to 1442 Whitewater Dr, a beautifully updated home in a sought-after Little Elm neighborhood, just minutes from the scenic shores of Lake Lewisville. This inviting 3-bedroom, 2-bathroom residence offers 1,429 square feet of comfortable living space, a 2-car garage, and a generously sized backyard ideal for relaxing or entertaining. Step inside to discover an open-concept layout that seamlessly connects the living, dining, and kitchen areas—perfect for both everyday living and hosting guests. Recent upgrades include luxury vinyl plank flooring, fresh neutral paint, updated lighting, ceiling fans, and modern hardware throughout, creating a clean and contemporary look. The kitchen is well-equipped with ample cabinetry, a breakfast bar, and a convenient pantry. The private primary suite features a walk-in closet and an en-suite bathroom with a soaking tub and separate shower. Two additional bedrooms are spacious and share a full guest bath. Outside, the spacious backyard offers endless possibilities—whether you envision a pool, garden, play area, or space for weekend gatherings. Situated in an established community with sidewalks and nearby parks, this home is just minutes from top-rated schools, major highways, shopping, dining, and entertainment. It’s also conveniently located approximately 15–20 minutes from the upcoming Universal Kids theme park, expected to be completed in late 2026—adding exciting future appeal and long-term value to the area. With proven rental income potential, this property also presents a fantastic opportunity for investors or buyers looking to offset their mortgage. Ideal for first-time buyers, downsizers, or investors, this home is a true standout in one of North Texas’ most desirable areas.
Key facts
- 6,055 sq ft lot
- 2 garage spots
- Built 2006
Neighborhood map
What this means for you Summary
Snapshot
- This is a 3-bed/2.0-bath single-family listed at $280k.
Deal economics
- At list price, monthly cash flow is $-317 ($-4k/yr) — negative.
- To cash-flow at today's rent, offer at most $224k (20.0% below list).
- To meet the 1% rule (rent ≥ 1% of price), the offer needs to be $231k (17.6% below list).
- Recommended offer: $224k (20.0% below list) — sets the bar for cash-flow.
- Cap rate 4.9% vs local median 3.0% in Little Elm — top-decile yield for the area; either an underpriced asset or a hidden risk that comps aren't pricing in. Stress-test before assuming the spread holds.
Location & tenants
- Location reads 64/100 on livability (#790 in TX) — a middle-class / working-renter tenant base. Strengths: crime A+, employment A+, housing A+; Watch: schools C-, amenities F, commute F.
- Little Elm ISD (suburban): math 36% / reading 42% proficiency, ranked #327 of 826 in TX (top 40%) — families likely to look elsewhere, expect single-tenant / working-renter base with shorter leases.
- Market conditions: Rents soft (-1.5%/yr); 1306 active listings in the ZIP; 24 comparable units currently listed for rent nearby; rentals at typical pace (median 25d on market — plan ~3-4 weeks tenant-placement turnaround); 46% of comp listings sitting > 30 days — soft ceiling on asking rent; high-income renter base; 10,531 units permitted in Denton County in 2024 (2,713 in 5+ unit buildings).
Forward outlook
- Local home prices are declining (-3.0%/yr); year-one equity from $2k of loan paydown is wiped out by about $8k of value loss. Plan a longer hold.
- Denton County population projected at +66% by 2050 — long-run rental-demand tailwind backs the buy-and-hold thesis.
Negotiation context
- It's been on market 69 days — a 6% lower offer ($263k) is reasonable based on typical stale-listing flexibility.
- 4 sale attempts since 11y ago; this cycle's ask has dropped $20k (7%) from the opening price — seller is motivated, your offer sets the floor, not the list.
Risks & watch-outs
- Climate carrying-cost: major wind risk, 27% chance of damaging wind over 30y; extreme-heat days projected 7→23/yr by 2055 (HVAC capex compounding) — expect insurance premiums to compound above CPI over the hold.
Questions for the listing agent
- What do current leases actually rent for vs. the listed asking? Can we see a recent rent roll and the last 12 months of T-12 income?
- It's been on market 69 days. Have you received any prior offers? Is the seller open to a 20% concession, seller financing, or rate buy-down credit?
- What does the HOA fee cover, when was the last increase, and are there any pending special assessments or reserve-fund shortfalls?
- Why hasn't it sold? Are there any deal-killer items the seller is aware of (foundation, flood, title, zoning, code violations)?
- Is there a deadline driving the sale (1031 exchange, divorce, estate, relocation)? That informs how much negotiation room exists.
- The area grade is low — what's the realistic commute time and amenity access for the typical tenant pool here? Any planned neighborhood developments (good or bad) we should know about?
- What's the average days-on-market for RENTAL listings here right now (not sales)? A rising rental-DOM trend means longer vacancies and softer asking-rent achievability than the comps imply.
- What's the recent tenant-quality profile in this submarket — average credit score on applications, eviction rate, late-payment / NSF rate, and stable-employment percentage? A property-management company in the area should have these aggregated.
- How much new for-sale + rental construction is in the pipeline within 1–3 miles? Heavy new supply typically softens prices + rents 12–24 months out; constrained supply supports both.
Investment metrics
- 1% rule
- 0.82% ✗
- Cap rate
- 4.94%
- Cash-on-cash
- -4.85%
- DSCR
- 0.78
- GRM
- 10.1
CMA / ARV
- ARV (median comp)
- $334,293
- List price
- $279,900
- Delta
- -16.27%
- Verdict
- UNDERPRICED
- Comps
- 20 within 1.0 mi
Show comp detail 12 sales within ~0.75 mi
| Address | Dist | Beds/Ba | Sqft | Sold | Price | $/sf | Match |
|---|---|---|---|---|---|---|---|
| 1521 Breeze Ln | 0.22mi | 3/2.0 | 1,429 (0%) | 8mo | $298,500 | $209 | 83 |
| 1413 Whitewater Dr | 0.08mi | 3/2.0 | 1,606 (+12%) | 0mo | $349,990 | $218 | 75 |
| 2624 Rockport Ln | 0.49mi | 3/2.0 | 1,507 (+6%) | 2mo | $250,000 | $166 | 66 |
| 2613 Salt Maker Way | 0.44mi | 3/2.0 | 1,507 (+6%) | 6mo | $299,000 | $198 | 66 |
| 1709 Silverwood Ln | 0.52mi | 3/2.0 | 1,507 (+6%) | 2mo | $299,000 | $198 | 65 |
| 1409 Sun Breeze Dr | 0.20mi | 3/2.0 | 1,615 (+13%) | 9mo | $315,000 | $195 | 61 |
| 1720 Pebblebrook Way | 0.46mi | 3/2.0 | 1,507 (+6%) | 11mo | $1,995 | $1 | 61 |
| 2617 Peach Dr | 0.74mi | 3/2.0 | 1,507 (+6%) | 3mo | $301,500 | $200 | 54 |
| 2716 Winterberry Ln | 0.49mi | 3/2.0 | 1,563 (+9%) | 10mo | $350,000 | $224 | 53 |
| 2117 Sunny Side Dr | 0.74mi | 4/2.0 (+1) | 1,502 (+5%) | 10mo | $369,900 | $246 | 43 |
| 1571 Thornhill Ln | 0.64mi | 3/2.0 | 1,268 (-11%) | 11mo | $290,000 | $229 | 42 |
| 2028 Sunny Side Dr | 0.59mi | 4/2.0 (+1) | 1,600 (+12%) | 12mo | $320,000 | $200 | 38 |
Match score weights: distance 35% · size 25% · config 20% · recency 20%. Top-matched comps best support the ARV.
Projected returns pro-forma
-3.0% appreciation · 0.0% rent growth · sell at horizon
- IRR
- -28.3%
- Equity multiple
- 0.08×
- Total profit
- $-72,121
- Equity at exit
- $41,734
- IRR
- -47.3%
- Equity multiple
- -0.46×
- Total profit
- $-114,232
- Equity at exit
- $24,201
Cash invested: $78,372 (down + closing). Projections, not guarantees.
Landlord ↔ Tenant lean methodology
- Overall (STATE)
- 87 Strongly Landlord-Friendly
- State Texas
- 87 Strongly Landlord-Friendly · R+5
- County
- — inherits STATE
- City
- — inherits STATE
ZIP-level market 75068
- Home prices YoY
- -25.5%
- Rents YoY
- -1.5%
- Active inventory
- 1306
- Price-to-rent
- 10.1×
Monthly cashflow live
- Estimated rent
- $2,305 high interval (Pro) →
- Mortgage (P&I)
- −$1,468
- Tax from tax record
- −$498 /mo · $5,981/yr
- Insurance
- −$117
- HOA
- −$55
- Vacancy / Maint / Mgmt
- −$484
- Net cashflow
- $-317
Break-even live
Sensitivity live
| Price | -10% $-158 | -5% $-237 | +0% $-317 | +5% $-396 | +10% $-475 |
|---|---|---|---|---|---|
| Rent | -10% $-499 | -5% $-408 | +0% $-317 | +5% $-226 | +10% $-135 |
| Rate | -1.0pp $-176 | -0.5pp $-245 | base $-317 | +0.5pp $-389 | +1.0pp $-463 |
UW: 25.0% down · 7.5% · 30yr · 1.5% tax · 5.0% vac · 8.0% maint · 8.0% mgmt
Financing live
Cash to close
- Down payment
- $69,975
- Closing costs
- $8,397
- Reserves months
- —
- Total cash needed
- —
Loan-product check · same deal, 3 products live
Conventional
25% down · 7.5% · 30yr
- Down + closing
- —
- Monthly P&I
- —
- Monthly cashflow
- —
- DSCR
- —
- Eligible?
- —
Personal DTI + credit; lowest rate.
DSCR
20% down · 8.5% · 30yr
- Down + closing
- —
- Monthly P&I
- —
- Monthly cashflow
- —
- DSCR
- —
- Eligible?
- —
No personal income docs; deal must DSCR.
Hard money
10% down · 12.0% · 12mo
- Down + closing
- —
- Monthly P&I
- —
- Monthly cashflow
- —
- DSCR
- —
- Eligible?
- —
Short-term bridge; refi at stabilization.
Rent comps 24 comps
| Address | Beds | Baths | Sqft | Rent | $/sqft | DOM | Units | Dist |
|---|---|---|---|---|---|---|---|---|
| 1428 Waterford Dr Little Elm, TX | 3.0 | 2.0 | 1429 | $2,115 | $1.48 | 2d | 1 | 0.10mi |
| 2832 Cresent Lake Dr Little Elm, TX | 3.0 | 2.0 | 1543 | $2,250 | $1.46 | 44d | 1 | 0.21mi |
| 2793 Cresent Lake Dr Little Elm, TX | 3.0 | 2.0 | 1841 | $2,300 | $1.25 | 5d | 1 | 0.21mi |
| 2629 Salt Maker Way Little Elm, TX | 3.0 | 2.0 | 1507 | $1,895 | $1.26 | 44d | 1 | 0.38mi |
| 2600 Misty Harbor Dr Little Elm, TX | 3.0 | 2.0 | 1831 | $2,000 | $1.09 | 45d | 1 | 0.49mi |
| 2716 Dawn Spring Dr Little Elm, TX | 3.0 | 2.0 | 1643 | $2,100 | $1.28 | 25d | 1 | 0.66mi |
| 2408 Rolling Ridge Dr Little Elm, TX | 3.0 | 2.0 | 1268 | $1,895 | $1.49 | 44d | 1 | 0.71mi |
| 338 Castleridge Dr Unit A Little Elm, TX | 3.0 | 2.5 | 1491 | $2,550 | $1.71 | 7d | 1 | 0.76mi |
| 338 Castleridge Dr Little Elm, TX | 3.0 | 2.5 | 1491 | $2,550 | $1.71 | 44d | 1 | 0.76mi |
| 320 Woodgrove Dr Unit A Little Elm, TX | 3.0 | 2.5 | 1740 | $2,100 | $1.21 | 25d | 1 | 0.76mi |
| 529 Port Arthur Dr Little Elm, TX | 3.0 | 2.0 | 1167 | $2,000 | $1.71 | 44d | 1 | 0.80mi |
| 1046 Port Isabel Dr Little Elm, TX | 3.0 | 2.0 | 1564 | $2,200 | $1.41 | 13d | 1 | 0.90mi |
| 2333 Aurora Dr Little Elm, TX | 3.0 | 2.0 | 1818 | $2,400 | $1.32 | 25d | 1 | 0.91mi |
| 1006 Port Aransas Dr Little Elm, TX | 4.0 | 2.0 | 1729 | $2,295 | $1.33 | 12d | 1 | 0.92mi |
| 1579 Crown View Dr Little Elm, TX | 3.0 | 2.0 | 1600 | $2,075 | $1.30 | 5d | 1 | 0.93mi |
| 2365 White Pine Dr Little Elm, TX | 3.0 | 2.0 | 1868 | $2,310 | $1.24 | 2d | 1 | 0.97mi |
| 2253 Barx Dr Little Elm, TX | 3.0 | 2.0 | 1521 | $2,195 | $1.44 | 3d | 1 | 1.01mi |
| 2157 Olivereta Dr Little Elm, TX | 3.0 | 2.0 | 1521 | $2,400 | $1.58 | 44d | 1 | 1.11mi |
| 119 Hillside Beach Dr Little Elm, TX | 3.0 | 2.0 | 1400 | $1,800 | $1.29 | 44d | 1 | 1.19mi |
| 2701 Evening Mist Dr Little Elm, TX | 3.0 | 2.0 | 1832 | $2,500 | $1.36 | 44d | 1 | 1.32mi |
| 413 Windridge Dr Little Elm, TX | 4.0 | 2.0 | 1527 | $1,100 | $0.72 | 25d | 1 | 1.33mi |
| 2104 Oakridge Dr Little Elm, TX | 3.0 | 2.0 | 1610 | $2,400 | $1.49 | 44d | 1 | 1.34mi |
| 2757 Cascade Cove Dr Little Elm, TX | 4.0 | 2.0 | 1786 | $2,600 | $1.46 | 6d | 1 | 1.35mi |
| 2955 Stunning Dr Little Elm, TX | 3.0 | 3.5 | 1844 | $2,700 | $1.46 | 44d | 1 | 1.50mi |
HOA detail
- Monthly dues
- $55 · $660/yr
- Likely covers
- waterpool
Listing history 24 events
-
2026-06-18days on market $279,900 Active 69 DOM
-
2026-06-17pricedays on market $279,900 Active 68 DOM
-
2026-06-16days on market $299,900 Active 67 DOM
-
2026-06-15days on market $299,900 Active 66 DOM
-
2026-06-13days on market $299,900 Active 64 DOM
-
2026-06-13days on market $299,900 Active 63 DOM
-
2026-06-09days on market $299,900 Active 60 DOM
-
2026-06-08days on market $299,900 Active 59 DOM
-
2026-06-07days on market $299,900 Active 58 DOM
-
2026-06-04days on market $299,900 Active 55 DOM
-
2026-06-03days on market $299,900 Active 54 DOM
-
2026-06-02days on market $299,900 Active 53 DOM
-
2026-06-01days on market $299,900 Active 52 DOM
-
2026-05-31days on market $299,900 Active 51 DOM
-
2026-03-31$299,900 Active 1793-char remark
Show marketing remark (1793 chars)
Welcome to 1442 Whitewater Dr, a beautifully updated home in a sought-after Little Elm neighborhood, just minutes from the scenic shores of Lake Lewisville. This inviting 3-bedroom, 2-bathroom residence offers 1,429 square feet of comfortable living space, a 2-car garage, and a generously sized backyard ideal for relaxing or entertaining. Step inside to discover an open-concept layout that seamlessly connects the living, dining, and kitchen areas—perfect for both everyday living and hosting guests. Recent upgrades include luxury vinyl plank flooring, fresh neutral paint, updated lighting, ceiling fans, and modern hardware throughout, creating a clean and contemporary look. The kitchen is well-equipped with ample cabinetry, a breakfast bar, and a convenient pantry. The private primary suite features a walk-in closet and an en-suite bathroom with a soaking tub and separate shower. Two additional bedrooms are spacious and share a full guest bath. Outside, the spacious backyard offers endless possibilities—whether you envision a pool, garden, play area, or space for weekend gatherings. Situated in an established community with sidewalks and nearby parks, this home is just minutes from top-rated schools, major highways, shopping, dining, and entertainment. It’s also conveniently located approximately 15–20 minutes from the upcoming Universal Kids theme park, expected to be completed in late 2026—adding exciting future appeal and long-term value to the area. With proven rental income potential, this property also presents a fantastic opportunity for investors or buyers looking to offset their mortgage. Ideal for first-time buyers, downsizers, or investors, this home is a true standout in one of North Texas’ most desirable areas.
-
2026-02-24status Active
-
2026-02-24historical
-
2025-10-06price $299,000
-
2025-08-01price $319,000
-
2025-06-11$339,000 Active
-
2024-03-26soldstatus
-
2015-03-20historical
-
2015-03-18$149,500 Active
-
2014-07-14soldstatus
ⓘ Source: listings_history table (triggers on properties + properties_extension) + one-shot
backfill from property_details.listing_events for pre-trigger history.
Tax reassessment forecast TX · Resets to sale price
- Current annual tax
- $5,981 · $498/mo
- Projected year-2 tax
- $5,981 · $498/mo
- Expected delta
- $0/yr ($0/mo · 0.0%)
ⓘ Screening estimate from a state-policy table — verify with the county assessor before closing.
Climate risk First Street
- Flood 1/10 Low FEMA zone X (unshaded) · 0% chance over 30 yrs
- Wildfire 4/10 Moderate
- Heat 7/10 Severe 7 d/yr ≥109°F today · 23 d/yr by 30 yrs out
- Wind 6/10 Major 27% chance of damaging wind over 30 yrs
- Air quality 4/10 Moderate 4 unhealthy d/yr today · 5 by 30 yrs out
Nearby sold comps map
Loading sold comps map…
Walkable amenities ~0.75 mi
Loading nearby amenities…
Taxation est. · year 1
- Rental income
- $27,664
- − Mortgage interest
- −$15,679
- − Property taxes
- −$5,981
- − Insurance
- −$1,400
- − Repairs & maintenance
- −$2,213
- − Management
- −$2,213
- − HOA
- −$660
- − Depreciation
- −$8,143
- Taxable loss
- −$8,624
- Est. tax savings @ 24.0%
- +$2,070
- After-tax cash flow
- $-1,730/yr
For passive investors: Depreciation is non-cash, so a rental often shows a tax loss while cash-flowing — sheltering income. Rental losses are passive: they offset passive income freely, and up to $25,000/yr can offset ordinary (W-2) income if you actively participate and your MAGI is under $100k (phasing out to $0 by $150k); unused losses carry forward. On sale, claimed depreciation is recaptured at up to 25%, and gains may owe capital-gains tax (a 1031 exchange can defer both). Figures are a year-1 estimate at your 24.0% rate — not tax advice; consult a CPA.
Schools (NCES district)
- District
- Little Elm ISD
- NCES district ID
- 4827720
- Math proficiency
- 36% ▼ -11.00%
- Reading proficiency
- 42% ▼ -5.00%
- Median HH income
- $76,400
- Composite
- 36.17/100
- National rank
- #4734
- State rank
- #327 of 826 in TX
Livability — Little Elm
- Score
- 64/100
- State rank
- #790
- US rank
- #14430
Category grades
Schools grade is shown separately in the Schools card above.
Census & demographics
- Census place
- Little Elm, TX
- County
- Denton County · 901,654 people
- City population
- 72,710
- Metro
- Dallas-Fort Worth-Arlington, TX
- Population (ZIP)
- 72,710
- Household income
- $126,635
- Rent vs Own
- Severe rent burden
- 829.0
Population outlook (Denton County) Hauer SSP2
- Today (2025)
- 1,053,010 people
- By 2030
- 1,192,269 · +13.2%
- By 2040
- 1,472,920 · +39.9%
- By 2050
- 1,746,506 · +65.9%
- By 2075
- 2,358,497 · +124.0%
- By 2100
- 2,779,183 · +163.9%
Race, ethnicity, and origin ACS 2023
- Neighborhood character
- Highly diverse neighborhood (Simpson 0.74)
- Race & ethnicity
- White 40% Hispanic / Latino 23% Black 19% Two or more races 15% Asian 12% Native American 1%
- Hispanic origin (detail)
- Mexican 17%
- Common ancestry
- Lithuanian 2% Italian 2% Slovak 1%
- Foreign-born
- 19% · Canada, South Korea, China
- Languages at home
- 71% English-only · Spanish 15% Other Asian/Pacific 5% Other Indo-European 4%
Political lean MEDSL · Denton
- 2024 margin
- R (+13.2) · D 42.7% · R 55.8% · Other 1.5%
- 2008→2024 swing
- +11.0pp toward D · 2008: -24.2pp · 2024: -13.2pp
- All cycles
- 2024: R+13.2 2020: R+8.1 2016: R+20.2 2012: R+31.7 2008: R+24.2
Not yet ingested
- Civics
- —
Market trends
- HPI YoY
- ▼ -85.41%
- Current HPI
- 249.755
- Rent YoY
- ▼ -1.50%
- Metro
- Dallas-Fort Worth-Arlington, TX
- State GDP YoY
- ▲ 3.95%
- F500 in state
- 110
Industry mix (Fortune 500 HQ in TX)
| Industry | F500 HQs | Revenue |
|---|---|---|
| Energy | 16 | $1,198B |
|
||
| Technology | 5 | $198B |
|
||
| Engineering / Construction | 4 | $72B |
|
||
| Energy Services | 3 | $60B |
|
||
| Utilities | 3 | $41B |
|
||
| Healthcare | 2 | $330B |
|
||
Price history
+100.6% since first listed10 events — show timeline
- 2026-03-31 Listed $299,900 NTREIS
- 2026-02-24 Relisted — NTREIS
- 2026-02-24 Listing Removed — NTREIS
- 2025-10-06 Price Changed $299,000 NTREIS
- 2025-08-01 Price Changed $319,000 NTREIS
- 2025-06-11 Listed $339,000 NTREIS
- 2024-03-26 Sold (Public Records) — Public Records
- 2015-03-20 Listing Removed — NTREIS
- 2015-03-18 Listed $149,500 NTREIS
- 2014-07-14 Sold (Public Records) — Public Records
Property tax history
+5.0%/yrLatest (2025): $5,981 · -8.2% YoY. Source: county tax records.
Cash-flow waterfall
monthlySold comps — $/sqft
last 12 mo · ≤1 miLoading sold comps…