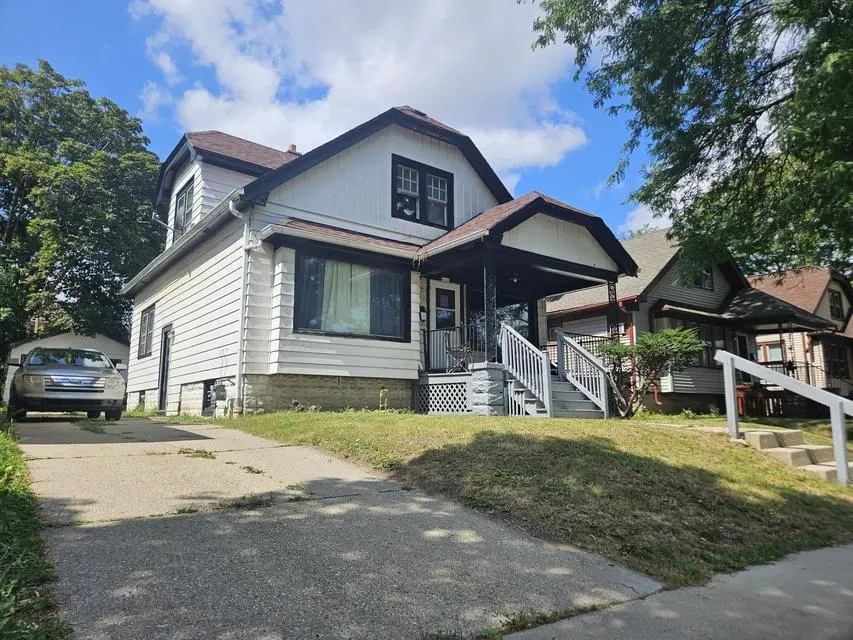
4143 N 10th St · Milwaukee, WI
Flood risk 1/10 · Minimal
- FEMA flood zone
- X (unshaded)
- Chance of flooding over 30 yrs
- 0.0%
- Est. flood insurance / yr
- $473 – $860
Fire risk 1/10 · Minimal
- Est. fire insurance / yr
- $636 – $1,182
Heat risk 2/10 · Minimal
- Hot days now (above 98°F)
- 7 days/yr
- Hot days in 30 yrs
- 13 days/yr
Wind risk 2/10 · Minimal
- Chance of severe wind over 30 yrs
- —
Air-quality risk 3/10 · Minor
- Unhealthy air days now
- 3 days/yr
- Unhealthy air days in 30 yrs
- 4 days/yr
Risk factors via First Street. Map © Google.
Why this score? — see what drove the C grade
The composite is a weighted blend of 9 inputs, each scored 0–100. Each bar is that input's sub-score; the figure is the points it added to the 100-point composite (weight × sub-score).
- Cash flow +24.8/30.0
- DSCR +8.1/10.0
- ARV discount +6.8/15.0
- 1% rule +6.3/10.0
- Rent growth +4.7/5.0
- Livability +4.0/5.0
- Condition / age +2.5/5.0
- Schools +1.2/10.0
- Appreciation +0.0/10.0
$120,000
🖨 Deal sheet (PDF) 📄 Offer letter ✓ Due diligence
Listing remarks MLS
This classic, ''Old Style'' Milwaukee residence , built in 1926 boasts three bedrooms and one full bathroom. The layout includes a stairway to an upper level as well as a full basement and an attic, providing ample room for storage or potential. What's more, set behind the home in a grassy backyard and a detached garage. This income producing home fetches $1200 a month.
Key facts
- Attic
- Grassy backyard
- Full basement
Tags
Property features AI
Exterior
- Parking: Detached 1-car garage; Approximately 1.5 garage parking spaces total
- Utilities: Municipal water; Municipal sewer; Natural gas service
- Home design: Single-family home; One-story design; Entry and main living spaces on the main level
- Construction: Aluminum/steel and vinyl siding; Assessor/public record for year built
- Exterior features: Aluminum and vinyl exterior; Sidewalks
Interior
- Kitchen: Main-level kitchen (approx. 10 x 10)
- Bedrooms: Three bedrooms on the main level (each approximately 10 x 10); Main-level primary bedroom (10 x 10)
- Bathrooms: One full bathroom with tub
- Heating & cooling: Forced air heating; Natural gas fuel
- Interior features: Full finished basement; Living room on main level; Dining room on main level; Kitchen on main level
- Laundry & utility: Forced air heating (natural gas)
Neighborhood map
What this means for you Summary
Snapshot
- This is a 3-bed/1.0-bath single-family listed at $120k.
Deal economics
- At list price, monthly cash flow is $255 ($3k/yr) — positive.
- The deal already cash-flows at list — no discount required.
- Meets the 1% rule at list price ($1k rent vs $120k).
- Cap rate 8.8% vs local median 5.1% in Milwaukee — top-decile yield for the area; either an underpriced asset or a hidden risk that comps aren't pricing in. Stress-test before assuming the spread holds.
Location & tenants
- Location reads 81/100 on livability (#55 in WI, #1,534 nationally) — a professional / high-income tenant draw. Strengths: amenities A+, commute A+, cost of living A+; Watch: employment D+, schools F, crime F.
- Milwaukee School District (urban): math 10% / reading 18% proficiency, ranked #337 of 342 in WI (top 98%) — low school quality limits family demand, transient renter base, plan for 1-2y turnover; 77% free/reduced lunch — lower-income household profile, screen leases tightly.
- Market conditions: Rents rising fast (+8.6%/yr); 171 active listings in the ZIP; 31 comparable units currently listed for rent nearby; rentals at typical pace (median 25d on market — plan ~3-4 weeks tenant-placement turnaround); 1,017 units permitted in Milwaukee County in 2024 (803 in 5+ unit buildings).
- This rent runs 34% of the median local income ($48k/yr) — at the standard rent-burdened threshold; future hikes will face affordability resistance.
Forward outlook
- Local home prices are declining (-3.0%/yr); year-one equity from $830 of loan paydown is wiped out by about $4k of value loss. Plan a longer hold.
- Milwaukee County population projected at +4% by 2050 — modest demand growth; plan on rents tracking national, not racing it.
- At projected returns (-3.0% appreciation + 8.0% rent growth), your $34k cash investment doubles in ~8 years — after that, you're playing with house money.
Negotiation context
- Only 13 days on market — expect competitive offers; lowballing is unlikely to land.
- 4 sale attempts since 13y ago with the ask held roughly flat each time — persistent listings suggest the price (not the market) is what's stuck; bring a comps-based counter.
- Current owner paid $53k; list at $120k implies a 126% gain — meaningful room to come down on a strong offer.
Risks & watch-outs
- Watch-outs: built in 1926 — expect roof / HVAC / electrical / plumbing capex.
Questions for the listing agent
- Built in 1926 — when were the roof, HVAC, electrical panel, plumbing, and water heater last replaced?
- Is there a deadline driving the sale (1031 exchange, divorce, estate, relocation)? That informs how much negotiation room exists.
- Schools are F-rated, which usually means shorter tenancies and higher turnover. Who's the typical renter profile here, and what's been the actual vacancy rate?
- Crime grade is F in this area — have there been break-ins, vandalism, or insurance claims at this property in the last 3 years? What carrier currently insures it and at what premium?
- What's the average days-on-market for RENTAL listings here right now (not sales)? A rising rental-DOM trend means longer vacancies and softer asking-rent achievability than the comps imply.
- What's the recent tenant-quality profile in this submarket — average credit score on applications, eviction rate, late-payment / NSF rate, and stable-employment percentage? A property-management company in the area should have these aggregated.
- How much new for-sale + rental construction is in the pipeline within 1–3 miles? Heavy new supply typically softens prices + rents 12–24 months out; constrained supply supports both.
Investment metrics
- 1% rule
- 1.13% ✓
- Cap rate
- 8.84%
- Cash-on-cash
- 9.11%
- DSCR
- 1.41
- GRM
- 7.4
CMA / ARV
- ARV (on-the-fly)
- $118,059
- Comps found
- 12
Show comp detail 12 sales within ~0.75 mi
| Address | Dist | Beds/Ba | Sqft | Sold | Price | $/sf | Match |
|---|---|---|---|---|---|---|---|
| 4110 N 7th St | 0.22mi | 3/1.0 | 1,296 (-4%) | 4mo | $95,000 | $73 | 79 |
| 4182 N 13th St | 0.17mi | 4/2.0 (+1) | 1,351 (-0%) | 5mo | $239,000 | $177 | 79 |
| 3840 N 18th St St | 0.62mi | 3/2.0 | 1,413 (+4%) | 2mo | $120,000 | $85 | 58 |
| 3868 N 15th St | 0.46mi | 3/1.0 | 1,233 (-9%) | 8mo | $70,500 | $57 | 57 |
| 3850 N 19th Pl | 0.71mi | 3/1.0 | 1,387 (+2%) | 8mo | $90,000 | $65 | 56 |
| 4166 N 17th St | 0.41mi | 3/1.5 | 1,524 (+12%) | 6mo | $119,000 | $78 | 53 |
| 4348 N 19th St | 0.59mi | 3/2.0 | 1,499 (+10%) | 1mo | $230,000 | $153 | 50 |
| 3721 N 10th St | 0.53mi | 4/1.0 (+1) | 1,497 (+10%) | 8mo | $130,000 | $87 | 46 |
| 3830 N 18th St | 0.63mi | 3/1.0 | 1,208 (-11%) | 8mo | $90,000 | $75 | 45 |
| 4215 N 19th St | 0.58mi | 2/1.0 (-1) | 1,190 (-12%) | 8mo | $130,000 | $109 | 41 |
| 4164 N 21st St | 0.73mi | 3/2.0 | 1,205 (-11%) | 6mo | $150,000 | $124 | 38 |
| 4666 N Ironwood Ln | 0.67mi | 4/3.0 (+1) | 1,511 (+11%) | 6mo | $339,900 | $225 | 32 |
Match score weights: distance 35% · size 25% · config 20% · recency 20%. Top-matched comps best support the ARV.
Projected returns pro-forma
-3.0% appreciation · 8.0% rent growth · sell at horizon
- IRR
- 2.9%
- Equity multiple
- 1.12×
- Total profit
- $3,963
- Equity at exit
- $17,892
- IRR
- 16.7%
- Equity multiple
- 2.70×
- Total profit
- $56,981
- Equity at exit
- $10,375
Cash invested: $33,600 (down + closing). Projections, not guarantees.
Landlord ↔ Tenant lean methodology
- Overall (STATE)
- 73 Landlord-Friendly
- State Wisconsin
- 73 Landlord-Friendly · R+2
- County
- — inherits STATE
- City
- — inherits STATE
ZIP-level market 53209
- Rents YoY
- 8.6%
- Active inventory
- 171
- Price-to-rent
- 7.4×
Monthly cashflow live
- Estimated rent
- $1,354 high interval (Pro) →
- Mortgage (P&I)
- −$629
- Tax from tax record
- −$135 /mo · $1,626/yr
- Insurance
- −$50
- HOA
- −$0
- Vacancy / Maint / Mgmt
- −$284
- Net cashflow
- $255
Break-even live
Sensitivity live
| Price | -10% $323 | -5% $289 | +0% $255 | +5% $221 | +10% $187 |
|---|---|---|---|---|---|
| Rent | -10% $148 | -5% $202 | +0% $255 | +5% $308 | +10% $362 |
| Rate | -1.0pp $315 | -0.5pp $286 | base $255 | +0.5pp $224 | +1.0pp $192 |
UW: 25.0% down · 7.5% · 30yr · 1.5% tax · 5.0% vac · 8.0% maint · 8.0% mgmt
Financing live
Cash to close
- Down payment
- $30,000
- Closing costs
- $3,600
- Reserves months
- —
- Total cash needed
- —
Loan-product check · same deal, 3 products live
Conventional
25% down · 7.5% · 30yr
- Down + closing
- —
- Monthly P&I
- —
- Monthly cashflow
- —
- DSCR
- —
- Eligible?
- —
Personal DTI + credit; lowest rate.
DSCR
20% down · 8.5% · 30yr
- Down + closing
- —
- Monthly P&I
- —
- Monthly cashflow
- —
- DSCR
- —
- Eligible?
- —
No personal income docs; deal must DSCR.
Hard money
10% down · 12.0% · 12mo
- Down + closing
- —
- Monthly P&I
- —
- Monthly cashflow
- —
- DSCR
- —
- Eligible?
- —
Short-term bridge; refi at stabilization.
Rent comps 31 comps
| Address | Beds | Baths | Sqft | Rent | $/sqft | DOM | Units | Dist |
|---|---|---|---|---|---|---|---|---|
| 4048 N 7th St Milwaukee, WI | 2.0 | 1.0 | 1100 | $1,150 | $1.05 | 24d | 1 | 0.29mi |
| 3908 N 6th St Milwaukee, WI | 2.0 | 1.0 | 1100 | $1,150 | $1.05 | 24d | 1 | 0.43mi |
| 3927-3929 N 17th St Milwaukee, WI | 2.0 | 1.0 | 900 | $1,195 | $1.33 | 44d | 1 | 0.53mi |
| 3747 N 16th St Milwaukee, WI | 2.0 | 1.0 | 1200 | $875 | $0.73 | 44d | 1 | 0.62mi |
| 2116 W Atkinson Ave Unit A Milwaukee, WI | 4.0 | 1.0 | 1707 | $2,000 | $1.17 | 2d | 1 | 0.75mi |
| 3911 N 20th St Unit 3913 Milwaukee, WI | 2.0 | 1.0 | 950 | $995 | $1.05 | 24d | 1 | 0.75mi |
| 3646 N 19th St Milwaukee, WI | 2.0 | 1.0 | 935 | $1,100 | $1.18 | 5d | 1 | 0.78mi |
| 3600 N Vel R. Phillips Ave Milwaukee, WI | 2.0 | 1.0 | 900 | $950 | $1.06 | 5d | 1 | 0.83mi |
| 3703 N 1st St Unit Upper-3705 Milwaukee, WI | 3.0 | 1.0 | 1034 | $1,200 | $1.16 | 44d | 1 | 0.89mi |
| 3416 N 17th St Unit 1 Milwaukee, WI | 3.0 | 1.0 | 1200 | $1,100 | $0.92 | 44d | 1 | 0.95mi |
| 3298 N 13th St Milwaukee, WI | 3.0 | 1.0 | 885 | $895 | $1.01 | 44d | 1 | 0.99mi |
| 2106A W Keefe Ave Unit 2106 Lower Milwaukee, WI | 3.0 | 1.0 | 1300 | $1,100 | $0.85 | 18d | 1 | 1.03mi |
| 4848 N Lydell Ave Glendale, WI | 2.0 | 2.0 | 1097 | $1,622 | $1.48 | 5d | 2 | 1.05mi |
| 4227 N 26th St Milwaukee, WI | 2.0 | 1.0 | 950 | $1,000 | $1.05 | 18d | 1 | 1.11mi |
| 100 E Chateau Pl Whitefish Bay, WI | 2.0 | 1.0–2.0 | 1175 | $1,950 | $1.66 | 2d | 1 | 1.18mi |
| 4532 N Wilson Dr Milwaukee, WI | 2.0 | 1.0 | 950 | $1,560 | $1.64 | 44d | 1 | 1.20mi |
| 3373 N Richards St Milwaukee, WI | 2.0 | 1.0 | 950 | $1,150 | $1.21 | 24d | 1 | 1.21mi |
| 312 E Townsend St Unit 312 Milwaukee, WI | 3.0 | 1.0 | 1400 | $1,250 | $0.89 | 24d | 1 | 1.22mi |
| 1326 W Burleigh St Unit 1326 Lower Milwaukee, WI | 2.0 | 1.0 | 900 | $825 | $0.92 | 3d | 1 | 1.25mi |
| 4355 N 28th St Milwaukee, WI | 2.0 | 1.0 | 1118 | $975 | $0.87 | 22d | 1 | 1.26mi |
| 3352 N Richards St Unit Second floor Milwaukee, WI | 2.0 | 1.0 | 1000 | $1,150 | $1.15 | 44d | 1 | 1.26mi |
| 3045 N 11th St #3047 Milwaukee, WI | 3.0 | 1.0 | 1065 | $1,175 | $1.10 | 5d | 1 | 1.30mi |
| 3156 N 1st St Milwaukee, WI | 2.0 | 1.0 | 900 | $895 | $0.99 | 44d | 1 | 1.35mi |
| 3025 N 6th St Milwaukee, WI | 2.0 | 1.0 | 1153 | $1,125 | $0.98 | 44d | 1 | 1.36mi |
| 3368 N Booth St #3374 Milwaukee, WI | 2.0 | 1.0 | 900 | $950 | $1.06 | 44d | 1 | 1.37mi |
| 3368 N Booth St #3374 Milwaukee, WI | 2.0 | 1.0 | 900 | $950 | $1.06 | 24d | 1 | 1.37mi |
| 3255 N Buffum St Unit 3255 Upper Milwaukee, WI | 2.0 | 1.0 | 1100 | $1,350 | $1.23 | 44d | 1 | 1.37mi |
| 4451 N Marlborough Dr Unit 2 Shorewood, WI | 2.0 | 1.0 | 1250 | $2,125 | $1.70 | 4d | 1 | 1.38mi |
| 3388 N 27th St Unit 3388 Front House Milwaukee, WI | 4.0 | 1.0 | 1212 | $1,550 | $1.28 | 5d | 1 | 1.42mi |
| 1104 E Glendale Ave Unit 1104 Shorewood, WI | 3.0 | 1.5 | 1300 | $2,395 | $1.84 | 17d | 1 | 1.45mi |
| 223 E Burleigh St Unit 223 Milwaukee, WI | 4.0 | 1.0 | 1153 | $1,395 | $1.21 | 44d | 1 | 1.49mi |
Listing history 9 events
-
2026-06-21days on market $120,000 Active 13 DOM
-
2026-06-18days on market $120,000 Active 10 DOM
-
2026-06-17days on market $120,000 Active 9 DOM
-
2026-06-16days on market $120,000 Active 8 DOM
-
2026-06-15days on market $120,000 Active 7 DOM
-
2026-06-13days on market $120,000 Active 5 DOM
-
2026-06-13days on market $120,000 Active 4 DOM
-
2026-06-08remarks 372-char remark
-
2026-06-08$120,000 Active 1 DOM
ⓘ Source: listings_history table (triggers on properties + properties_extension) + one-shot
backfill from property_details.listing_events for pre-trigger history.
Tax reassessment forecast WI · Partial reset (capped growth)
- Current annual tax
- $1,626 · $135/mo
- Projected year-2 tax
- $1,923 · $160/mo
- Expected delta
- +$297/yr (+$25/mo · 18.3%)
ⓘ Screening estimate from a state-policy table — verify with the county assessor before closing.
Climate risk First Street
- Flood 1/10 Low FEMA zone X (unshaded) · 0% chance over 30 yrs
- Wildfire 1/10 Low
- Heat 2/10 Low 7 d/yr ≥98°F today · 13 d/yr by 30 yrs out
- Wind 2/10 Low
- Air quality 3/10 Moderate 3 unhealthy d/yr today · 4 by 30 yrs out
Nearby sold comps map
Loading sold comps map…
Walkable amenities ~0.75 mi
Loading nearby amenities…
Taxation est. · year 1
- Rental income
- $16,249
- − Mortgage interest
- −$6,722
- − Property taxes
- −$1,626
- − Insurance
- −$600
- − Repairs & maintenance
- −$1,300
- − Management
- −$1,300
- − Depreciation
- −$3,491
- Taxable income
- $1,211
- Est. tax owed @ 24.0%
- −$291
- After-tax cash flow
- $2,769/yr
For passive investors: Depreciation is non-cash, so a rental often shows a tax loss while cash-flowing — sheltering income. Rental losses are passive: they offset passive income freely, and up to $25,000/yr can offset ordinary (W-2) income if you actively participate and your MAGI is under $100k (phasing out to $0 by $150k); unused losses carry forward. On sale, claimed depreciation is recaptured at up to 25%, and gains may owe capital-gains tax (a 1031 exchange can defer both). Figures are a year-1 estimate at your 24.0% rate — not tax advice; consult a CPA.
Schools (NCES district)
- District
- Milwaukee School District
- NCES district ID
- 5509600
- Math proficiency
- 10% ▼ -5.00%
- Reading proficiency
- 18% ▬ 0.00%
- Median HH income
- $36,339
- Composite
- 11.61/100
- National rank
- #9696
- State rank
- #337 of 342 in WI
Livability — Milwaukee
- Score
- 81/100
- State rank
- #55
- US rank
- #1534
Category grades
Schools grade is shown separately in the Schools card above.
Census & demographics
- Census place
- Milwaukee, WI
- County
- Milwaukee County · 926,379 people
- City population
- 573,768
- Metro
- Milwaukee-Waukesha, WI
- Population (ZIP)
- 45,170
- Household income
- $48,486
- Rent vs Own
- Severe rent burden
- 3390.0
Population outlook (Milwaukee County) Hauer SSP2
- Today (2025)
- 995,758 people
- By 2030
- 1,009,124 · +1.3%
- By 2040
- 1,028,128 · +3.3%
- By 2050
- 1,040,066 · +4.4%
- By 2075
- 1,057,849 · +6.2%
- By 2100
- 1,039,774 · +4.4%
Race, ethnicity, and origin ACS 2023
- Neighborhood character
- Predominantly Black (66%)
- Race & ethnicity
- Black 66% White 22% Hispanic / Latino 5% Two or more races 5% Asian 2%
- Hispanic origin (detail)
- Mexican 2% Puerto Rican 3%
- Common ancestry
- Romanian 3% Portuguese 1% Iranian 1%
- Foreign-born
- 3% · Canada
- Languages at home
- 92% English-only · Spanish 4% Other Asian/Pacific 1% Russian/Polish/Slavic 1%
Political lean MEDSL · Milwaukee
- 2024 margin
- Solid D (+38.5) · D 68.3% · R 29.8% · Other 1.8%
- 2008→2024 swing
- +2.7pp toward D · 2008: 35.9pp · 2024: 38.5pp
- All cycles
- 2024: D+38.5 2020: D+39.9 2016: D+37.5 2012: D+34.6 2008: D+35.9
Not yet ingested
- Civics
- —
Market trends
- HPI YoY
- ▼ -194.98%
- Current HPI
- 172.4275
- Rent YoY
- ▲ 8.61%
- Metro
- Milwaukee-Waukesha, WI
- State GDP YoY
- ▲ 2.10%
- F500 in state
- 20
Industry mix (Fortune 500 HQ in WI)
| Industry | F500 HQs | Revenue |
|---|---|---|
| Industrial Machinery | 4 | $23B |
|
||
| Industrial Technology | 2 | $36B |
|
||
| Insurance | 1 | $36B |
|
||
| Professional Services | 1 | $19B |
|
||
| Utilities | 1 | $9B |
|
||
| Consumer Goods | 1 | $3B |
|
||
Price history
+281.0% since first listed10 events — show timeline
- 2026-06-01 Listed $120,000 METROMLS
- 2026-01-26 Listing Removed — METROMLS
- 2025-10-27 Listed $118,000 METROMLS
- 2021-07-06 Sold (Public Records) $53,000 Public Records
- 2013-02-01 Listed $88,400 METROMLS
- 2013-02-01 Listing Removed — METROMLS
- 2013-01-31 Listing Removed — METROMLS
- 2013-01-31 Listed $87,900 METROMLS
- 2006-10-04 Sold (Public Records) $70,000 Public Records
- 1980-08-01 Sold (Public Records) $31,500 Public Records
Property tax history
-1.0%/yrLatest (2024): $1,626 · +34.4% YoY. Source: county tax records.
Cash-flow waterfall
monthlySold comps — $/sqft
last 12 mo · ≤1 miLoading sold comps…