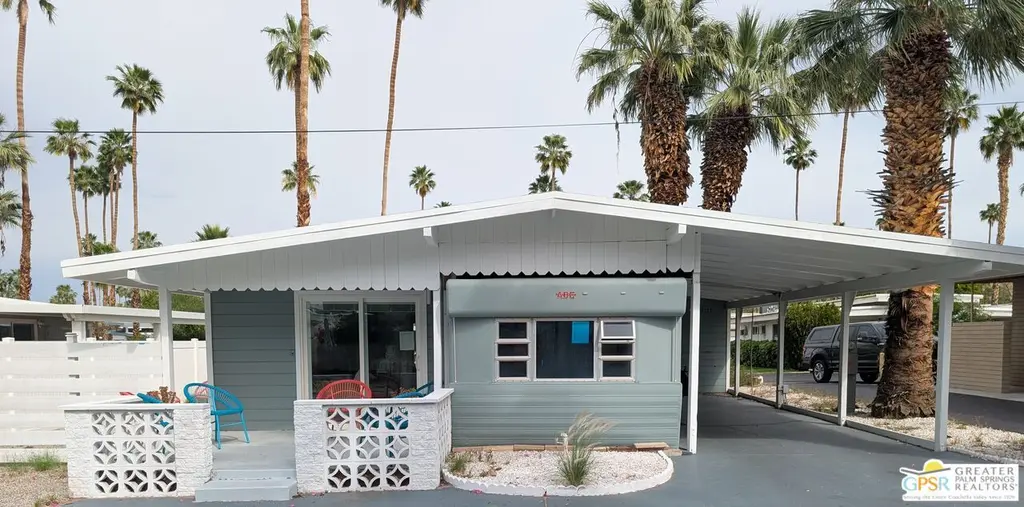
156 Caravan St · Palm Springs, CA
Flood risk 1/10 · Minimal
- FEMA flood zone
- X
- Chance of flooding over 30 yrs
- 0.0%
- Est. flood insurance / yr
- $507 – $1,088
Fire risk 5/10 · Moderate
- Est. fire insurance / yr
- $659 – $1,223
Heat risk 9/10 · Severe
- Hot days now (above 110°F)
- 9 days/yr
- Hot days in 30 yrs
- 26 days/yr
Wind risk 1/10 · Minimal
- Chance of severe wind over 30 yrs
- —
Air-quality risk 5/10 · Moderate
- Unhealthy air days now
- 6 days/yr
- Unhealthy air days in 30 yrs
- 8 days/yr
Risk factors via First Street. Map © Google.
Why this score? — see what drove the C grade
The composite is a weighted blend of 9 inputs, each scored 0–100. Each bar is that input's sub-score; the figure is the points it added to the 100-point composite (weight × sub-score).
- Cash flow +18.6/30.0
- ARV discount +14.0/15.0
- DSCR +5.9/10.0
- 1% rule +5.0/10.0
- Condition / age +4.0/5.0
- Livability +3.3/5.0
- Schools +2.7/10.0
- Rent growth +2.4/5.0
- Appreciation +0.0/10.0
$225,000
🖨 Deal sheet 📄 Offer letter ✓ Due diligence
Listing remarks MLS
Sahara Park, located just minutes from Downtown Palm Springs. A 2 Bedroom, 1 Bath Home with Great Mountain Views. No HOA, Rent Control and the lowest lot rents in South Palm Springs. A 55 plus community and small pet friendly. Clubhouse, library, gym, pottery studio, billards room amd lots of community activities each month. A beautiful heated pool & hot tub and the park and common areas are well maintained. New appliances and the bathroom remodeled with new flooring throughout the home. Potential to expand also.
Key facts
- Clubhouse
- Small pet friendly
- Gym
Tags
Neighborhood map
What this means for you Summary
Snapshot
- This is a 2-bed/1.0-bath manufactured listed at $225k. Condition is rated good.
Deal economics
- At list price, monthly cash flow is $219 ($3k/yr) — positive.
- The deal already cash-flows at list — no discount required.
- To meet the 1% rule (rent ≥ 1% of price), the offer needs to be $225k (0.2% below list).
- Recommended offer: $212k (6.0% below list) — sets the bar for market timing.
- Cap rate 7.5% vs local median 2.7% in Palm Springs — top-decile yield for the area; either an underpriced asset or a hidden risk that comps aren't pricing in. Stress-test before assuming the spread holds.
Location & tenants
- Location reads 66/100 on livability (#348 in CA) — a middle-class / working-renter tenant base. Strengths: amenities A+, commute A+; Watch: schools C-, crime F, cost of living F.
- Palm Springs Unified (suburban): math 21% / reading 42% proficiency, ranked #328 of 517 in CA (top 63%) — families likely to look elsewhere, expect single-tenant / working-renter base with shorter leases; 73% free/reduced lunch — lower-income household profile, screen leases tightly.
- Market conditions: Rents soft (-0.4%/yr); 492 active listings in the ZIP; 26 comparable units currently listed for rent nearby; rentals at typical pace (median 24d on market — plan ~3-4 weeks tenant-placement turnaround); solid renter incomes; 9,195 units permitted in Riverside County in 2024 (1,512 in 5+ unit buildings).
- This rent runs 35% of the median local income ($78k/yr) — at the standard rent-burdened threshold; future hikes will face affordability resistance.
Forward outlook
- Local home prices are declining (-3.0%/yr); year-one equity from $2k of loan paydown is wiped out by about $7k of value loss. Plan a longer hold.
- Riverside County population projected at +22% by 2050 — long-run rental-demand tailwind backs the buy-and-hold thesis.
Negotiation context
- It's been on market 71 days — a 6% lower offer ($212k) is reasonable based on typical stale-listing flexibility.
Risks & watch-outs
- Watch-outs: built in 1957 — expect roof / HVAC / electrical / plumbing capex.
- Climate carrying-cost: moderate wildfire risk; extreme-heat days projected 9→26/yr by 2055 (HVAC capex compounding) — expect insurance premiums to compound above CPI over the hold.
Questions for the listing agent
- It's been on market 71 days. Have you received any prior offers? Is the seller open to a 6% concession, seller financing, or rate buy-down credit?
- Built in 1957 — when were the roof, HVAC, electrical panel, plumbing, and water heater last replaced?
- Why hasn't it sold? Are there any deal-killer items the seller is aware of (foundation, flood, title, zoning, code violations)?
- Is there a deadline driving the sale (1031 exchange, divorce, estate, relocation)? That informs how much negotiation room exists.
- Crime grade is F in this area — have there been break-ins, vandalism, or insurance claims at this property in the last 3 years? What carrier currently insures it and at what premium?
- What's the average days-on-market for RENTAL listings here right now (not sales)? A rising rental-DOM trend means longer vacancies and softer asking-rent achievability than the comps imply.
- What's the recent tenant-quality profile in this submarket — average credit score on applications, eviction rate, late-payment / NSF rate, and stable-employment percentage? A property-management company in the area should have these aggregated.
- How much new for-sale + rental construction is in the pipeline within 1–3 miles? Heavy new supply typically softens prices + rents 12–24 months out; constrained supply supports both.
Investment metrics
- 1% rule
- 1.00% ✗
- Cap rate
- 7.46%
- Cash-on-cash
- 4.17%
- DSCR
- 1.19
- GRM
- 8.4
CMA / ARV
- ARV (median comp)
- $262,966
- List price
- $225,000
- Delta
- -14.44%
- Verdict
- UNDERPRICED
- Comps
- 10 within 1.0 mi
Show comp detail 8 sales within ~0.75 mi
| Address | Dist | Beds/Ba | Sqft | Sold | Price | $/sf | Match |
|---|---|---|---|---|---|---|---|
| 226 Lei Dr | 0.12mi | 2/2.0 | 800 (+5%) | 5mo | $235,000 | $294 | 78 |
| 157 Caravan St | 0.01mi | 2/1.0 | 860 (+13%) | 2mo | $255,000 | $297 | 75 |
| 112 Pali Dr | 0.14mi | 2/2.0 | 800 (+5%) | 8mo | $275,000 | $344 | 74 |
| 31 Sahara St | 0.09mi | 2/1.0 | 700 (-8%) | 13mo | $210,000 | $300 | 72 |
| 804 Hila Ln | 0.07mi | 2/2.0 | 840 (+10%) | 4mo | $288,000 | $343 | 72 |
| 339 Lei Dr | 0.15mi | 2/2.0 | 800 (+5%) | 18mo | $315,000 | $394 | 65 |
| 134 Pali Dr | 0.21mi | 2/2.0 | 840 (+10%) | 8mo | $290,000 | $345 | 62 |
| 351 Lei Dr | 0.19mi | 2/2.0 | 840 (+10%) | 12mo | $280,000 | $333 | 60 |
Match score weights: distance 35% · size 25% · config 20% · recency 20%. Top-matched comps best support the ARV.
Projected returns pro-forma
-3.0% appreciation · 0.0% rent growth · sell at horizon
- IRR
- -13.2%
- Equity multiple
- 0.54×
- Total profit
- $-29,062
- Equity at exit
- $33,548
- IRR
- -9.8%
- Equity multiple
- 0.48×
- Total profit
- $-32,644
- Equity at exit
- $19,454
Cash invested: $63,000 (down + closing). Projections, not guarantees.
Landlord ↔ Tenant lean methodology
- Overall (STATE)
- 18 Strongly Tenant-Friendly
- State California
- 18 Strongly Tenant-Friendly · D+13
- County
- — inherits STATE
- City
- — inherits STATE
ZIP-level market 92264
- Rents YoY
- -0.4%
- Active inventory
- 492
- Price-to-rent
- 8.4×
Monthly cashflow live
- Estimated rent
- $2,245 high interval (Pro) →
- Mortgage (P&I)
- −$1,180
- Tax est. 1.5%
- −$281 /mo · $3,375/yr
- Insurance
- −$94
- HOA
- −$0
- Vacancy / Maint / Mgmt
- −$472
- Net cashflow
- $219
Break-even live
UW: 25.0% down · 7.5% · 30yr · 1.5% tax · 5.0% vac · 8.0% maint · 8.0% mgmt
Financing live
Cash to close
- Down payment
- $56,250
- Closing costs
- $6,750
- Reserves months
- —
- Total cash needed
- —
Loan-product check · same deal, 3 products live
Conventional
25% down · 7.5% · 30yr
- Down + closing
- —
- Monthly P&I
- —
- Monthly cashflow
- —
- DSCR
- —
- Eligible?
- —
Personal DTI + credit; lowest rate.
DSCR
20% down · 8.5% · 30yr
- Down + closing
- —
- Monthly P&I
- —
- Monthly cashflow
- —
- DSCR
- —
- Eligible?
- —
No personal income docs; deal must DSCR.
Hard money
10% down · 12.0% · 12mo
- Down + closing
- —
- Monthly P&I
- —
- Monthly cashflow
- —
- DSCR
- —
- Eligible?
- —
Short-term bridge; refi at stabilization.
Rent comps 26 comps
| Address | Beds | Baths | Sqft | Rent | $/sqft | DOM | Units | Dist |
|---|---|---|---|---|---|---|---|---|
| 120 Pali Dr Palm Springs, CA | 2.0 | 2.0 | 835 | $2,200 | $2.63 | 21d | 1 | 0.14mi |
| 1900 S Palm Canyon Dr #42 Palm Springs, CA | 2.0 | 2.0 | 1024 | $2,500 | $2.44 | 43d | 1 | 0.21mi |
| 1950 S Palm Canyon Dr Palm Springs, CA | 1.0–2.0 | 1.0–2.0 | 902 | $2,500 | $2.77 | 43d | 2 | 0.26mi |
| 1950 S Palm Canyon Dr Palm Springs, CA | 1.0–2.0 | 1.0–2.0 | 902 | $2,645 | $2.93 | 2d | 3 | 0.26mi |
| 1674 Via Salida Unit 3 Palm Springs, CA | 1.0 | 1.0 | 550 | $1,650 | $3.00 | 15d | 1 | 0.36mi |
| 1111 E Palm Canyon Dr Palm Springs, CA | 1.0 | 1.0 | 525 | $2,525 | $4.81 | 24d | 2 | 0.37mi |
| 1428 S Camino Real Palm Springs, CA | 2.0 | 2.0 | 1054 | $2,300 | $2.18 | 43d | 1 | 0.54mi |
| 1425 Via Soledad Unit 1 Palm Springs, CA | 2.0 | 2.0 | 1050 | $2,500 | $2.38 | 43d | 1 | 0.56mi |
| 1425 Via Soledad Unit 1 Palm Springs, CA | 2.0 | 2.0 | 1050 | $2,500 | $2.38 | 24d | 1 | 0.56mi |
| 1400 E Palm Canyon Dr Unit 113 Palm Springs, CA | 1.0 | 1.0 | 800 | $1,995 | $2.49 | 43d | 1 | 0.63mi |
| 1530 E Palm Canyon Dr Unit 209 Palm Springs, CA | 2.0 | 2.0 | 740 | $2,595 | $3.51 | 3d | 1 | 0.68mi |
| 1655 E Palm Canyon Dr Palm Springs, CA | 1.0 | 1.0 | 755 | $2,000 | $2.65 | 7d | 3 | 0.72mi |
| 1655 E Palm Canyon Dr Palm Springs, CA | 1.0 | 1.0 | 755 | $2,122 | $2.81 | 43d | 3 | 0.72mi |
| 1655 E Palm Canyon Dr Palm Springs, CA | 1.0 | 1.0 | 755 | $2,350 | $3.11 | 24d | 2 | 0.72mi |
| 1333 S Belardo Rd Palm Springs, CA | 1.0 | 1.0 | 687 | $1,925 | $2.80 | 2d | 8 | 0.73mi |
| 777 E San Lorenzo Rd Unit 3 Palm Springs, CA | 1.0 | 1.0 | 550 | $1,765 | $3.21 | 18d | 1 | 0.84mi |
| 722 E San Lorenzo Rd Palm Springs, CA | 3.0 | 1.0–2.0 | 750 | $2,015 | $2.69 | 7d | 3 | 0.87mi |
| 671 S Riverside Dr Unit 6 Palm Springs, CA | 2.0 | 2.0 | 900 | $1,985 | $2.21 | 24d | 1 | 0.89mi |
| 788 N Riverside Dr Palm Springs, CA | 1.0 | 1.0 | 725 | $1,648 | $2.27 | 43d | 1 | 0.97mi |
| 594 Calle Abronia S Unit 03 Palm Springs, CA | 2.0 | 2.0 | 662 | $1,895 | $2.86 | 43d | 1 | 1.19mi |
| 585 Calle Abronia S Unit B Palm Springs, CA | 1.0 | 1.0 | 750 | $2,100 | $2.80 | 43d | 1 | 1.19mi |
| 583 Calle Abronia S Unit A Palm Springs, CA | 2.0 | 1.0 | 760 | $2,299 | $3.02 | 43d | 1 | 1.20mi |
| 620 S Thornhill Rd Unit 6 Palm Springs, CA | 1.0 | 1.0 | 656 | $1,765 | $2.69 | 24d | 1 | 1.24mi |
| 620 S Thornhill Rd Unit 3 Palm Springs, CA | 2.0 | 1.0 | 700 | $1,985 | $2.84 | 24d | 1 | 1.24mi |
| 1111 E Ramon Rd Palm Springs, CA | 2.0–3.0 | 2.0 | 1191 | $2,000 | $1.68 | 24d | 2 | 1.34mi |
| 1111 E Ramon Rd Palm Springs, CA | 2.0–3.0 | 2.0 | 1191 | $2,800 | $2.35 | 16d | 2 | 1.34mi |
Listing history 11 events
-
2026-06-13days on market $225,000 Active 71 DOM
-
2026-06-09days on market $225,000 Active 68 DOM
-
2026-06-08days on market $225,000 Active 67 DOM
-
2026-06-07days on market $225,000 Active 66 DOM
-
2026-06-04days on market $225,000 Active 63 DOM
-
2026-06-03days on market $225,000 Active 62 DOM
-
2026-06-02days on market $225,000 Active 61 DOM
-
2026-06-01days on market $225,000 Active 60 DOM
-
2026-05-31days on market $225,000 Active 59 DOM
-
2026-04-14price $225,000 525-char remark
Show marketing remark (525 chars)
Sahara Park, located just minutes from Downtown Palm Springs. A 2 Bedroom, 1 Bath Home with Great Mountain Views. No HOA, Rent Control and the lowest lot rents in South Palm Springs. A 55 plus community and small pet friendly. Clubhouse, library, gym, pottery studio, billards room amd lots of community activities each month. A beautiful heated pool & hot tub and the park and common areas are well maintained. New appliances and the bathroom remodeled with new flooring throughout the home. Potential to expand also.
-
2026-03-13$245,000 Active 525-char remark
Show marketing remark (525 chars)
Sahara Park, located just minutes from Downtown Palm Springs. A 2 Bedroom, 1 Bath Home with Great Mountain Views. No HOA, Rent Control and the lowest lot rents in South Palm Springs. A 55 plus community and small pet friendly. Clubhouse, library, gym, pottery studio, billards room amd lots of community activities each month. A beautiful heated pool & hot tub and the park and common areas are well maintained. New appliances and the bathroom remodeled with new flooring throughout the home. Potential to expand also.
ⓘ Source: listings_history table (triggers on properties + properties_extension) + one-shot
backfill from property_details.listing_events for pre-trigger history.
Climate risk First Street
- Flood 1/10 Low FEMA zone X · 0% chance over 30 yrs
- Wildfire 5/10 Major
- Heat 9/10 Extreme 9 d/yr ≥110°F today · 26 d/yr by 30 yrs out
- Wind 1/10 Low
- Air quality 5/10 Major 6 unhealthy d/yr today · 8 by 30 yrs out
Nearby sold comps map
Loading sold comps map…
Walkable amenities ~0.75 mi
Loading nearby amenities…
Taxation est. · year 1
- Rental income
- $26,945
- − Mortgage interest
- −$12,603
- − Property taxes
- −$3,375
- − Insurance
- −$1,125
- − Repairs & maintenance
- −$2,156
- − Management
- −$2,156
- − Depreciation
- −$6,545
- Taxable loss
- −$1,015
- Est. tax savings @ 24.0%
- +$244
- After-tax cash flow
- $2,871/yr
For passive investors: Depreciation is non-cash, so a rental often shows a tax loss while cash-flowing — sheltering income. Rental losses are passive: they offset passive income freely, and up to $25,000/yr can offset ordinary (W-2) income if you actively participate and your MAGI is under $100k (phasing out to $0 by $150k); unused losses carry forward. On sale, claimed depreciation is recaptured at up to 25%, and gains may owe capital-gains tax (a 1031 exchange can defer both). Figures are a year-1 estimate at your 24.0% rate — not tax advice; consult a CPA.
Condition & rehab AI · 9 photos
This 2-bedroom, 1-bath home in Palm Springs is in good condition with recent updates and a well-maintained exterior. It offers great mountain views and is located in a pet-friendly community with amenities and low lot rents.
Value-add opportunities
- Both Paint exterior — Enhances curb appeal and value
- Both Replace sliding glass doors — Improves energy efficiency and aesthetics
Renovation cost estimate screening
Value-add ROI direction
- Both Paint exterior — Enhances curb appeal and value ↑
- Both Replace sliding glass doors — Improves energy efficiency and aesthetics ↑
ⓘ Cost ranges are severity-bucket heuristics (US national rule-of-thumb). Get contractor quotes + a written scope before underwriting a rehab budget.
Schools (NCES district)
- District
- Palm Springs Unified
- NCES district ID
- 0629550
- Math proficiency
- 21% ▼ -7.00%
- Reading proficiency
- 42% ▬ 0.00%
- Median HH income
- $43,638
- Composite
- 26.76/100
- National rank
- #7131
- State rank
- #328 of 517 in CA
Livability — Palm Springs
- Score
- 66/100
- State rank
- #348
- US rank
- #11850
Category grades
Schools grade is shown separately in the Schools card above.
Census & demographics
- Census place
- Palm Springs, CA
- County
- Riverside County · 2,287,001 people
- City population
- 46,786
- Metro
- Riverside-San Bernardino-Ontario, CA
- Population (ZIP)
- 19,899
- Household income
- $77,688
- Rent vs Own
- Severe rent burden
- 1215.0
Population outlook (Riverside County) Hauer SSP2
- Today (2025)
- 2,664,475 people
- By 2030
- 2,802,692 · +5.2%
- By 2040
- 3,050,904 · +14.5%
- By 2050
- 3,256,783 · +22.2%
- By 2075
- 3,655,058 · +37.2%
- By 2100
- 3,766,594 · +41.4%
Race, ethnicity, and origin ACS 2023
- Neighborhood character
- Predominantly White (68%)
- Race & ethnicity
- White 68% Hispanic / Latino 20% Two or more races 12% Asian 6% Black 2% Native American 1%
- Hispanic origin (detail)
- Mexican 16%
- Common ancestry
- Lithuanian 4% Romanian 3% Slovak 3%
- Foreign-born
- 16% · Canada, China, South Korea
- Languages at home
- 81% English-only · Spanish 13% Tagalog/Filipino 2% Other Asian/Pacific 1%
Political lean MEDSL · Riverside
- 2024 margin
- Toss-up / Even · D 48.0% · R 49.3% · Other 2.6%
- 2008→2024 swing
- -3.6pp toward R · 2008: 2.3pp · 2024: -1.3pp
- All cycles
- 2024: R+1.3 2020: D+8.0 2016: D+4.3 2012: R+0.4 2008: D+2.3
Not yet ingested
- Civics
- —
Market trends
- HPI YoY
- ▼ -489.04%
- Current HPI
- 357.0969
- Rent YoY
- ▼ -0.43%
- Metro
- Riverside-San Bernardino-Ontario, CA
- State GDP YoY
- ▲ 3.21%
- F500 in state
- 116
Industry mix (Fortune 500 HQ in CA)
| Industry | F500 HQs | Revenue |
|---|---|---|
| Technology | 27 | $1,492B |
|
||
| Financial Services | 3 | $174B |
|
||
| Retail | 3 | $44B |
|
||
| Insurance | 3 | $26B |
|
||
| Media / Entertainment | 2 | $115B |
|
||
| Pharmaceuticals / Biotech | 2 | $62B |
|
||
Price history
-8.2% since first listed2 events — show timeline
- 2026-04-14 Price Changed $225,000 TheMLS
- 2026-03-13 Listed $245,000 TheMLS
Cash-flow waterfall
monthlySold comps — $/sqft
last 12 mo · ≤1 miLoading sold comps…