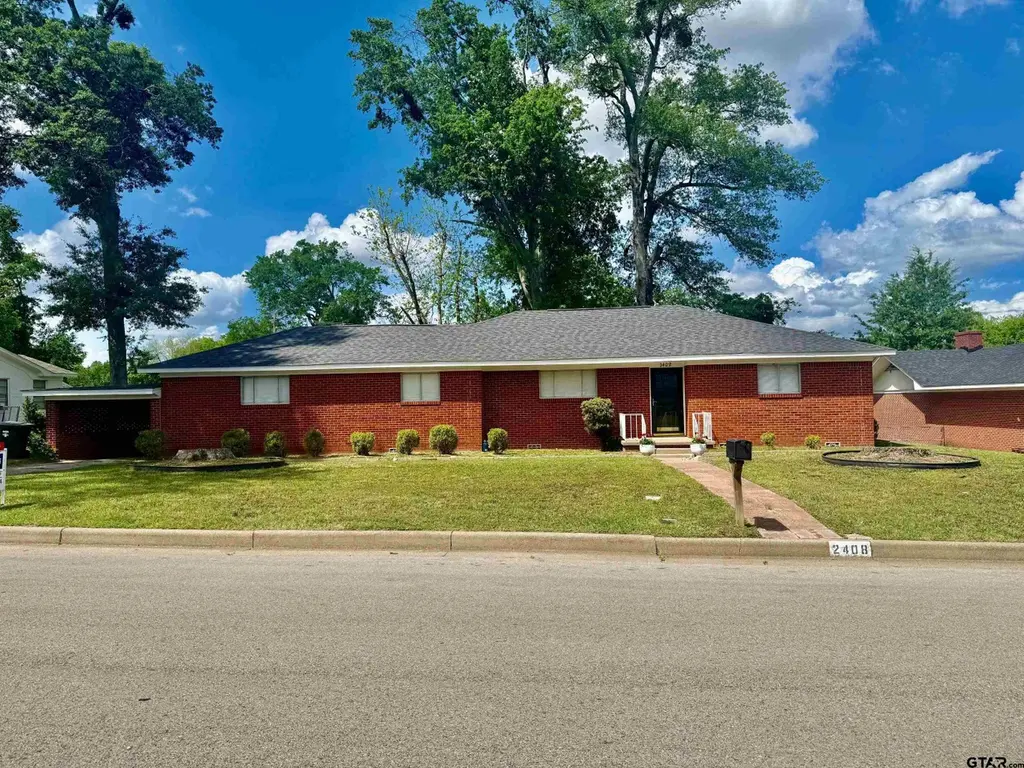
2408 Hunter St · Tyler, TX
Flood risk 1/10 · Minimal
- FEMA flood zone
- X (unshaded)
- Chance of flooding over 30 yrs
- 0.0%
- Est. flood insurance / yr
- $507 – $1,088
Fire risk 2/10 · Minimal
- Est. fire insurance / yr
- $1,222 – $2,270
Heat risk 6/10 · Moderate
- Hot days now (above 109°F)
- 7 days/yr
- Hot days in 30 yrs
- 25 days/yr
Wind risk 6/10 · Moderate
- Chance of severe wind over 30 yrs
- 61.0%
Air-quality risk 2/10 · Minimal
- Unhealthy air days now
- 0 days/yr
- Unhealthy air days in 30 yrs
- 1 days/yr
Risk factors via First Street. Map © Google.
Why this score? — see what drove the C- grade
The composite is a weighted blend of 9 inputs, each scored 0–100. Each bar is that input's sub-score; the figure is the points it added to the 100-point composite (weight × sub-score).
- ARV discount +15.0/15.0
- Cash flow +14.7/30.0
- DSCR +4.5/10.0
- 1% rule +4.2/10.0
- Livability +3.8/5.0
- Rent growth +3.4/5.0
- Schools +3.3/10.0
- Condition / age +2.5/5.0
- Appreciation +0.0/10.0
$194,500
🖨 Deal sheet 📄 Offer letter ✓ Due diligence
Listing remarks MLS
LOCATION LOCATION LOCATION!!!! This charming house features hard wood flooring, 3 bedrooms, 2 baths with one of the bedrooms being VERY large! The home is located close to schools, shopping and medical facilities. Situated on a large lot with a work shop in a well maintained neighborhood that is very sought after. Recent upgrades include New Roof on the home and in August 2025, updates to the HVAC system August 2025, New flooring in 2 rooms along with dishwasher installed and some new paint. The 15X20 shop in the huge back yard has recently had inside lighting upgrades to 5 LED light bars, outside light upgraded with LED motion detector, all electrical wiring inside & out, workbench (with drawers) along with breaker box updated & up to code. Hurry to see this one before it's GONE!
Key facts
- Recent upgrades
- Hard wood flooring
- New flooring
Tags
Neighborhood map
What this means for you Summary
Snapshot
- This is a 3-bed/2.0-bath single-family listed at $194k.
Deal economics
- At list price, monthly cash flow is $48 ($579/yr) — positive.
- The deal already cash-flows at list — no discount required.
- To meet the 1% rule (rent ≥ 1% of price), the offer needs to be $179k (7.8% below list).
- Recommended offer: $179k (7.8% below list) — sets the bar for 1% rule.
- Cap rate 6.6% vs local median 3.6% in Tyler — top-decile yield for the area; either an underpriced asset or a hidden risk that comps aren't pricing in. Stress-test before assuming the spread holds.
Location & tenants
- Location reads 75/100 on livability (#147 in TX, #4,181 nationally) — a middle-class / working-renter tenant base. Strengths: cost of living A+, housing A+, health & safety A+; Watch: employment C-, schools D+, crime D+.
- Tyler ISD (urban): math 39% / reading 38% proficiency, ranked #449 of 826 in TX (top 54%) — families likely to look elsewhere, expect single-tenant / working-renter base with shorter leases; 66% free/reduced lunch — lower-income household profile, screen leases tightly.
- Market conditions: Rents rising (+3.7%/yr); 327 active listings in the ZIP; 19 comparable units currently listed for rent nearby; rentals at typical pace (median 21d on market — plan ~3-4 weeks tenant-placement turnaround); 47% of comp listings sitting > 30 days — soft ceiling on asking rent; 595 units permitted in Smith County in 2024 (45 in 5+ unit buildings).
- This rent runs 32% of the median local income ($66k/yr) — at the standard rent-burdened threshold; future hikes will face affordability resistance.
Forward outlook
- Local home prices are declining (-3.0%/yr); year-one equity from $1k of loan paydown is wiped out by about $6k of value loss. Plan a longer hold.
- Smith County population projected at +24% by 2050 — long-run rental-demand tailwind backs the buy-and-hold thesis.
Negotiation context
- It's been on market 20 days — a 2% lower offer ($192k) is reasonable based on typical stale-listing flexibility.
- 3 sale attempts with the ask held roughly flat each time — persistent listings suggest the price (not the market) is what's stuck; bring a comps-based counter.
Risks & watch-outs
- Watch-outs: built in 1955 — expect roof / HVAC / electrical / plumbing capex.
- Climate carrying-cost: major wind risk, 61% chance of damaging wind over 30y; extreme-heat days projected 7→25/yr by 2055 (HVAC capex compounding) — expect insurance premiums to compound above CPI over the hold.
Questions for the listing agent
- Built in 1955 — when were the roof, HVAC, electrical panel, plumbing, and water heater last replaced?
- Is there a deadline driving the sale (1031 exchange, divorce, estate, relocation)? That informs how much negotiation room exists.
- Schools are D-rated, which usually means shorter tenancies and higher turnover. Who's the typical renter profile here, and what's been the actual vacancy rate?
- Crime grade is D in this area — have there been break-ins, vandalism, or insurance claims at this property in the last 3 years? What carrier currently insures it and at what premium?
- What's the average days-on-market for RENTAL listings here right now (not sales)? A rising rental-DOM trend means longer vacancies and softer asking-rent achievability than the comps imply.
- What's the recent tenant-quality profile in this submarket — average credit score on applications, eviction rate, late-payment / NSF rate, and stable-employment percentage? A property-management company in the area should have these aggregated.
- How much new for-sale + rental construction is in the pipeline within 1–3 miles? Heavy new supply typically softens prices + rents 12–24 months out; constrained supply supports both.
Investment metrics
- 1% rule
- 0.92% ✗
- Cap rate
- 6.59%
- Cash-on-cash
- 1.06%
- DSCR
- 1.05
- GRM
- 9.0
CMA / ARV
- ARV (median comp)
- $238,291
- List price
- $194,500
- Delta
- -18.38%
- Verdict
- UNDERPRICED
- Comps
- 20 within 1.0 mi
Show comp detail 9 sales within ~0.75 mi
| Address | Dist | Beds/Ba | Sqft | Sold | Price | $/sf | Match |
|---|---|---|---|---|---|---|---|
| 2407 Sarasota Dr | 0.23mi | 3/2.5 | 1,912 (+2%) | 0mo | $199,900 | $105 | 84 |
| 3014 Brentwood Dr | 0.68mi | 3/2.0 | 1,872 (-0%) | 1mo | $234,990 | $126 | 66 |
| 2419 Sampson Dr | 0.10mi | 3/2.0 | 1,680 (-11%) | 20mo | $240,000 | $143 | 60 |
| 912 Moorehill | 0.59mi | 3/2.5 | 1,871 (-0%) | 13mo | $249,500 | $133 | 59 |
| 1715 Ridgeview | 0.39mi | 2/1.5 (-1) | 1,637 (-13%) | 7mo | $245,000 | $150 | 48 |
| 1515 San Antonio | 0.74mi | 3/2.0 | 1,682 (-11%) | 7mo | $198,500 | $118 | 42 |
| 2619 Golden Rd | 0.66mi | 3/2.0 | 1,684 (-10%) | 14mo | $280,900 | $167 | 40 |
| 2911 Meadow Brook Trl | 0.49mi | 4/2.0 (+1) | 1,610 (-14%) | 11mo | $299,000 | $186 | 39 |
| 3000 Brentwood | 0.64mi | 3/2.0 | 2,127 (+13%) | 18mo | $215,000 | $101 | 33 |
Match score weights: distance 35% · size 25% · config 20% · recency 20%. Top-matched comps best support the ARV.
Projected returns pro-forma
-3.0% appreciation · 3.66% rent growth · sell at horizon
- IRR
- -13.8%
- Equity multiple
- 0.50×
- Total profit
- $-27,206
- Equity at exit
- $29,001
- IRR
- -3.9%
- Equity multiple
- 0.73×
- Total profit
- $-14,582
- Equity at exit
- $16,817
Cash invested: $54,460 (down + closing). Projections, not guarantees.
Landlord ↔ Tenant lean methodology
- Overall (STATE)
- 87 Strongly Landlord-Friendly
- State Texas
- 87 Strongly Landlord-Friendly · R+5
- County
- — inherits STATE
- City
- — inherits STATE
ZIP-level market 75701
- Rents YoY
- 3.7%
- Active inventory
- 327
- Price-to-rent
- 9.0×
Monthly cashflow live
- Estimated rent
- $1,793 high interval (Pro) →
- Mortgage (P&I)
- −$1,020
- Tax from tax record
- −$267 /mo · $3,204/yr
- Insurance
- −$81
- HOA
- −$0
- Vacancy / Maint / Mgmt
- −$376
- Net cashflow
- $48
Break-even live
UW: 25.0% down · 7.5% · 30yr · 1.5% tax · 5.0% vac · 8.0% maint · 8.0% mgmt
Financing live
Cash to close
- Down payment
- $48,625
- Closing costs
- $5,835
- Reserves months
- —
- Total cash needed
- —
Loan-product check · same deal, 3 products live
Conventional
25% down · 7.5% · 30yr
- Down + closing
- —
- Monthly P&I
- —
- Monthly cashflow
- —
- DSCR
- —
- Eligible?
- —
Personal DTI + credit; lowest rate.
DSCR
20% down · 8.5% · 30yr
- Down + closing
- —
- Monthly P&I
- —
- Monthly cashflow
- —
- DSCR
- —
- Eligible?
- —
No personal income docs; deal must DSCR.
Hard money
10% down · 12.0% · 12mo
- Down + closing
- —
- Monthly P&I
- —
- Monthly cashflow
- —
- DSCR
- —
- Eligible?
- —
Short-term bridge; refi at stabilization.
Rent comps 19 comps
| Address | Beds | Baths | Sqft | Rent | $/sqft | DOM | Units | Dist |
|---|---|---|---|---|---|---|---|---|
| 2401 Airline Dr Tyler, TX | 3.0 | 2.5 | 1512 | $1,325 | $0.88 | 44d | 1 | 0.23mi |
| 2020 S Tipton Ave Tyler, TX | 3.0 | 2.0 | 1914 | $2,100 | $1.10 | 13d | 1 | 0.32mi |
| 2725 Tanglewood Dr Tyler, TX | 3.0 | 2.0 | 1956 | $1,675 | $0.86 | 13d | 1 | 0.35mi |
| 1712 Redbud Ave Tyler, TX | 3.0 | 1.5 | 1305 | $1,475 | $1.13 | 21d | 1 | 0.73mi |
| 1712 Redbud Ave Tyler, TX | 3.0 | 1.5 | 1561 | $1,475 | $0.94 | 13d | 1 | 0.73mi |
| 3207 Timberlane Dr Tyler, TX | 3.0 | 2.0 | 1783 | $1,750 | $0.98 | 44d | 1 | 0.88mi |
| 1225 San Antonio St Tyler, TX | 3.0 | 2.0 | 1754 | $1,695 | $0.97 | 13d | 1 | 0.95mi |
| 811 S Mahon Ave Tyler, TX | 3.0 | 2.0 | 1761 | $1,900 | $1.08 | 44d | 1 | 1.00mi |
| 3032 Santa Elena Dr Tyler, TX | 3.0 | 2.0 | 1473 | $2,485 | $1.69 | 44d | 1 | 1.07mi |
| 3038 Santa Elena Dr Tyler, TX | 3.0 | 2.0 | 1305 | $2,485 | $1.90 | 13d | 1 | 1.09mi |
| 3127 Andy Ln Tyler, TX | 4.0 | 2.0 | 1733 | $2,100 | $1.21 | 44d | 1 | 1.16mi |
| 1118 S Fleishel Ave Tyler, TX | 3.0 | 2.0 | 1425 | $1,495 | $1.05 | 13d | 1 | 1.16mi |
| 3629 McDonald Rd Tyler, TX | 2.0 | 2.0 | 1287 | $1,325 | $1.03 | 21d | 1 | 1.25mi |
| 9149 County Road 273 Tyler, TX | 2.0 | 2.0 | 1597 | $1,595 | $1.00 | 21d | 1 | 1.25mi |
| 211 Patricia Ct Tyler, TX | 3.0 | 2.0 | 1314 | $1,795 | $1.37 | 44d | 1 | 1.39mi |
| 2804 Old Omen Rd Unit 2804 Tyler, TX | 3.0 | 2.5 | 2406 | $2,850 | $1.18 | 44d | 1 | 1.39mi |
| 2521 Westminster Dr Tyler, TX | 3.0 | 2.5 | 2400 | $1,500 | $0.62 | 44d | 1 | 1.41mi |
| 2531 Westminster Dr Tyler, TX | 3.0 | 2.0 | 1410 | $1,425 | $1.01 | 21d | 1 | 1.43mi |
| 3200 Decharles St Tyler, TX | 3.0 | 2.0 | 2584 | $2,750 | $1.06 | 44d | 1 | 1.45mi |
Listing history 6 events
-
2026-05-05status Pending 803-char remark
Show marketing remark (803 chars)
LOCATION LOCATION LOCATION!!!! This charming house features hard wood flooring, 3 bedrooms, 2 baths with one of the bedrooms being VERY large! The home is located close to schools, shopping and medical facilities. Situated on a large lot with a work shop in a well maintained neighborhood that is very sought after. Recent upgrades include New Roof on the home and in August 2025, updates to the HVAC system August 2025, New flooring in 2 rooms along with dishwasher installed and some new paint. The 15X20 shop in the huge back yard has recently had inside lighting upgrades to 5 LED light bars, outside light upgraded with LED motion detector, all electrical wiring inside & out, workbench (with drawers) along with breaker box updated & up to code. Hurry to see this one before it's GONE!
-
2026-04-22status Active 803-char remark
Show marketing remark (803 chars)
LOCATION LOCATION LOCATION!!!! This charming house features hard wood flooring, 3 bedrooms, 2 baths with one of the bedrooms being VERY large! The home is located close to schools, shopping and medical facilities. Situated on a large lot with a work shop in a well maintained neighborhood that is very sought after. Recent upgrades include New Roof on the home and in August 2025, updates to the HVAC system August 2025, New flooring in 2 rooms along with dishwasher installed and some new paint. The 15X20 shop in the huge back yard has recently had inside lighting upgrades to 5 LED light bars, outside light upgraded with LED motion detector, all electrical wiring inside & out, workbench (with drawers) along with breaker box updated & up to code. Hurry to see this one before it's GONE!
-
2026-04-18status Pending 803-char remark
Show marketing remark (803 chars)
LOCATION LOCATION LOCATION!!!! This charming house features hard wood flooring, 3 bedrooms, 2 baths with one of the bedrooms being VERY large! The home is located close to schools, shopping and medical facilities. Situated on a large lot with a work shop in a well maintained neighborhood that is very sought after. Recent upgrades include New Roof on the home and in August 2025, updates to the HVAC system August 2025, New flooring in 2 rooms along with dishwasher installed and some new paint. The 15X20 shop in the huge back yard has recently had inside lighting upgrades to 5 LED light bars, outside light upgraded with LED motion detector, all electrical wiring inside & out, workbench (with drawers) along with breaker box updated & up to code. Hurry to see this one before it's GONE!
-
2026-04-12$194,500 Active 803-char remark
Show marketing remark (803 chars)
LOCATION LOCATION LOCATION!!!! This charming house features hard wood flooring, 3 bedrooms, 2 baths with one of the bedrooms being VERY large! The home is located close to schools, shopping and medical facilities. Situated on a large lot with a work shop in a well maintained neighborhood that is very sought after. Recent upgrades include New Roof on the home and in August 2025, updates to the HVAC system August 2025, New flooring in 2 rooms along with dishwasher installed and some new paint. The 15X20 shop in the huge back yard has recently had inside lighting upgrades to 5 LED light bars, outside light upgraded with LED motion detector, all electrical wiring inside & out, workbench (with drawers) along with breaker box updated & up to code. Hurry to see this one before it's GONE!
-
2025-09-05$199,000 Active
-
1996-02-16soldstatus
ⓘ Source: listings_history table (triggers on properties + properties_extension) + one-shot
backfill from property_details.listing_events for pre-trigger history.
Tax reassessment forecast TX · Resets to sale price
- Current annual tax
- $3,204 · $267/mo
- Projected year-2 tax
- $3,559 · $297/mo
- Expected delta
- +$356/yr (+$30/mo · 11.1%)
ⓘ Screening estimate from a state-policy table — verify with the county assessor before closing.
Climate risk First Street
- Flood 1/10 Low FEMA zone X (unshaded) · 0% chance over 30 yrs
- Wildfire 2/10 Low
- Heat 6/10 Major 7 d/yr ≥109°F today · 25 d/yr by 30 yrs out
- Wind 6/10 Major 61% chance of damaging wind over 30 yrs
- Air quality 2/10 Low 0 unhealthy d/yr today · 1 by 30 yrs out
Nearby sold comps map
Loading sold comps map…
Walkable amenities ~0.75 mi
Loading nearby amenities…
Taxation est. · year 1
- Rental income
- $21,512
- − Mortgage interest
- −$10,895
- − Property taxes
- −$3,204
- − Insurance
- −$972
- − Repairs & maintenance
- −$1,721
- − Management
- −$1,721
- − Depreciation
- −$5,658
- Taxable loss
- −$2,659
- Est. tax savings @ 24.0%
- +$638
- After-tax cash flow
- $1,217/yr
For passive investors: Depreciation is non-cash, so a rental often shows a tax loss while cash-flowing — sheltering income. Rental losses are passive: they offset passive income freely, and up to $25,000/yr can offset ordinary (W-2) income if you actively participate and your MAGI is under $100k (phasing out to $0 by $150k); unused losses carry forward. On sale, claimed depreciation is recaptured at up to 25%, and gains may owe capital-gains tax (a 1031 exchange can defer both). Figures are a year-1 estimate at your 24.0% rate — not tax advice; consult a CPA.
Schools (NCES district)
- District
- Tyler ISD
- NCES district ID
- 4843470
- Math proficiency
- 39% ▼ -4.00%
- Reading proficiency
- 38% ▼ -1.00%
- Median HH income
- $44,090
- Composite
- 32.69/100
- National rank
- #5650
- State rank
- #449 of 826 in TX
Livability — Tyler
- Score
- 75/100
- State rank
- #147
- US rank
- #4181
Category grades
Schools grade is shown separately in the Schools card above.
Census & demographics
- Census place
- Tyler, TX
- County
- Smith County · 180,570 people
- City population
- 127,842
- Metro
- Tyler, TX
- Population (ZIP)
- 36,344
- Household income
- $66,401
- Rent vs Own
- Severe rent burden
- 1116.0
Population outlook (Smith County) Hauer SSP2
- Today (2025)
- 248,890 people
- By 2030
- 261,665 · +5.1%
- By 2040
- 286,114 · +15.0%
- By 2050
- 308,006 · +23.8%
- By 2075
- 354,171 · +42.3%
- By 2100
- 372,828 · +49.8%
Race, ethnicity, and origin ACS 2023
- Neighborhood character
- Diverse neighborhood (Simpson 0.64)
- Race & ethnicity
- White 53% Black 21% Hispanic / Latino 19% Two or more races 8% Asian 2%
- Hispanic origin (detail)
- Mexican 17%
- Common ancestry
- Slovak 2% Italian 1% Lithuanian 1%
- Foreign-born
- 8% · Canada
- Languages at home
- 84% English-only · Spanish 14% Other Indo-European 1%
Political lean MEDSL · Smith
- 2024 margin
- Solid R (+45.1) · D 27.0% · R 72.1%
- 2008→2024 swing
- -5.6pp toward R · 2008: -39.5pp · 2024: -45.1pp
- All cycles
- 2024: R+45.1 2020: R+39.4 2016: R+43.9 2012: R+46.9 2008: R+39.5
Not yet ingested
- Civics
- —
Market trends
- HPI YoY
- ▼ -299.78%
- Current HPI
- 207.238
- Rent YoY
- ▲ 3.66%
- Metro
- Tyler, TX
- State GDP YoY
- ▲ 3.95%
- F500 in state
- 110
Industry mix (Fortune 500 HQ in TX)
| Industry | F500 HQs | Revenue |
|---|---|---|
| Energy | 16 | $1,198B |
|
||
| Technology | 5 | $198B |
|
||
| Engineering / Construction | 4 | $72B |
|
||
| Energy Services | 3 | $60B |
|
||
| Utilities | 3 | $41B |
|
||
| Healthcare | 2 | $330B |
|
||
Price history
-2.3% since first listed6 events — show timeline
- 2026-05-05 Pending — GTAR
- 2026-04-22 Relisted — GTAR
- 2026-04-18 Pending — GTAR
- 2026-04-12 Listed $194,500 GTAR
- 2025-09-05 Listed $199,000 GTAR
- 1996-02-16 Sold (Public Records) — Public Records
Property tax history
+3.5%/yrLatest (2024): $3,204 · +7.4% YoY. Source: county tax records.
Cash-flow waterfall
monthlySold comps — $/sqft
last 12 mo · ≤1 miLoading sold comps…