100 S Marshall St · Burlington, IA
Flood risk 1/10 · Minimal
- FEMA flood zone
- X (unshaded)
- Chance of flooding over 30 yrs
- 0.0%
- Est. flood insurance / yr
- $473 – $860
Fire risk 1/10 · Minimal
- Est. fire insurance / yr
- $902 – $1,676
Heat risk 3/10 · Minor
- Hot days now (above 106°F)
- 7 days/yr
- Hot days in 30 yrs
- 16 days/yr
Wind risk 2/10 · Minimal
- Chance of severe wind over 30 yrs
- —
Air-quality risk 2/10 · Minimal
- Unhealthy air days now
- 0 days/yr
- Unhealthy air days in 30 yrs
- 1 days/yr
Risk factors via First Street. Map © Google.
Why this score? — see what drove the D grade
The composite is a weighted blend of 9 inputs, each scored 0–100. Each bar is that input's sub-score; the figure is the points it added to the 100-point composite (weight × sub-score).
- Cash flow +15.0/30.0
- ARV discount +7.5/15.0
- 1% rule +5.0/10.0
- DSCR +5.0/10.0
- Schools +4.0/10.0
- Livability +3.7/5.0
- Rent growth +2.5/5.0
- Condition / age +1.0/5.0
- Appreciation +0.0/10.0
$19,900
🖨 Deal sheet 📄 Offer letter ✓ Due diligence
Listing remarks MLS
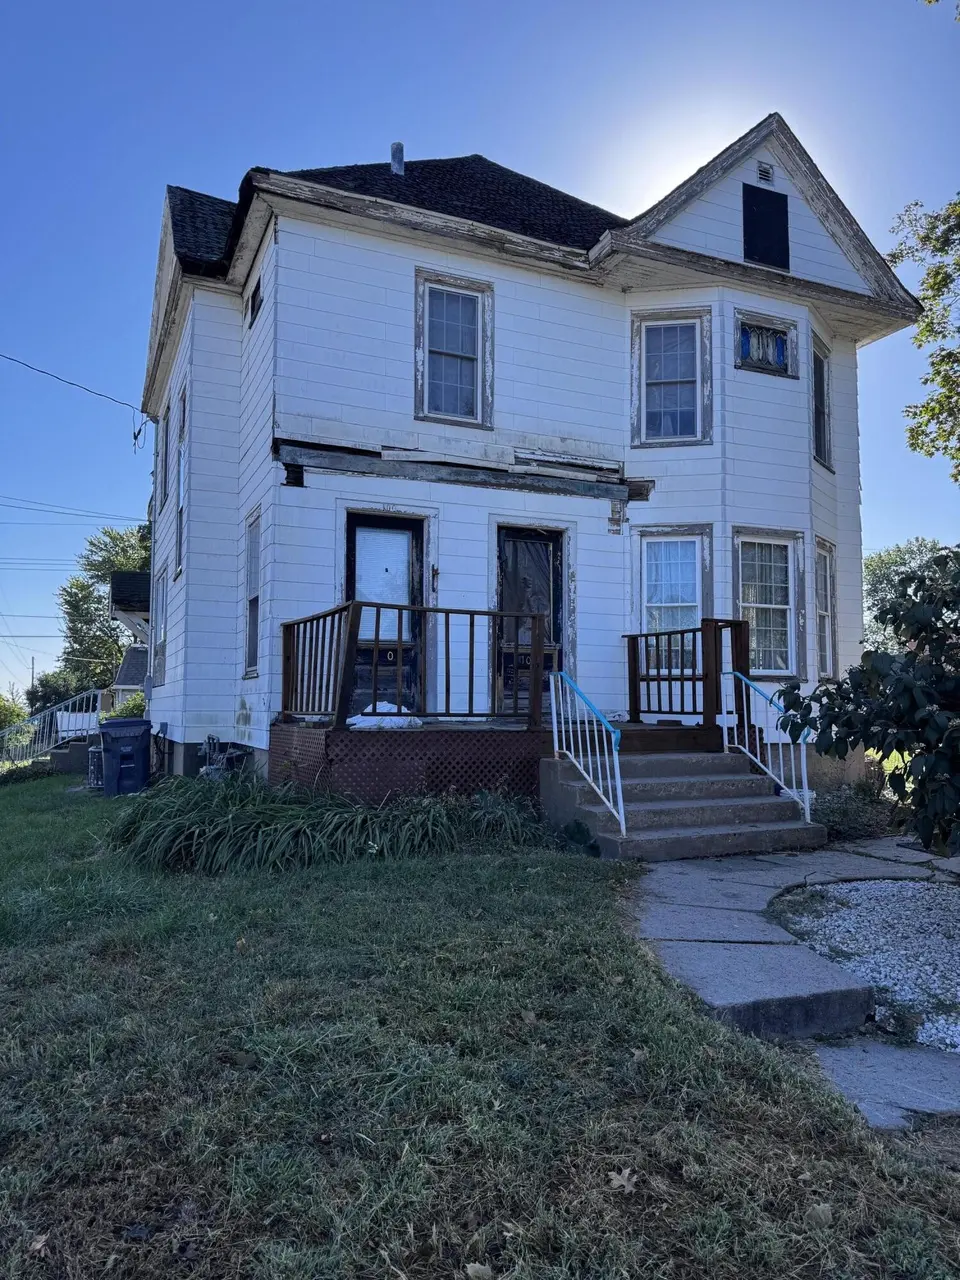
Huge home with lots of potential. Could be duplexed although one unit currently. Very little would have to be done to revert it back to a duplex. Needs some TLC but lots of character in this home. house is 100 Marshall by address but is actually 102-104
Key facts
- 8,276 sq ft lot
- Garage
- Built 1908
Neighborhood map
What this means for you Summary
Snapshot
- This is a 3-bed/1.0-bath single-family listed at $20k. Condition is rated poor.
Deal economics
- At list price, monthly cash flow is $859 ($10k/yr) — positive.
- The deal already cash-flows at list — no discount required.
- Meets the 1% rule at list price ($1k rent vs $20k).
- Recommended offer: $18k (12.0% below list) — sets the bar for market timing.
- Cap rate 58.1% vs local median 6.0% in Burlington — top-decile yield for the area; either an underpriced asset or a hidden risk that comps aren't pricing in. Stress-test before assuming the spread holds.
Location & tenants
- Location reads 73/100 on livability (#287 in IA) — a middle-class / working-renter tenant base. Strengths: cost of living A+, housing A+, health & safety A+; Watch: crime D+, employment D, amenities F.
- Burlington Community School District (town): math 42% / reading 54% proficiency, ranked #286 of 289 in IA (top 99%) — families likely to look elsewhere, expect single-tenant / working-renter base with shorter leases.
- Market conditions: 184 active listings in the ZIP; 53 units permitted in Des Moines County in 2024 (40 in 5+ unit buildings).
Forward outlook
- Local home prices are declining (-3.0%/yr); year-one equity from $138 of loan paydown is wiped out by about $597 of value loss. Plan a longer hold.
- Des Moines County population projected to shrink 6% by 2050 — rents likely to lag national; underwrite the cash flow, not the appreciation.
- At projected returns (-3.0% appreciation + 3.0% rent growth), your $6k cash investment doubles in ~1 year — after that, you're playing with house money.
Negotiation context
- It's been on market 246 days — a 12% lower offer ($18k) is reasonable based on typical stale-listing flexibility.
Risks & watch-outs
- Watch-outs: built in 1908 — expect roof / HVAC / electrical / plumbing capex.
Questions for the listing agent
- It's been on market 246 days. Have you received any prior offers? Is the seller open to a 12% concession, seller financing, or rate buy-down credit?
- Have any recent inspections been done? Can we get a copy of the seller's disclosures and any deferred-maintenance estimates?
- Built in 1908 — when were the roof, HVAC, electrical panel, plumbing, and water heater last replaced?
- Why hasn't it sold? Are there any deal-killer items the seller is aware of (foundation, flood, title, zoning, code violations)?
- Is there a deadline driving the sale (1031 exchange, divorce, estate, relocation)? That informs how much negotiation room exists.
- Crime grade is D in this area — have there been break-ins, vandalism, or insurance claims at this property in the last 3 years? What carrier currently insures it and at what premium?
- The area grade is low — what's the realistic commute time and amenity access for the typical tenant pool here? Any planned neighborhood developments (good or bad) we should know about?
- What's the average days-on-market for RENTAL listings here right now (not sales)? A rising rental-DOM trend means longer vacancies and softer asking-rent achievability than the comps imply.
- What's the recent tenant-quality profile in this submarket — average credit score on applications, eviction rate, late-payment / NSF rate, and stable-employment percentage? A property-management company in the area should have these aggregated.
- How much new for-sale + rental construction is in the pipeline within 1–3 miles? Heavy new supply typically softens prices + rents 12–24 months out; constrained supply supports both.
Investment metrics
- 1% rule
- 6.34% ✓
- Cap rate
- 58.11%
- Cash-on-cash
- 185.08%
- DSCR
- 9.23
- GRM
- 1.3
CMA / ARV
- ARV (median comp)
- $76,183
- List price
- $19,900
- Delta
- -73.88%
- Verdict
- UNDERPRICED
- Comps
- 20 within 1.0 mi
Show comp detail 12 sales within ~0.75 mi
| Address | Dist | Beds/Ba | Sqft | Sold | Price | $/sf | Match |
|---|---|---|---|---|---|---|---|
| 105 N Woodlawn Ave | 0.06mi | 4/2.0 (+1) | 2,186 (-7%) | 1mo | $22,500 | $10 | 76 |
| 205 South Marshall St | 0.10mi | 4/2.0 (+1) | 2,406 (+2%) | 9mo | $75,000 | $31 | 75 |
| 509 Summer St | 0.47mi | 4/2.5 (+1) | 2,254 (-4%) | 2mo | $19,500 | $9 | 59 |
| 513 Hagemann Ave | 0.63mi | 3/2.0 | 2,392 (+2%) | 7mo | $100,000 | $42 | 57 |
| 119 S 8th St | 0.35mi | 3/2.5 | 2,082 (-11%) | 5mo | $90,000 | $43 | 55 |
| 407 S Gunnison St | 0.27mi | 4/2.0 (+1) | 1,999 (-15%) | 2mo | $159,200 | $80 | 52 |
| 824 N 8th St | 0.69mi | 3/2.0 | 2,184 (-7%) | 2mo | $144,000 | $66 | 50 |
| 513 Elm St | 0.57mi | 4/1.5 (+1) | 2,084 (-11%) | 5mo | $47,000 | $23 | 43 |
| 815 Summer St | 0.75mi | 4/1.5 (+1) | 2,200 (-6%) | 11mo | $129,000 | $59 | 38 |
| 2500 Sunrise Ln | 0.71mi | 4/3.0 (+1) | 2,265 (-4%) | 13mo | $262,450 | $116 | 37 |
| 703 S 13th St | 0.74mi | 2/1.0 (-1) | 2,043 (-13%) | 13mo | $9,000 | $4 | 28 |
| 1126 Franklin St | 0.73mi | 4/2.0 (+1) | 2,082 (-11%) | 16mo | $17,000 | $8 | 25 |
Match score weights: distance 35% · size 25% · config 20% · recency 20%. Top-matched comps best support the ARV.
Projected returns pro-forma
-3.0% appreciation · 3.0% rent growth · sell at horizon
- IRR
- —
- Equity multiple
- 10.25×
- Total profit
- $51,529
- Equity at exit
- $2,967
- IRR
- —
- Equity multiple
- 21.72×
- Total profit
- $115,426
- Equity at exit
- $1,721
Cash invested: $5,572 (down + closing). Projections, not guarantees.
Landlord ↔ Tenant lean methodology
- Overall (STATE)
- 83 Strongly Landlord-Friendly
- State Iowa
- 83 Strongly Landlord-Friendly · R+6
- County
- — inherits STATE
- City
- — inherits STATE
ZIP-level market 52601
- Active inventory
- 184
- Price-to-rent
- 1.3×
Monthly cashflow live
- Estimated rent
- $1,262 medium interval (Pro) →
- Mortgage (P&I)
- −$104
- Tax est. 1.5%
- −$25 /mo · $298/yr
- Insurance
- −$8
- HOA
- −$0
- Vacancy / Maint / Mgmt
- −$265
- Net cashflow
- $859
Break-even live
UW: 25.0% down · 7.5% · 30yr · 1.5% tax · 5.0% vac · 8.0% maint · 8.0% mgmt
Financing live
Cash to close
- Down payment
- $4,975
- Closing costs
- $597
- Reserves months
- —
- Total cash needed
- —
Loan-product check · same deal, 3 products live
Conventional
25% down · 7.5% · 30yr
- Down + closing
- —
- Monthly P&I
- —
- Monthly cashflow
- —
- DSCR
- —
- Eligible?
- —
Personal DTI + credit; lowest rate.
DSCR
20% down · 8.5% · 30yr
- Down + closing
- —
- Monthly P&I
- —
- Monthly cashflow
- —
- DSCR
- —
- Eligible?
- —
No personal income docs; deal must DSCR.
Hard money
10% down · 12.0% · 12mo
- Down + closing
- —
- Monthly P&I
- —
- Monthly cashflow
- —
- DSCR
- —
- Eligible?
- —
Short-term bridge; refi at stabilization.
Listing history 21 events
-
2026-06-19days on market $19,900 Active 246 DOM
-
2026-06-18days on market $19,900 Active 245 DOM
-
2026-06-17days on market $19,900 Active 244 DOM
-
2026-06-16days on market $19,900 Active 243 DOM
-
2026-06-15days on market $19,900 Active 242 DOM
-
2026-06-14days on market $19,900 Active 240 DOM
-
2026-06-12pricedays on market $19,900 Active 239 DOM
-
2026-06-09days on market $24,500 Active 236 DOM
-
2026-06-08days on market $24,500 Active 235 DOM
-
2026-06-07days on market $24,500 Active 234 DOM
-
2026-06-07days on market $24,500 Active 233 DOM
-
2026-06-03days on market $24,500 Active 230 DOM
-
2026-06-02days on market $24,500 Active 229 DOM
-
2026-06-01days on market $24,500 Active 228 DOM
-
2026-05-31days on market $24,500 Active 227 DOM
-
2026-05-30days on market $24,500 Active 226 DOM
-
2026-03-27price $24,500 253-char remark
Show marketing remark (253 chars)
Huge home with lots of potential. Could be duplexed although one unit currently. Very little would have to be done to revert it back to a duplex. Needs some TLC but lots of character in this home. house is 100 Marshall by address but is actually 102-104
-
2026-01-07price $27,500 253-char remark
Show marketing remark (253 chars)
Huge home with lots of potential. Could be duplexed although one unit currently. Very little would have to be done to revert it back to a duplex. Needs some TLC but lots of character in this home. house is 100 Marshall by address but is actually 102-104
-
2025-12-19price $39,900 253-char remark
Show marketing remark (253 chars)
Huge home with lots of potential. Could be duplexed although one unit currently. Very little would have to be done to revert it back to a duplex. Needs some TLC but lots of character in this home. house is 100 Marshall by address but is actually 102-104
-
2025-11-11price $41,500 253-char remark
Show marketing remark (253 chars)
Huge home with lots of potential. Could be duplexed although one unit currently. Very little would have to be done to revert it back to a duplex. Needs some TLC but lots of character in this home. house is 100 Marshall by address but is actually 102-104
-
2025-10-16$49,900 Active 253-char remark
Show marketing remark (253 chars)
Huge home with lots of potential. Could be duplexed although one unit currently. Very little would have to be done to revert it back to a duplex. Needs some TLC but lots of character in this home. house is 100 Marshall by address but is actually 102-104
ⓘ Source: listings_history table (triggers on properties + properties_extension) + one-shot
backfill from property_details.listing_events for pre-trigger history.
Climate risk First Street
- Flood 1/10 Low FEMA zone X (unshaded) · 0% chance over 30 yrs
- Wildfire 1/10 Low
- Heat 3/10 Moderate 7 d/yr ≥106°F today · 16 d/yr by 30 yrs out
- Wind 2/10 Low
- Air quality 2/10 Low 0 unhealthy d/yr today · 1 by 30 yrs out
Nearby sold comps map
Loading sold comps map…
Walkable amenities ~0.75 mi
Loading nearby amenities…
Taxation est. · year 1
- Rental income
- $15,143
- − Mortgage interest
- −$1,115
- − Property taxes
- −$298
- − Insurance
- −$100
- − Repairs & maintenance
- −$1,211
- − Management
- −$1,211
- − Depreciation
- −$579
- Taxable income
- $10,628
- Est. tax owed @ 24.0%
- −$2,551
- After-tax cash flow
- $7,762/yr
For passive investors: Depreciation is non-cash, so a rental often shows a tax loss while cash-flowing — sheltering income. Rental losses are passive: they offset passive income freely, and up to $25,000/yr can offset ordinary (W-2) income if you actively participate and your MAGI is under $100k (phasing out to $0 by $150k); unused losses carry forward. On sale, claimed depreciation is recaptured at up to 25%, and gains may owe capital-gains tax (a 1031 exchange can defer both). Figures are a year-1 estimate at your 24.0% rate — not tax advice; consult a CPA.
Condition & rehab AI · 12 photos
This property requires extensive repairs and updates to bring it up to a livable condition. Significant investment is needed to address the roof, exterior, and interior systems.
Repairs flagged
- Major roof — visible wear
- Major exterior siding — damaged
- Major kitchen cabinets — in disrepair
- Major bathroom fixtures — in disrepair
- Major HVAC unit — exposed
Value-add opportunities
- Resale roof replacement — major safety and aesthetic issue
- Resale exterior siding repair — enhances curb appeal
- Resale kitchen cabinets replacement — modernizes space
- Resale bathroom fixtures replacement — modernizes space
- Both HVAC unit replacement — improves comfort and energy efficiency
Renovation cost estimate screening
| Repair item | Severity | Est. cost |
|---|---|---|
| roof · visible wear | Major | $15,000–50,000 |
| exterior siding · damaged | Major | $15,000–50,000 |
| kitchen cabinets · in disrepair | Major | $15,000–50,000 |
| bathroom fixtures · in disrepair | Major | $15,000–50,000 |
| HVAC unit · exposed | Major | $15,000–50,000 |
| Total estimated repair cost · 5 items | $75,000–250,000 |
Value-add ROI direction
- Resale roof replacement — major safety and aesthetic issue ↑
- Resale exterior siding repair — enhances curb appeal ↑
- Resale kitchen cabinets replacement — modernizes space ↑
- Resale bathroom fixtures replacement — modernizes space ↑
- Both HVAC unit replacement — improves comfort and energy efficiency ↑
ⓘ Cost ranges are severity-bucket heuristics (US national rule-of-thumb). Get contractor quotes + a written scope before underwriting a rehab budget.
Schools (NCES district)
- District
- Burlington Community School District
- NCES district ID
- 1905790
- Math proficiency
- 42% ▼ -4.00%
- Reading proficiency
- 54% ▼ -1.00%
- Median HH income
- $41,833
- Composite
- 40.3/100
- National rank
- #3753
- State rank
- #286 of 289 in IA
Livability — Burlington
- Score
- 73/100
- State rank
- #287
- US rank
- #5540
Category grades
Schools grade is shown separately in the Schools card above.
Census & demographics
- Census place
- Burlington, IA
- County
- Des Moines County · 27,341 people
- City population
- 27,341
- Metro
- Burlington, IA-IL
- Population (ZIP)
- 27,341
- Household income
- $60,983
- Rent vs Own
- Severe rent burden
- 963.0
Population outlook (Des Moines County) Hauer SSP2
- Today (2025)
- 39,735 people
- By 2030
- 39,257 · -1.2%
- By 2040
- 38,090 · -4.1%
- By 2050
- 37,156 · -6.5%
- By 2075
- 36,905 · -7.1%
- By 2100
- 37,222 · -6.3%
Race, ethnicity, and origin ACS 2023
- Neighborhood character
- Predominantly White (83%)
- Race & ethnicity
- White 83% Two or more races 8% Black 5% Hispanic / Latino 4% Asian 1%
- Common ancestry
- Iranian 2% Lithuanian 2% Slovak 2%
- Foreign-born
- 3% · Canada
- Languages at home
- 95% English-only · Spanish 3% Other Asian/Pacific 1%
Political lean MEDSL · Des Moines
- 2024 margin
- R (+15.1) · D 41.8% · R 56.8% · Other 1.4%
- 2008→2024 swing
- -38.1pp toward R · 2008: 23.0pp · 2024: -15.1pp
- All cycles
- 2024: R+15.1 2020: R+8.5 2016: R+7.0 2012: D+18.5 2008: D+23.0
Not yet ingested
- Civics
- —
Market trends
- HPI YoY
- ▼ -83.48%
- Current HPI
- 149.7662
- Rent YoY
- —
- Metro
- Burlington, IA-IL
- State GDP YoY
- ▲ 2.48%
- F500 in state
- 4
Industry mix (Fortune 500 HQ in IA)
| Industry | F500 HQs | Revenue |
|---|---|---|
| Financial Services | 1 | $16B |
|
||
| Retail / Convenience | 1 | $15B |
|
||
Price history
-50.9% since first listed5 events — show timeline
- 2026-03-27 Price Changed $24,500 Muscatine BOR
- 2026-01-07 Price Changed $27,500 Muscatine BOR
- 2025-12-19 Price Changed $39,900 Muscatine BOR
- 2025-11-11 Price Changed $41,500 Muscatine BOR
- 2025-10-16 Listed $49,900 Muscatine BOR
Cash-flow waterfall
monthlySold comps — $/sqft
last 12 mo · ≤1 miLoading sold comps…