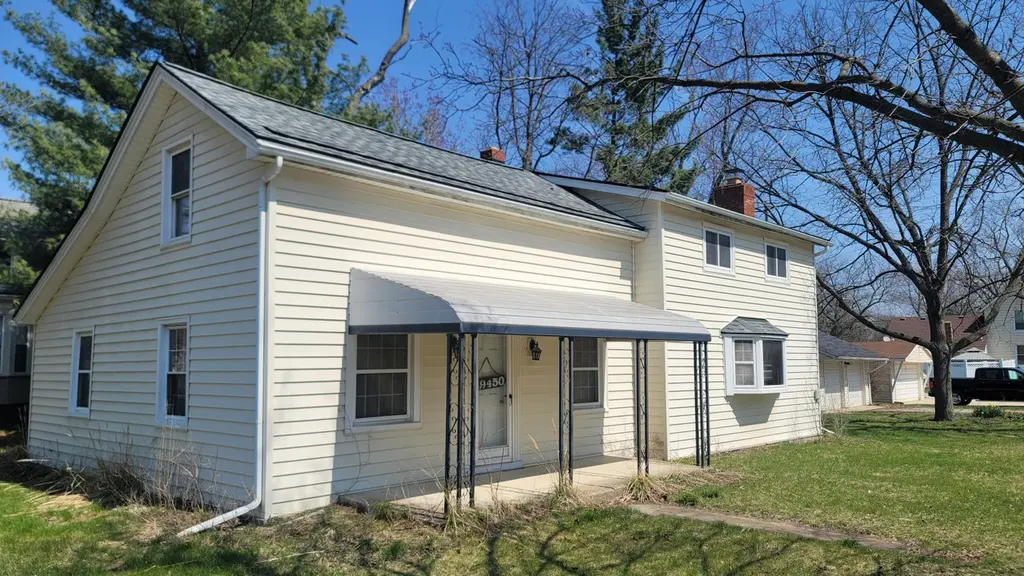
49450 Cross St · Belleville, MI
Flood risk 1/10 · Minimal
- FEMA flood zone
- X (unshaded)
- Chance of flooding over 30 yrs
- 0.0%
- Est. flood insurance / yr
- $507 – $1,088
Fire risk 1/10 · Minimal
- Est. fire insurance / yr
- $784 – $1,456
Heat risk 3/10 · Minor
- Hot days now (above 97°F)
- 7 days/yr
- Hot days in 30 yrs
- 15 days/yr
Wind risk 2/10 · Minimal
- Chance of severe wind over 30 yrs
- —
Air-quality risk 3/10 · Minor
- Unhealthy air days now
- 2 days/yr
- Unhealthy air days in 30 yrs
- 3 days/yr
Risk factors via First Street. Map © Google.
Why this score? — see what drove the C- grade
The composite is a weighted blend of 9 inputs, each scored 0–100. Each bar is that input's sub-score; the figure is the points it added to the 100-point composite (weight × sub-score).
- Cash flow +16.5/30.0
- ARV discount +15.0/15.0
- DSCR +5.1/10.0
- 1% rule +4.0/10.0
- Livability +3.8/5.0
- Rent growth +3.4/5.0
- Schools +3.3/10.0
- Condition / age +2.5/5.0
- Appreciation +0.0/10.0
$249,900
🖨 Deal sheet 📄 Offer letter ✓ Due diligence
Listing remarks MLS
2 story 2 bath house features a large 2 car garage, nice corner lot, and spacious family room with fireplace. 3 upper level bedrooms include a large primary bedroom and a great space for a library, office, or den. Roof replaced in 2024, electrical upgrade in 2022.
Key facts
- Upper level bedrooms
- Large car garage
- Primary bedroom
Tags
Property features AI
Exterior
- Parking: Detached 2-car garage
- Utilities: Natural gas connected; Cable connected; High-speed internet
- Home design: Colonial style; Single-family residence; Built in 1900; Public water
- Construction: Vinyl siding
- Exterior features: Corner lot
Interior
- Kitchen: Dishwasher; Disposal; Range; Refrigerator
- Bedrooms: Primary bedroom; Bedroom 2; Bedroom 3; Bedroom 4; Den
- Bathrooms: 2 full bathrooms
- Heating & cooling: Baseboard heating; Window unit cooling; Natural gas water heater
- Interior features: Garage door opener; Wood-burning fireplace; Bay/bow windows; 12 total rooms; Crawl space and slab basement
- Laundry & utility: Washer; Dryer; Laundry room
Neighborhood map
What this means for you Summary
Snapshot
- This is a 4-bed/1.0-bath single-family listed at $250k.
Deal economics
- At list price, monthly cash flow is $145 ($2k/yr) — positive.
- The deal already cash-flows at list — no discount required.
- To meet the 1% rule (rent ≥ 1% of price), the offer needs to be $224k (10.5% below list).
- Recommended offer: $224k (10.5% below list) — sets the bar for 1% rule.
- Cap rate 7.0% vs local median 3.4% in Belleville — top-decile yield for the area; either an underpriced asset or a hidden risk that comps aren't pricing in. Stress-test before assuming the spread holds.
Location & tenants
- Location reads 75/100 on livability (#164 in MI, #4,360 nationally) — a middle-class / working-renter tenant base. Strengths: cost of living A+, housing A+, health & safety A+; Watch: schools D, employment D, amenities F.
- Van Buren Public Schools (suburban): math 33% / reading 43% proficiency, ranked #228 of 540 in MI (top 42%) — families likely to look elsewhere, expect single-tenant / working-renter base with shorter leases.
- Market conditions: Rents rising (+3.6%/yr); 216 active listings in the ZIP; 1 comparable units currently listed for rent nearby; solid renter incomes; 2,639 units permitted in Wayne County in 2024 (1,216 in 5+ unit buildings).
- This rent runs 35% of the median local income ($77k/yr) — at the standard rent-burdened threshold; future hikes will face affordability resistance.
Forward outlook
- Local home prices are declining (-3.0%/yr); year-one equity from $2k of loan paydown is wiped out by about $7k of value loss. Plan a longer hold.
- Wayne County population projected at -17% by 2050 — secular population decline; favor cash flow + early exit over multi-decade hold.
Negotiation context
- Only 5 days on market — expect competitive offers; lowballing is unlikely to land.
- 4 sale attempts since 27y ago with the ask held roughly flat each time — persistent listings suggest the price (not the market) is what's stuck; bring a comps-based counter.
- Current owner paid $150k; list at $250k implies a 67% gain — meaningful room to come down on a strong offer.
Risks & watch-outs
- Watch-outs: built in 1900 — expect roof / HVAC / electrical / plumbing capex.
Questions for the listing agent
- Built in 1900 — when were the roof, HVAC, electrical panel, plumbing, and water heater last replaced?
- Is there a deadline driving the sale (1031 exchange, divorce, estate, relocation)? That informs how much negotiation room exists.
- Schools are D-rated, which usually means shorter tenancies and higher turnover. Who's the typical renter profile here, and what's been the actual vacancy rate?
- What's the average days-on-market for RENTAL listings here right now (not sales)? A rising rental-DOM trend means longer vacancies and softer asking-rent achievability than the comps imply.
- What's the recent tenant-quality profile in this submarket — average credit score on applications, eviction rate, late-payment / NSF rate, and stable-employment percentage? A property-management company in the area should have these aggregated.
- How much new for-sale + rental construction is in the pipeline within 1–3 miles? Heavy new supply typically softens prices + rents 12–24 months out; constrained supply supports both.
Investment metrics
- 1% rule
- 0.90% ✗
- Cap rate
- 6.99%
- Cash-on-cash
- 2.48%
- DSCR
- 1.11
- GRM
- 9.3
CMA / ARV
- ARV (median comp)
- $318,084
- List price
- $249,900
- Delta
- -21.44%
- Verdict
- UNDERPRICED
- Comps
- 20 within 1.0 mi
Show comp detail 6 sales within ~0.75 mi
| Address | Dist | Beds/Ba | Sqft | Sold | Price | $/sf | Match |
|---|---|---|---|---|---|---|---|
| 6201 Gilmore St | 0.04mi | 3/2.0 (-1) | 1,677 (-7%) | 20mo | $305,000 | $182 | 61 |
| 49096 Ashbury Dr | 0.16mi | 3/1.5 (-1) | 1,540 (-14%) | 23mo | $395,000 | $256 | 42 |
| 50090 Bluebell St | 0.73mi | 3/2.0 (-1) | 1,877 (+4%) | 13mo | $510,820 | $272 | 39 |
| 5128 Mayer St | 0.72mi | 3/3.0 (-1) | 1,812 (+1%) | 17mo | $595,740 | $329 | 38 |
| 5104 Mayer | 0.74mi | 3/2.0 (-1) | 1,877 (+4%) | 19mo | $523,265 | $279 | 34 |
| 4974 Addington | 0.72mi | 3/2.0 (-1) | 1,859 (+3%) | 23mo | $502,365 | $270 | 33 |
Match score weights: distance 35% · size 25% · config 20% · recency 20%. Top-matched comps best support the ARV.
Projected returns pro-forma
-3.0% appreciation · 3.64% rent growth · sell at horizon
- IRR
- -11.7%
- Equity multiple
- 0.57×
- Total profit
- $-29,867
- Equity at exit
- $37,261
- IRR
- -1.7%
- Equity multiple
- 0.88×
- Total profit
- $-8,249
- Equity at exit
- $21,607
Cash invested: $69,972 (down + closing). Projections, not guarantees.
Landlord ↔ Tenant lean methodology
- Overall (STATE)
- 62 Landlord-Friendly
- State Michigan
- 62 Landlord-Friendly · EVEN
- County
- — inherits STATE
- City
- — inherits STATE
ZIP-level market 48111
- Rents YoY
- 3.6%
- Active inventory
- 216
- Price-to-rent
- 9.3×
Monthly cashflow live
- Estimated rent
- $2,237 medium interval (Pro) →
- Mortgage (P&I)
- −$1,311
- Tax from tax record
- −$208 /mo · $2,493/yr
- Insurance
- −$104
- HOA
- −$0
- Vacancy / Maint / Mgmt
- −$470
- Net cashflow
- $145
Break-even live
UW: 25.0% down · 7.5% · 30yr · 1.5% tax · 5.0% vac · 8.0% maint · 8.0% mgmt
Financing live
Cash to close
- Down payment
- $62,475
- Closing costs
- $7,497
- Reserves months
- —
- Total cash needed
- —
Loan-product check · same deal, 3 products live
Conventional
25% down · 7.5% · 30yr
- Down + closing
- —
- Monthly P&I
- —
- Monthly cashflow
- —
- DSCR
- —
- Eligible?
- —
Personal DTI + credit; lowest rate.
DSCR
20% down · 8.5% · 30yr
- Down + closing
- —
- Monthly P&I
- —
- Monthly cashflow
- —
- DSCR
- —
- Eligible?
- —
No personal income docs; deal must DSCR.
Hard money
10% down · 12.0% · 12mo
- Down + closing
- —
- Monthly P&I
- —
- Monthly cashflow
- —
- DSCR
- —
- Eligible?
- —
Short-term bridge; refi at stabilization.
Rent comps 1 comps
| Address | Beds | Baths | Sqft | Rent | $/sqft | DOM | Units | Dist |
|---|---|---|---|---|---|---|---|---|
| 4897 Mayer Canton, MI | 3.0 | 2.5 | 2521 | $3,600 | $1.43 | 2d | 1 | 0.81mi |
Listing history 6 events
-
2026-05-14$249,900 Active 268-char remark
Show marketing remark (264 chars)
2 story 2 bath house features a large 2 car garage, nice corner lot, and spacious family room with fireplace. 3 upper level bedrooms include a large primary bedroom and a great space for a library, office, or den. Roof replaced in 2024, electrical upgrade in 2022.
-
2026-05-14$249,900 Active 264-char remark
Show marketing remark (264 chars)
2 story 2 bath house features a large 2 car garage, nice corner lot, and spacious family room with fireplace. 3 upper level bedrooms include a large primary bedroom and a great space for a library, office, or den. Roof replaced in 2024, electrical upgrade in 2022.
-
2026-05-14$249,900 Active
Show marketing remark (264 chars)
2 story 2 bath house features a large 2 car garage, nice corner lot, and spacious family room with fireplace. 3 upper level bedrooms include a large primary bedroom and a great space for a library, office, or den. Roof replaced in 2024, electrical upgrade in 2022.
-
2000-07-20soldstatus $150,000
-
2000-05-24soldstatus $150,000
-
1999-09-23$154,900
ⓘ Source: listings_history table (triggers on properties + properties_extension) + one-shot
backfill from property_details.listing_events for pre-trigger history.
Tax reassessment forecast MI · Partial reset (capped growth)
- Current annual tax
- $2,493 · $208/mo
- Projected year-2 tax
- $3,171 · $264/mo
- Expected delta
- +$678/yr (+$56/mo · 27.2%)
ⓘ Screening estimate from a state-policy table — verify with the county assessor before closing.
Climate risk First Street
- Flood 1/10 Low FEMA zone X (unshaded) · 0% chance over 30 yrs
- Wildfire 1/10 Low
- Heat 3/10 Moderate 7 d/yr ≥97°F today · 15 d/yr by 30 yrs out
- Wind 2/10 Low
- Air quality 3/10 Moderate 2 unhealthy d/yr today · 3 by 30 yrs out
Nearby sold comps map
Loading sold comps map…
Walkable amenities ~0.75 mi
Loading nearby amenities…
Taxation est. · year 1
- Rental income
- $26,840
- − Mortgage interest
- −$13,998
- − Property taxes
- −$2,493
- − Insurance
- −$1,250
- − Repairs & maintenance
- −$2,147
- − Management
- −$2,147
- − Depreciation
- −$7,270
- Taxable loss
- −$2,465
- Est. tax savings @ 24.0%
- +$592
- After-tax cash flow
- $2,327/yr
For passive investors: Depreciation is non-cash, so a rental often shows a tax loss while cash-flowing — sheltering income. Rental losses are passive: they offset passive income freely, and up to $25,000/yr can offset ordinary (W-2) income if you actively participate and your MAGI is under $100k (phasing out to $0 by $150k); unused losses carry forward. On sale, claimed depreciation is recaptured at up to 25%, and gains may owe capital-gains tax (a 1031 exchange can defer both). Figures are a year-1 estimate at your 24.0% rate — not tax advice; consult a CPA.
Schools (NCES district)
- District
- Van Buren Public Schools
- NCES district ID
- 2634560
- Math proficiency
- 33% ▲ 6.00%
- Reading proficiency
- 43% ▲ 6.00%
- Median HH income
- $54,166
- Composite
- 33.2/100
- National rank
- #5533
- State rank
- #228 of 540 in MI
Livability — Belleville
- Score
- 75/100
- State rank
- #164
- US rank
- #4360
Category grades
Schools grade is shown separately in the Schools card above.
Census & demographics
- County
- Wayne County · 1,562,939 people
- City population
- 44,709
- Metro
- Detroit-Warren-Dearborn, MI
- Population (ZIP)
- 44,709
- Household income
- $76,595
- Rent vs Own
- Severe rent burden
- 1200.0
Population outlook (Wayne County) Hauer SSP2
- Today (2025)
- 1,675,273 people
- By 2030
- 1,620,300 · -3.3%
- By 2040
- 1,502,341 · -10.3%
- By 2050
- 1,384,039 · -17.4%
- By 2075
- 1,124,592 · -32.9%
- By 2100
- 881,193 · -47.4%
Race, ethnicity, and origin ACS 2023
- Neighborhood character
- Predominantly White (66%)
- Race & ethnicity
- White 66% Black 22% Two or more races 7% Hispanic / Latino 4% Asian 2%
- Common ancestry
- Romanian 8% Lithuanian 3% Slovak 3%
- Foreign-born
- 4% · Canada
- Languages at home
- 95% English-only · Spanish 1% Other Indo-European 1% Arabic 1%
Political lean MEDSL · Wayne
- 2024 margin
- Strong D (+29.0) · D 62.7% · R 33.7% · Other 3.6%
- 2008→2024 swing
- -20.5pp toward R · 2008: 49.5pp · 2024: 29.0pp
- All cycles
- 2024: D+29.0 2020: D+38.1 2016: D+37.3 2012: D+46.9 2008: D+49.5
Not yet ingested
- Civics
- —
Market trends
- HPI YoY
- ▼ -238.11%
- Current HPI
- 236.4458
- Rent YoY
- ▲ 3.64%
- Metro
- Detroit-Warren-Dearborn, MI
- State GDP YoY
- ▲ 1.37%
- F500 in state
- 28
Industry mix (Fortune 500 HQ in MI)
| Industry | F500 HQs | Revenue |
|---|---|---|
| Automotive Parts | 3 | $48B |
|
||
| Automotive | 2 | $372B |
|
||
| Chemicals | 1 | $45B |
|
||
| Automotive Retail | 1 | $29B |
|
||
| Healthcare / Medical Devices | 1 | $23B |
|
||
| Automotive Technology | 1 | $20B |
|
||
Price history
+61.3% since first listed9 events — show timeline
- 2026-05-19 Pending — REALCOMP
- 2026-05-19 Pending — MiRealSource-MiMLS
- 2026-05-19 Pending — SW Michigan MLS
- 2026-05-14 Listed $249,900 SW Michigan MLS
- 2026-05-14 Listed $249,900 MiRealSource-MiMLS
- 2026-05-14 Listed $249,900 REALCOMP
- 2000-07-20 Sold (Public Records) $150,000 Public Records
- 2000-05-24 Sold (MLS) $150,000 REALCOMP
- 1999-09-23 Listed $154,900 REALCOMP
Property tax history
+4.8%/yrLatest (2025): $2,493 · +93.3% YoY. Source: county tax records.
Cash-flow waterfall
monthlySold comps — $/sqft
last 12 mo · ≤1 miLoading sold comps…