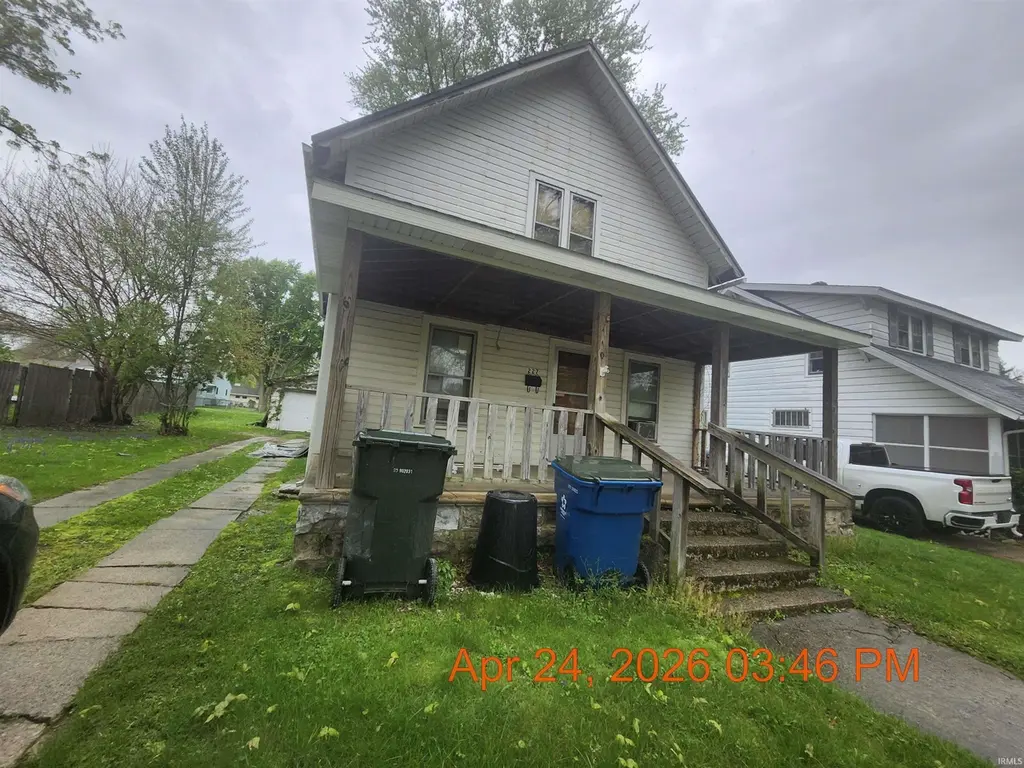
227 Elliott Ave · Plymouth, IN
Flood risk 1/10 · Minimal
- FEMA flood zone
- X (unshaded)
- Chance of flooding over 30 yrs
- 0.0%
- Est. flood insurance / yr
- $473 – $860
Fire risk 1/10 · Minimal
- Est. fire insurance / yr
- $717 – $1,331
Heat risk 2/10 · Minimal
- Hot days now (above 101°F)
- 7 days/yr
- Hot days in 30 yrs
- 16 days/yr
Wind risk 2/10 · Minimal
- Chance of severe wind over 30 yrs
- —
Air-quality risk 2/10 · Minimal
- Unhealthy air days now
- 1 days/yr
- Unhealthy air days in 30 yrs
- 1 days/yr
Risk factors via First Street. Map © Google.
Why this score? — see what drove the B- grade
The composite is a weighted blend of 9 inputs, each scored 0–100. Each bar is that input's sub-score; the figure is the points it added to the 100-point composite (weight × sub-score).
- Cash flow +30.0/30.0
- 1% rule +10.0/10.0
- DSCR +10.0/10.0
- ARV discount +7.5/15.0
- Livability +3.6/5.0
- Schools +3.2/10.0
- Rent growth +2.5/5.0
- Condition / age +2.5/5.0
- Appreciation +0.0/10.0
$55,000
🖨 Deal sheet (PDF) 📄 Offer letter ✓ Due diligence
Listing remarks
Investors, cash only ! 4 bedroom, 1 bath home, 1536 sq ft. Close to schools and conveniences. SOLD AS IS, Where Is
Key facts
- 7,405 sq ft lot
- Garage
- Built 1930
Property features AI
Finance
- Other: Property listed by eXp Realty, LLC
- Financial info: Tax information provided but omitted
- HOA & community: No subdivision
Exterior
- Parking: Detached 1-car garage
- Security: Security details not provided
- Utilities: Public water; Public sewer
- Home design: Single-family residence; Site-built home; One story
- Construction: Vinyl siding
- Exterior features: Level lot
Interior
- Kitchen: Kitchen details not provided
- Bedrooms: Bedroom count not specified
- Flooring: Flooring details not provided
- Bathrooms: One full bathroom (on main level)
- Heating & cooling: Forced air heating; No cooling system
- Interior features: Partial, unfinished basement; Total of 9 rooms
- Laundry & utility: Laundry located on the main level
Neighborhood map
What this means for you Summary
Snapshot
- This is a 4-bed/1.0-bath single-family listed at $55k.
Deal economics
- At list price, monthly cash flow is $1k ($12k/yr) — positive.
- The deal already cash-flows at list — no discount required.
- Meets the 1% rule at list price ($2k rent vs $55k).
- Cap rate 28.5% vs local median 3.5% in Plymouth — top-decile yield for the area; either an underpriced asset or a hidden risk that comps aren't pricing in. Stress-test before assuming the spread holds.
Location & tenants
- Location reads 71/100 on livability (#142 in IN) — a middle-class / working-renter tenant base. Strengths: cost of living A+, housing A+, health & safety A+; Watch: crime C-, amenities F, commute F.
- Plymouth Community School Corporation (town): math 33% / reading 41% proficiency, ranked #173 of 301 in IN (top 58%) — families likely to look elsewhere, expect single-tenant / working-renter base with shorter leases.
- Zoned schools: Jefferson Elementary School (math 57% / reading 42%, grade D, #279 of 994 statewide, top 30%, 303 students, 68% FRL); Lincoln Junior High School (math 30% / reading 46%, grade F, #136 of 330 statewide, top 44%, 510 students, 56% FRL); Plymouth High School (math 37% / reading 60%, grade D, #139 of 369 statewide, top 38%, 1,078 students, 51% FRL).
- Market conditions: 82 active listings in the ZIP; 3 comparable units currently listed for rent nearby; rentals lingering (median 44d on market — plan ~5-8 weeks vacancy on turnover, expect pricing pressure); 67% of comp listings sitting > 30 days — soft ceiling on asking rent; 147 units permitted in Marshall County in 2024 (0 in 5+ unit buildings).
- This rent runs 31% of the median local income ($73k/yr) — at the standard rent-burdened threshold; future hikes will face affordability resistance.
Forward outlook
- Local home prices are declining (-3.0%/yr); year-one equity from $380 of loan paydown is wiped out by about $2k of value loss. Plan a longer hold.
- Marshall County population projected to shrink 9% by 2050 — rents likely to lag national; underwrite the cash flow, not the appreciation.
- At projected returns (-3.0% appreciation + 3.0% rent growth), your $15k cash investment doubles in ~2 years — after that, you're playing with house money.
Negotiation context
- Only 3 days on market — expect competitive offers; lowballing is unlikely to land.
- Current owner paid $47k; 17% above their basis — modest negotiation headroom, anchor on the comps not their cost.
Risks & watch-outs
- Watch-outs: property tax is 4.1% of price; built in 1930 — expect roof / HVAC / electrical / plumbing capex.
Questions for the listing agent
- Built in 1930 — when were the roof, HVAC, electrical panel, plumbing, and water heater last replaced?
- Property tax is high relative to price — has the assessment been appealed recently, and will the sale trigger a re-assessment?
- Is there a deadline driving the sale (1031 exchange, divorce, estate, relocation)? That informs how much negotiation room exists.
- Schools are D-rated, which usually means shorter tenancies and higher turnover. Who's the typical renter profile here, and what's been the actual vacancy rate?
- What's the average days-on-market for RENTAL listings here right now (not sales)? A rising rental-DOM trend means longer vacancies and softer asking-rent achievability than the comps imply.
- What's the recent tenant-quality profile in this submarket — average credit score on applications, eviction rate, late-payment / NSF rate, and stable-employment percentage? A property-management company in the area should have these aggregated.
- How much new for-sale + rental construction is in the pipeline within 1–3 miles? Heavy new supply typically softens prices + rents 12–24 months out; constrained supply supports both.
Investment metrics
- 1% rule
- 3.50% ✓
- Cap rate
- 28.49%
- Cash-on-cash
- 79.27%
- DSCR
- 4.53
- GRM
- 2.4
CMA / ARV
- ARV (median comp)
- $184,683
- List price
- $55,000
- Delta
- -70.22%
- Verdict
- UNDERPRICED
- Comps
- 20 within 1.0 mi
Show comp detail 12 sales within ~0.75 mi
| Address | Dist | Beds/Ba | Sqft | Sold | Price | $/sf | Match |
|---|---|---|---|---|---|---|---|
| 227 Elliott Ave | 0.00mi | 4/1.0 | 1,536 (0%) | 1mo | $46,900 | $31 | 100 |
| 829 N Michigan St | 0.21mi | 3/2.0 (-1) | 1,536 (0%) | 3mo | $164,900 | $107 | 79 |
| 1222 N Center St | 0.24mi | 4/1.0 | 1,648 (+7%) | 1mo | $183,000 | $111 | 75 |
| 824 N Michigan St | 0.19mi | 4/1.5 | 1,595 (+4%) | 9mo | $112,500 | $71 | 75 |
| 257 Elliott Ave | 0.04mi | 3/1.5 (-1) | 1,664 (+8%) | 15mo | $229,500 | $138 | 65 |
| 404 Klinger Ave | 0.17mi | 3/2.0 (-1) | 1,620 (+6%) | 11mo | $230,000 | $142 | 65 |
| 307 Baker St | 0.06mi | 3/2.0 (-1) | 1,756 (+14%) | 2mo | $222,500 | $127 | 63 |
| 101 N Liberty St | 0.64mi | 3/1.0 (-1) | 1,520 (-1%) | 9mo | $165,000 | $109 | 56 |
| 806 N Plum St | 0.37mi | 3/1.5 (-1) | 1,373 (-11%) | 10mo | $169,900 | $124 | 49 |
| 618 E Laporte St | 0.70mi | 3/1.0 (-1) | 1,400 (-9%) | 8mo | $175,000 | $125 | 41 |
| 216 N Plum St | 0.61mi | 3/1.5 (-1) | 1,664 (+8%) | 13mo | $150,000 | $90 | 40 |
| 702 E Laporte St | 0.73mi | 3/2.0 (-1) | 1,700 (+11%) | 13mo | $200,000 | $118 | 28 |
Match score weights: distance 35% · size 25% · config 20% · recency 20%. Top-matched comps best support the ARV.
Projected returns pro-forma
-3.0% appreciation · 3.0% rent growth · sell at horizon
- IRR
- 79.5%
- Equity multiple
- 4.64×
- Total profit
- $55,985
- Equity at exit
- $8,201
- IRR
- 82.9%
- Equity multiple
- 9.61×
- Total profit
- $132,603
- Equity at exit
- $4,755
Cash invested: $15,400 (down + closing). Projections, not guarantees.
Landlord ↔ Tenant lean methodology
- Overall (STATE)
- 90 Strongly Landlord-Friendly
- State Indiana
- 90 Strongly Landlord-Friendly · R+11
- County
- — inherits STATE
- City
- — inherits STATE
ZIP-level market 46563
- Home prices YoY
- -27.7%
- Active inventory
- 82
- Price-to-rent
- 2.4×
Monthly cashflow live
- Estimated rent
- $1,922 medium interval (Pro) →
- Mortgage (P&I)
- −$288
- Tax from tax record
- −$190 /mo · $2,279/yr
- Insurance
- −$23
- HOA
- −$0
- Vacancy / Maint / Mgmt
- −$404
- Net cashflow
- $1,017
Break-even live
Sensitivity live
| Price | -10% $1,048 | -5% $1,033 | +0% $1,017 | +5% $1,002 | +10% $986 |
|---|---|---|---|---|---|
| Rent | -10% $865 | -5% $941 | +0% $1,017 | +5% $1,093 | +10% $1,169 |
| Rate | -1.0pp $1,045 | -0.5pp $1,031 | base $1,017 | +0.5pp $1,003 | +1.0pp $989 |
UW: 25.0% down · 7.5% · 30yr · 1.5% tax · 5.0% vac · 8.0% maint · 8.0% mgmt
Financing live
Cash to close
- Down payment
- $13,750
- Closing costs
- $1,650
- Reserves months
- —
- Total cash needed
- —
Loan-product check · same deal, 3 products live
Conventional
25% down · 7.5% · 30yr
- Down + closing
- —
- Monthly P&I
- —
- Monthly cashflow
- —
- DSCR
- —
- Eligible?
- —
Personal DTI + credit; lowest rate.
DSCR
20% down · 8.5% · 30yr
- Down + closing
- —
- Monthly P&I
- —
- Monthly cashflow
- —
- DSCR
- —
- Eligible?
- —
No personal income docs; deal must DSCR.
Hard money
10% down · 12.0% · 12mo
- Down + closing
- —
- Monthly P&I
- —
- Monthly cashflow
- —
- DSCR
- —
- Eligible?
- —
Short-term bridge; refi at stabilization.
Rent comps 3 comps
| Address | Beds | Baths | Sqft | Rent | $/sqft | DOM | Units | Dist |
|---|---|---|---|---|---|---|---|---|
| 1113 Baker St Plymouth, IN | 4.0 | 3.0 | 1640 | $2,195 | $1.34 | 44d | 1 | 0.75mi |
| 1280 Dora Ln Plymouth, IN | 2.0–3.0 | 1.0–2.0 | 995 | $1,260 | $1.27 | 44d | 1 | 0.78mi |
| 2234 Bitter Root Dr Plymouth, IN | 1.0–3.0 | 1.0–2.5 | 1249 | $2,195 | $1.76 | 14d | 2 | 0.80mi |
Listing history 2 events
-
2026-05-08status Pending 115-char remark
-
2026-05-03$55,000 Active 115-char remark
ⓘ Source: listings_history table (triggers on properties + properties_extension) + one-shot
backfill from property_details.listing_events for pre-trigger history.
Tax reassessment forecast IN · Partial reset (capped growth)
- Current annual tax
- $2,279 · $190/mo
- Projected year-2 tax
- $2,279 · $190/mo
- Expected delta
- $0/yr ($0/mo · 0.0%)
ⓘ Screening estimate from a state-policy table — verify with the county assessor before closing.
Climate risk First Street
- Flood 1/10 Low FEMA zone X (unshaded) · 0% chance over 30 yrs
- Wildfire 1/10 Low
- Heat 2/10 Low 7 d/yr ≥101°F today · 16 d/yr by 30 yrs out
- Wind 2/10 Low
- Air quality 2/10 Low 1 unhealthy d/yr today · 1 by 30 yrs out
Nearby sold comps map
Loading sold comps map…
Walkable amenities ~0.75 mi
Loading nearby amenities…
Taxation est. · year 1
- Rental income
- $23,067
- − Mortgage interest
- −$3,081
- − Property taxes
- −$2,279
- − Insurance
- −$275
- − Repairs & maintenance
- −$1,845
- − Management
- −$1,845
- − Depreciation
- −$1,600
- Taxable income
- $12,141
- Est. tax owed @ 24.0%
- −$2,914
- After-tax cash flow
- $9,294/yr
For passive investors: Depreciation is non-cash, so a rental often shows a tax loss while cash-flowing — sheltering income. Rental losses are passive: they offset passive income freely, and up to $25,000/yr can offset ordinary (W-2) income if you actively participate and your MAGI is under $100k (phasing out to $0 by $150k); unused losses carry forward. On sale, claimed depreciation is recaptured at up to 25%, and gains may owe capital-gains tax (a 1031 exchange can defer both). Figures are a year-1 estimate at your 24.0% rate — not tax advice; consult a CPA.
Schools (NCES district)
- District
- Plymouth Community School Corporation
- NCES district ID
- 1809060
- Math proficiency
- 33% ▼ -10.00%
- Reading proficiency
- 41% ▼ -11.00%
- Median HH income
- $45,852
- Composite
- 31.58/100
- National rank
- #5949
- State rank
- #173 of 301 in IN
Livability — Plymouth
- Score
- 71/100
- State rank
- #142
- US rank
- #7282
Category grades
Schools grade is shown separately in the Schools card above.
Census & demographics
- Census place
- Plymouth, IN
- County
- Marshall County · 23,615 people
- City population
- 23,615
- Metro
- Plymouth, IN
- Population (ZIP)
- 23,615
- Household income
- $73,293
- Rent vs Own
- Severe rent burden
- 243.0
Population outlook (Marshall County) Hauer SSP2
- Today (2025)
- 46,402 people
- By 2030
- 45,775 · -1.4%
- By 2040
- 44,220 · -4.7%
- By 2050
- 42,329 · -8.8%
- By 2075
- 38,235 · -17.6%
- By 2100
- 33,285 · -28.3%
Race, ethnicity, and origin ACS 2023
- Neighborhood character
- Predominantly White (81%)
- Race & ethnicity
- White 81% Hispanic / Latino 16% Two or more races 4%
- Hispanic origin (detail)
- Mexican 10%
- Common ancestry
- Romanian 4% Iranian 2% Slovak 1%
- Foreign-born
- 7% · Canada
- Languages at home
- 87% English-only · Spanish 12% German/W. Germanic 1%
Political lean MEDSL · Marshall
- 2024 margin
- Solid R (+43.4) · D 27.4% · R 70.8% · Other 1.8%
- 2008→2024 swing
- -29.8pp toward R · 2008: -13.6pp · 2024: -43.4pp
- All cycles
- 2024: R+43.4 2020: R+40.8 2016: R+41.6 2012: R+28.9 2008: R+13.6
Not yet ingested
- Civics
- —
Market trends
- HPI YoY
- ▼ -94.52%
- Current HPI
- 247.1045
- Rent YoY
- —
- Metro
- Plymouth, IN
- State GDP YoY
- ▲ 2.90%
- F500 in state
- 18
Industry mix (Fortune 500 HQ in IN)
| Industry | F500 HQs | Revenue |
|---|---|---|
| Industrial Machinery | 2 | $37B |
|
||
| Healthcare | 1 | $177B |
|
||
| Pharmaceuticals | 1 | $45B |
|
||
| Metals / Steel | 1 | $18B |
|
||
| Agriculture | 1 | $17B |
|
||
| Packaging | 1 | $12B |
|
||
Price history
-14.7% since first listed3 events — show timeline
- 2026-06-02 Sold (MLS) $46,900 IRMLS
- 2026-05-08 Pending — IRMLS
- 2026-05-03 Listed $55,000 IRMLS
Property tax history
+1.3%/yrLatest (2025): $2,279 · +4.2% YoY. Source: county tax records.
Cash-flow waterfall
monthlySold comps — $/sqft
last 12 mo · ≤1 miLoading sold comps…