3502 Gardens East Dr Unit B · Palm Beach Gardens, FL
Flood risk 1/10 · Minimal
- FEMA flood zone
- X (unshaded)
- Chance of flooding over 30 yrs
- 0.0%
- Est. flood insurance / yr
- $507 – $1,088
Fire risk 1/10 · Minimal
- Est. fire insurance / yr
- $947 – $1,759
Heat risk 10/10 · Severe
- Hot days now (above 106°F)
- 7 days/yr
- Hot days in 30 yrs
- 25 days/yr
Wind risk 10/10 · Severe
- Chance of severe wind over 30 yrs
- 99.0%
Air-quality risk 2/10 · Minimal
- Unhealthy air days now
- 0 days/yr
- Unhealthy air days in 30 yrs
- 1 days/yr
Risk factors via First Street. Map © Google.
Why this score? — see what drove the D+ grade
The composite is a weighted blend of 9 inputs, each scored 0–100. Each bar is that input's sub-score; the figure is the points it added to the 100-point composite (weight × sub-score).
- Cash flow +19.5/30.0
- 1% rule +6.6/10.0
- DSCR +6.2/10.0
- Schools +4.3/10.0
- Livability +3.5/5.0
- Rent growth +3.1/5.0
- Condition / age +2.5/5.0
- ARV discount +0.0/15.0
- Appreciation +0.0/10.0
$310,000
🖨 Deal sheet 📄 Offer letter ✓ Due diligence
Listing remarks
Discover the hidden charm of Cedar Gardens — a quaint townhome community perfectly positioned in the heart of Palm Beach Gardens. Offering spacious floorplans, private outdoor spaces, and a peaceful neighborhood feel, Cedar Gardens combines comfort, convenience, and affordability in one of Palm Beach County's most sought-after locations. Residents enjoy easy access to upscale shopping, fine dining, beautiful beaches, championship golf, and top-rated schools, all just minutes away. With its central location near PGA Boulevard, I-95, and the Turnpike, Cedar Gardens provides the perfect balance of quiet residential living and everyday convenience. Whether you're searching for a primary r
Key facts
- Fine dining
- Beautiful beaches
- Townhome community
Tags
Property features AI
Finance
- Financial info: Pets allowed with restrictions (breed, number, size)
- HOA & community: Cedar Gardens community; Quarterly HOA fee; Community amenities include car wash area, parking, and maintained grounds; HOA covers water, sewer, common real estate tax, legal/accounting, and grounds maintenance
Exterior
- Parking: Assigned open parking (2 spaces)
- Utilities: Public water; Public sewer; Cable available; Electricity available; Water available; Sewer connected
- Home design: Townhouse; Two levels; Entry level living area; North-facing
- Construction: Concrete block with stucco construction; Mansard / tar and gravel / other roof
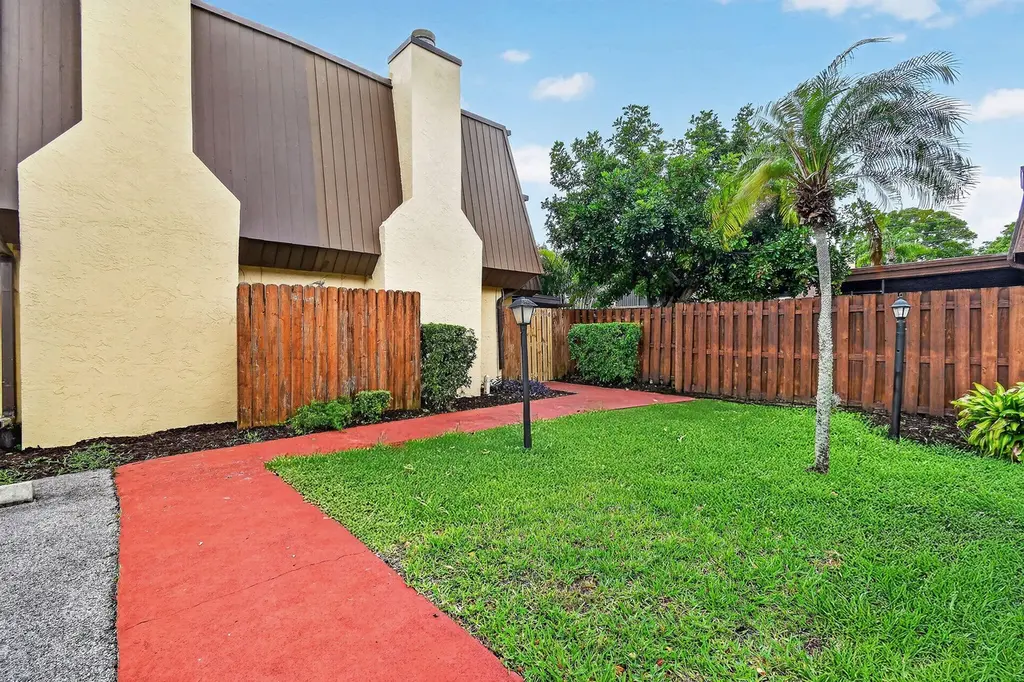
- Exterior features: Covered and screened patio; Patio; Fenced yard with gate; Not waterfront
Interior
- Kitchen: Dishwasher; Disposal; Refrigerator
- Bedrooms: No main-level bedrooms
- Flooring: Carpet; Tile
- Bathrooms: 1 full bathroom; 1 half bathroom
- Heating & cooling: Central heating; Central air; Ceiling fans
- Interior features: Walk-in closets; Wood-burning fireplace
- Laundry & utility: Washer/dryer hookups inside; Laundry chute; Electric water heater
Neighborhood map
What this means for you Summary
Snapshot
- This is a 2-bed/1.5-bath townhouse listed at $310k.
Deal economics
- At list price, monthly cash flow is $354 ($4k/yr) — positive.
- The deal already cash-flows at list — no discount required.
- Meets the 1% rule at list price ($4k rent vs $310k).
- Recommended offer: $305k (1.5% below list) — sets the bar for market timing.
Location & tenants
- Location reads 69/100 on livability (#464 in FL) — a middle-class / working-renter tenant base. Strengths: crime A+, employment A+, housing A+; Watch: amenities F, commute F, cost of living F.
- Palm Beach (suburban): math 46% / reading 53% proficiency, ranked #34 of 73 in FL (top 47%) — families likely to look elsewhere, expect single-tenant / working-renter base with shorter leases.
- Zoned schools: Allamanda Elementary School (math 52% / reading 58%, grade C, #872 of 2,144 statewide, top 42%, 630 students, 48% FRL); Howell L. Watkins Middle School (math 18% / reading 33%, grade F, #512 of 571 statewide, top 90%, 794 students, 76% FRL); Palm Beach Gardens High School (math 19% / reading 40%, grade F, #447 of 667 statewide, top 68%, 2,570 students, 61% FRL).
- Zoned-school proficiency averages 37% at this address vs 50% district-wide (-13 pts) — the specific schools serving this property underperform the Palm Beach average; the district grade overstates school quality for this exact location.
- Market conditions: Rents rising (+2.5%/yr); 303 active listings in the ZIP; 23 comparable units currently listed for rent nearby; rentals at typical pace (median 24d on market — plan ~3-4 weeks tenant-placement turnaround); solid renter incomes; 3,974 units permitted in Palm Beach County in 2024 (1,012 in 5+ unit buildings).
- At $3,586/mo this rent would consume 46% of the median local household income ($95k/yr) (locally 1429% of renters already pay >50% of income on rent) — very limited rent-growth headroom before tenants either downsize or default.
Forward outlook
- Local home prices are declining (-3.0%/yr); year-one equity from $2k of loan paydown is wiped out by about $9k of value loss. Plan a longer hold.
- Palm Beach County population projected at +30% by 2050 — long-run rental-demand tailwind backs the buy-and-hold thesis.
Negotiation context
- It's been on market 24 days — a 2% lower offer ($305k) is reasonable based on typical stale-listing flexibility.
- 7 sale attempts since 19y ago with the ask held roughly flat each time — persistent listings suggest the price (not the market) is what's stuck; bring a comps-based counter.
- Current owner paid $63k; list at $310k implies a 392% gain — meaningful room to come down on a strong offer.
Risks & watch-outs
- Climate carrying-cost: severe wind risk, 99% chance of damaging wind over 30y; extreme-heat days projected 7→25/yr by 2055 (HVAC capex compounding) — expect insurance premiums to compound above CPI over the hold.
Questions for the listing agent
- Built in 1978 — when were the roof, HVAC, electrical panel, plumbing, and water heater last replaced?
- What does the HOA fee cover, when was the last increase, and are there any pending special assessments or reserve-fund shortfalls?
- Is there a deadline driving the sale (1031 exchange, divorce, estate, relocation)? That informs how much negotiation room exists.
- Schools are B-rated — typically a magnet for longer-tenancy family renters. What's the average tenant stay here, and is there a school-zone premium baked into asking?
- The area grade is low — what's the realistic commute time and amenity access for the typical tenant pool here? Any planned neighborhood developments (good or bad) we should know about?
- What's the average days-on-market for RENTAL listings here right now (not sales)? A rising rental-DOM trend means longer vacancies and softer asking-rent achievability than the comps imply.
- What's the recent tenant-quality profile in this submarket — average credit score on applications, eviction rate, late-payment / NSF rate, and stable-employment percentage? A property-management company in the area should have these aggregated.
- How much new for-sale + rental construction is in the pipeline within 1–3 miles? Heavy new supply typically softens prices + rents 12–24 months out; constrained supply supports both.
Investment metrics
- 1% rule
- 1.16% ✓
- Cap rate
- 7.66%
- Cash-on-cash
- 4.89%
- DSCR
- 1.22
- GRM
- 7.2
CMA / ARV
- ARV (on-the-fly)
- $260,325
- Comps found
- 1
Show comp detail 1 sale within ~0.75 mi
| Address | Dist | Beds/Ba | Sqft | Sold | Price | $/sf | Match |
|---|---|---|---|---|---|---|---|
| 3404 E Gardens East Dr E Unit 25a | 0.12mi | 2/2.0 | 1,000 (-14%) | 18mo | $225,000 | $225 | 55 |
Match score weights: distance 35% · size 25% · config 20% · recency 20%. Top-matched comps best support the ARV.
Projected returns pro-forma
-3.0% appreciation · 2.49% rent growth · sell at horizon
- IRR
- -9.2%
- Equity multiple
- 0.66×
- Total profit
- $-29,257
- Equity at exit
- $46,222
- IRR
- -0.5%
- Equity multiple
- 0.97×
- Total profit
- $-2,821
- Equity at exit
- $26,803
Cash invested: $86,800 (down + closing). Projections, not guarantees.
Landlord ↔ Tenant lean methodology
- Overall (STATE)
- 87 Strongly Landlord-Friendly
- State Florida
- 87 Strongly Landlord-Friendly · R+3
- County
- — inherits STATE
- City
- — inherits STATE
ZIP-level market 33410
- Rents YoY
- 2.5%
- Active inventory
- 303
- Price-to-rent
- 7.2×
Monthly cashflow live
- Estimated rent
- $3,586 high interval (Pro) →
- Mortgage (P&I)
- −$1,626
- Tax from tax record
- −$299 /mo · $3,588/yr
- Insurance
- −$129
- HOA
- −$425
- Vacancy / Maint / Mgmt
- −$753
- Net cashflow
- $354
Break-even live
UW: 25.0% down · 7.5% · 30yr · 1.5% tax · 5.0% vac · 8.0% maint · 8.0% mgmt
Financing live
Cash to close
- Down payment
- $77,500
- Closing costs
- $9,300
- Reserves months
- —
- Total cash needed
- —
Loan-product check · same deal, 3 products live
Conventional
25% down · 7.5% · 30yr
- Down + closing
- —
- Monthly P&I
- —
- Monthly cashflow
- —
- DSCR
- —
- Eligible?
- —
Personal DTI + credit; lowest rate.
DSCR
20% down · 8.5% · 30yr
- Down + closing
- —
- Monthly P&I
- —
- Monthly cashflow
- —
- DSCR
- —
- Eligible?
- —
No personal income docs; deal must DSCR.
Hard money
10% down · 12.0% · 12mo
- Down + closing
- —
- Monthly P&I
- —
- Monthly cashflow
- —
- DSCR
- —
- Eligible?
- —
Short-term bridge; refi at stabilization.
Rent comps 23 comps
| Address | Beds | Baths | Sqft | Rent | $/sqft | DOM | Units | Dist |
|---|---|---|---|---|---|---|---|---|
| 2750 Rio Vista Blvd Palm Beach Gardens, FL | 1.0–2.0 | 1.0–2.0 | 925 | $2,999 | $3.24 | 2d | 27 | 0.10mi |
| 7102 Geminata Oak Ct Unit 7102 Palm Beach Gardens, FL | 2.0 | 2.0 | 1152 | $3,200 | $2.78 | 7d | 1 | 0.51mi |
| 10201 Chapman Oak Ct Palm Beach Gardens, FL | 2.0 | 2.0 | 1152 | $4,000 | $3.47 | 24d | 1 | 0.52mi |
| 3660 RCA Blvd Palm Beach Gardens, FL | 1.0–2.0 | 1.0–2.0 | 1524 | $6,849 | $4.49 | 1d | 30 | 0.64mi |
| 11011 Legacy Dr #306 Palm Beach Gardens, FL | 2.0 | 2.0 | 1403 | $4,350 | $3.10 | 24d | 1 | 0.70mi |
| 11024 Legacy Dr #104 Palm Beach Gardens, FL | 2.0 | 2.0 | 1345 | $6,000 | $4.46 | 24d | 1 | 0.76mi |
| 11028 Legacy Dr #203 Palm Beach Gardens, FL | 2.0 | 2.0 | 1309 | $4,000 | $3.06 | 24d | 1 | 0.78mi |
| 11023 Legacy Ln #204 Palm Beach Gardens, FL | 2.0 | 2.0 | 1309 | $3,500 | $2.67 | 24d | 1 | 0.85mi |
| 11021 Legacy Ln #303 Palm Beach Gardens, FL | 2.0 | 2.0 | 1403 | $2,950 | $2.10 | 24d | 1 | 0.88mi |
| 2539 Wabash Dr West Palm Beach, FL | 3.0 | 2.5 | 1468 | $5,500 | $3.75 | 24d | 1 | 0.92mi |
| 908 Lighthouse Dr North Palm Beach, FL | 3.0 | 2.0 | 1478 | $4,250 | $2.88 | 24d | 1 | 0.97mi |
| 913 Lighthouse Dr North Palm Beach, FL | 3.0 | 2.5 | 1092 | $5,900 | $5.40 | 24d | 1 | 1.00mi |
| 3955 Design Center Dr Palm Beach Gardens, FL | 3.0 | 1.0–2.0 | 996 | $3,514 | $3.53 | 1d | 25 | 1.02mi |
| 4120 Union Square Blvd Palm Beach Gardens, FL | 1.0–3.0 | 1.0–2.0 | 1035 | $2,632 | $2.54 | 1d | 92 | 1.03mi |
| 9446 Birmingham Dr Palm Beach Gardens, FL | 3.0 | 2.0 | 1092 | $3,250 | $2.98 | 4d | 1 | 1.09mi |
| 700 Sanctuary Cove Dr West Palm Beach, FL | 1.0–3.0 | 1.0–2.0 | 1120 | $2,602 | $2.32 | 1d | 55 | 1.12mi |
| 9507 Bellewood St Palm Beach Gardens, FL | 3.0 | 2.0 | 1200 | $5,000 | $4.17 | 19d | 1 | 1.17mi |
| 4295 Crestdale St Palm Beach Gardens, FL | 3.0 | 2.0 | 1366 | $4,500 | $3.29 | 24d | 1 | 1.26mi |
| 4292 Birdwood St Palm Beach Gardens, FL | 3.0 | 2.0 | 1232 | $3,800 | $3.08 | 24d | 1 | 1.32mi |
| 4358 Birdwood St Palm Beach Gardens, FL | 3.0 | 2.0 | 1232 | $5,000 | $4.06 | 24d | 1 | 1.36mi |
| 2545 Conroy Dr West Palm Beach, FL | 3.0 | 2.0 | 1066 | $3,295 | $3.09 | 24d | 1 | 1.42mi |
| 2396 Easy St Unit A Palm Beach Gardens, FL | 2.0 | 1.0 | 948 | $3,500 | $3.69 | 24d | 1 | 1.42mi |
| 9147 Reed Dr Unit A Palm Beach Gardens, FL | 3.0 | 2.0 | 1400 | $3,400 | $2.43 | 4d | 1 | 1.49mi |
HOA detail
- Monthly dues
- $425 · $5,100/yr
Listing history 32 events
-
2026-06-18days on market $310,000 Active 24 DOM
-
2026-06-17days on market $310,000 Active 23 DOM
-
2026-06-16days on market $310,000 Active 22 DOM
-
2026-06-15days on market $310,000 Active 21 DOM
-
2026-06-13days on market $310,000 Active 19 DOM
-
2026-06-09days on market $310,000 Active 15 DOM
-
2026-06-08days on market $310,000 Active 14 DOM
-
2026-06-07days on market $310,000 Active 13 DOM
-
2026-06-04days on market $310,000 Active 10 DOM
-
2026-06-03days on market $310,000 Active 9 DOM
-
2026-06-02days on market $310,000 Active 8 DOM
-
2026-06-01days on market $310,000 Active 7 DOM
-
2026-05-31days on market $310,000 Active 6 DOM
-
2026-05-24$310,000 Active
-
2026-04-18historical $2,375
-
2026-04-04price $2,375
-
2026-03-31$2,400
-
2026-03-31historical $2,500
-
2026-03-13$2,500
-
2026-03-13historical $2,500
-
2026-01-29price $2,500
-
2026-01-16price $2,600
-
2026-01-10$2,650
-
2026-01-10historical $2,650
-
2026-01-06$2,650
-
2008-07-31historical
-
2008-04-25$148,000
-
2008-01-31historical
-
2007-12-01$189,900
-
1998-08-17soldstatus $63,000
-
1996-04-05soldstatus $61,000
-
1989-04-21soldstatus $52,000
ⓘ Source: listings_history table (triggers on properties + properties_extension) + one-shot
backfill from property_details.listing_events for pre-trigger history.
Tax reassessment forecast FL · Resets to sale price
- Current annual tax
- $3,588 · $299/mo
- Projected year-2 tax
- $3,588 · $299/mo
- Expected delta
- $0/yr ($0/mo · 0.0%)
ⓘ Screening estimate from a state-policy table — verify with the county assessor before closing.
Climate risk First Street
- Flood 1/10 Low FEMA zone X (unshaded) · 0% chance over 30 yrs
- Wildfire 1/10 Low
- Heat 10/10 Extreme 7 d/yr ≥106°F today · 25 d/yr by 30 yrs out
- Wind 10/10 Extreme 99% chance of damaging wind over 30 yrs
- Air quality 2/10 Low 0 unhealthy d/yr today · 1 by 30 yrs out
Nearby sold comps map
Loading sold comps map…
Walkable amenities ~0.75 mi
Loading nearby amenities…
Taxation est. · year 1
- Rental income
- $43,030
- − Mortgage interest
- −$17,365
- − Property taxes
- −$3,588
- − Insurance
- −$1,550
- − Repairs & maintenance
- −$3,442
- − Management
- −$3,442
- − HOA
- −$5,100
- − Depreciation
- −$9,018
- Taxable loss
- −$475
- Est. tax savings @ 24.0%
- +$114
- After-tax cash flow
- $4,362/yr
For passive investors: Depreciation is non-cash, so a rental often shows a tax loss while cash-flowing — sheltering income. Rental losses are passive: they offset passive income freely, and up to $25,000/yr can offset ordinary (W-2) income if you actively participate and your MAGI is under $100k (phasing out to $0 by $150k); unused losses carry forward. On sale, claimed depreciation is recaptured at up to 25%, and gains may owe capital-gains tax (a 1031 exchange can defer both). Figures are a year-1 estimate at your 24.0% rate — not tax advice; consult a CPA.
Schools (NCES district)
- District
- Palm Beach
- NCES district ID
- 1201500
- Math proficiency
- 46% ▼ -16.00%
- Reading proficiency
- 53% ▼ -4.00%
- Median HH income
- $53,943
- Composite
- 42.72/100
- National rank
- #3160
- State rank
- #34 of 73 in FL
Livability — Palm Beach Gardens
- Score
- 69/100
- State rank
- #464
- US rank
- #8366
Category grades
Schools grade is shown separately in the Schools card above.
Census & demographics
- Census place
- Palm Beach Gardens, FL
- County
- Palm Beach County · 1,438,312 people
- City population
- 96,294
- Metro
- Miami-Fort Lauderdale-Pompano Beach, FL
- Population (ZIP)
- 36,759
- Household income
- $94,530
- Rent vs Own
- Severe rent burden
- 1429.0
Population outlook (Palm Beach County) Hauer SSP2
- Today (2025)
- 1,637,487 people
- By 2030
- 1,743,255 · +6.5%
- By 2040
- 1,948,712 · +19.0%
- By 2050
- 2,132,979 · +30.3%
- By 2075
- 2,530,027 · +54.5%
- By 2100
- 2,706,979 · +65.3%
Race, ethnicity, and origin ACS 2023
- Neighborhood character
- Predominantly White (70%)
- Race & ethnicity
- White 70% Hispanic / Latino 15% Two or more races 13% Black 5% Asian 4%
- Hispanic origin (detail)
- Mexican 2% Puerto Rican 2% Cuban 3%
- Common ancestry
- Romanian 4% Lithuanian 3% Slovak 2%
- Foreign-born
- 17% · Canada, Jamaica, Vietnam
- Languages at home
- 78% English-only · Spanish 13% French/Haitian/Cajun 3% Other Indo-European 2%
Political lean MEDSL · Palm Beach
- 2024 margin
- Toss-up / Even · D 50.0% · R 49.2%
- 2008→2024 swing
- -22.1pp toward R · 2008: 22.9pp · 2024: 0.8pp
- All cycles
- 2024: D+0.8 2020: D+12.8 2016: D+15.3 2012: D+17.0 2008: D+22.9
Not yet ingested
- Civics
- —
Market trends
- HPI YoY
- ▼ -346.12%
- Current HPI
- 375.5381
- Rent YoY
- ▲ 2.49%
- Metro
- Miami-Fort Lauderdale-Pompano Beach, FL
- State GDP YoY
- ▲ 3.28%
- F500 in state
- 36
Industry mix (Fortune 500 HQ in FL)
| Industry | F500 HQs | Revenue |
|---|---|---|
| Industrial Technology | 2 | $29B |
|
||
| Insurance | 2 | $17B |
|
||
| Retail | 1 | $60B |
|
||
| Technology Distribution | 1 | $58B |
|
||
| Homebuilding | 1 | $35B |
|
||
| Technology Manufacturing | 1 | $35B |
|
||
Price history
+496.2% since first listed19 events — show timeline
- 2026-05-24 Listed $310,000 Beaches MLS
- 2026-04-18 Rental Removed $2,375 RMLSFL
- 2026-04-04 Price Changed $2,375 RMLSFL
- 2026-03-31 Listed for Rent $2,400 RMLSFL
- 2026-03-31 Rental Removed $2,500 RMLSFL
- 2026-03-13 Listed for Rent $2,500 RMLSFL
- 2026-03-13 Rental Removed $2,500 GFLMLS
- 2026-01-29 Price Changed $2,500 GFLMLS
- 2026-01-16 Price Changed $2,600 GFLMLS
- 2026-01-10 Listed for Rent $2,650 GFLMLS
- 2026-01-10 Rental Removed $2,650 RMLSFL
- 2026-01-06 Listed for Rent $2,650 RMLSFL
- 2008-07-31 Listing Removed — Beaches MLS
- 2008-04-25 Listed $148,000 Beaches MLS
- 2008-01-31 Listing Removed — Beaches MLS
- 2007-12-01 Listed $189,900 Beaches MLS
- 1998-08-17 Sold (Public Records) $63,000 Public Records
- 1996-04-05 Sold (Public Records) $61,000 Public Records
- 1989-04-21 Sold (Public Records) $52,000 Public Records
Property tax history
+8.6%/yrLatest (2025): $3,588 · +2.9% YoY. Source: county tax records.
Cash-flow waterfall
monthlySold comps — $/sqft
last 12 mo · ≤1 miLoading sold comps…