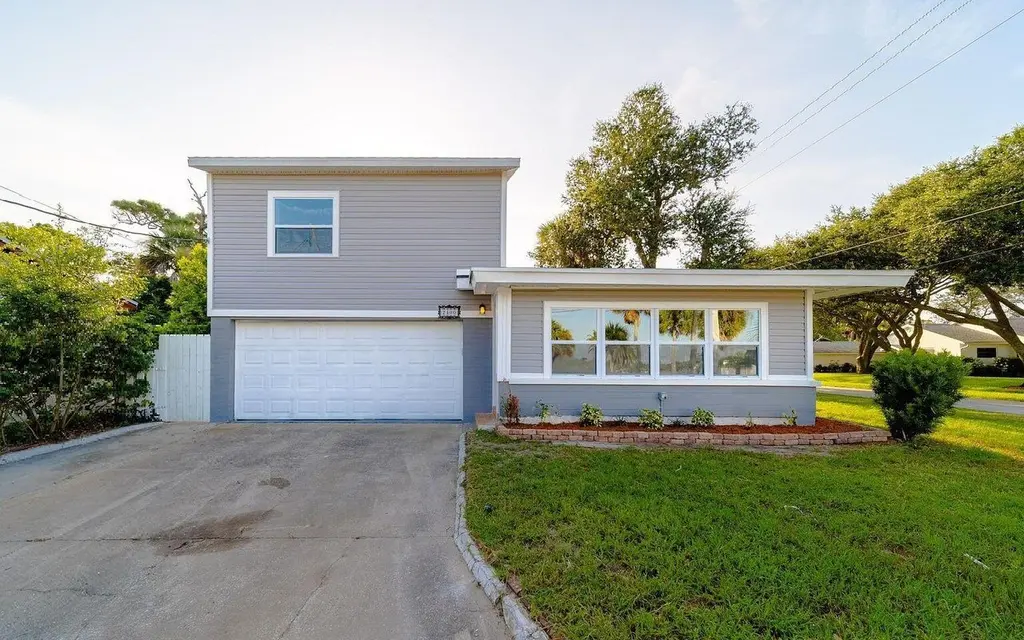
2400 N Halifax Ave · Daytona Beach, FL
Flood risk 4/10 · Minor
- FEMA flood zone
- X (unshaded)
- Chance of flooding over 30 yrs
- 0.17%
- Est. flood insurance / yr
- $507 – $1,088
Fire risk 1/10 · Minimal
- Est. fire insurance / yr
- $947 – $1,759
Heat risk 10/10 · Severe
- Hot days now (above 104°F)
- 7 days/yr
- Hot days in 30 yrs
- 20 days/yr
Wind risk 10/10 · Severe
- Chance of severe wind over 30 yrs
- 99.0%
Air-quality risk 2/10 · Minimal
- Unhealthy air days now
- 1 days/yr
- Unhealthy air days in 30 yrs
- 2 days/yr
Risk factors via First Street. Map © Google.
Why this score? — see what drove the D+ grade
The composite is a weighted blend of 9 inputs, each scored 0–100. Each bar is that input's sub-score; the figure is the points it added to the 100-point composite (weight × sub-score).
- Cash flow +15.0/30.0
- ARV discount +7.5/15.0
- 1% rule +5.0/10.0
- DSCR +5.0/10.0
- Livability +4.2/5.0
- Schools +3.9/10.0
- Condition / age +2.5/5.0
- Rent growth +2.4/5.0
- Appreciation +0.0/10.0
$5,000
🖨 Deal sheet 📄 Offer letter ✓ Due diligence
Listing remarks
Foreclosure Auction Ends June 12, 2026, at 11:00 AM EST. Explore this charming 3-bedroom, 1-bath residence set in a peaceful and well-located Daytona Beach community. The list price is the opening bid for the online auction. Sold As-is. Explore more details and submit your bid through Federa.
Key facts
- 2 garage spots
- Listed 5 days
Property features AI
Exterior
- Parking: Attached or detached 2-car garage
- Home design: Residential property; Single-story
- Exterior features: Lot approximately 0.18 acres; Zoned SFR-5
Interior
- Bathrooms: Three full bathrooms; One half bathroom
- Interior features: One-level living
Neighborhood map
What this means for you Summary
Snapshot
- This is a 4-bed/3.5-bath single-family listed at $5k.
Deal economics
- At list price, monthly cash flow is $2k ($29k/yr) — positive.
- The deal already cash-flows at list — no discount required.
- Meets the 1% rule at list price ($3k rent vs $5k).
Location & tenants
- Location reads 83/100 on livability (#46 in FL, #867 nationally) — a professional / high-income tenant draw. Strengths: amenities A+, commute A+, cost of living A+; Watch: schools D+, employment D-.
- Volusia (suburban): math 44% / reading 49% proficiency, ranked #47 of 73 in FL (top 64%) — families likely to look elsewhere, expect single-tenant / working-renter base with shorter leases.
- Market conditions: Rents soft (-0.2%/yr); 920 active listings in the ZIP; 7 comparable units currently listed for rent nearby; rentals at typical pace (median 23d on market — plan ~3-4 weeks tenant-placement turnaround); 3,402 units permitted in Volusia County in 2024 (681 in 5+ unit buildings).
- At $3,078/mo this rent would consume 60% of the median local household income ($61k/yr) (locally 937% of renters already pay >50% of income on rent) — very limited rent-growth headroom before tenants either downsize or default.
Forward outlook
- Local home prices are declining (-3.0%/yr); year-one equity from $35 of loan paydown is wiped out by about $150 of value loss. Plan a longer hold.
- Volusia County population projected at +19% by 2050 — long-run rental-demand tailwind backs the buy-and-hold thesis.
- At projected returns (-3.0% appreciation + 0.0% rent growth), your $1k cash investment doubles in ~1 year — after that, you're playing with house money.
Negotiation context
- Only 6 days on market — expect competitive offers; lowballing is unlikely to land.
- 16 sale attempts since 14y ago with the ask held roughly flat each time — persistent listings suggest the price (not the market) is what's stuck; bring a comps-based counter.
Risks & watch-outs
- Watch-outs: built in 1950 — expect roof / HVAC / electrical / plumbing capex.
- Climate carrying-cost: severe wind risk, 99% chance of damaging wind over 30y; extreme-heat days projected 7→20/yr by 2055 (HVAC capex compounding) — expect insurance premiums to compound above CPI over the hold.
Questions for the listing agent
- Built in 1950 — when were the roof, HVAC, electrical panel, plumbing, and water heater last replaced?
- Is there a deadline driving the sale (1031 exchange, divorce, estate, relocation)? That informs how much negotiation room exists.
- Schools are D-rated, which usually means shorter tenancies and higher turnover. Who's the typical renter profile here, and what's been the actual vacancy rate?
- The area grade is low — what's the realistic commute time and amenity access for the typical tenant pool here? Any planned neighborhood developments (good or bad) we should know about?
- What's the average days-on-market for RENTAL listings here right now (not sales)? A rising rental-DOM trend means longer vacancies and softer asking-rent achievability than the comps imply.
- What's the recent tenant-quality profile in this submarket — average credit score on applications, eviction rate, late-payment / NSF rate, and stable-employment percentage? A property-management company in the area should have these aggregated.
- How much new for-sale + rental construction is in the pipeline within 1–3 miles? Heavy new supply typically softens prices + rents 12–24 months out; constrained supply supports both.
Investment metrics
- 1% rule
- 61.56% ✓
- Cap rate
- 581.62%
- Cash-on-cash
- 2054.75%
- DSCR
- 92.42
- GRM
- 0.1
CMA / ARV
No comps found within radius.
Projected returns pro-forma
-3.0% appreciation · 0.0% rent growth · sell at horizon
- IRR
- —
- Equity multiple
- 103.07×
- Total profit
- $142,895
- Equity at exit
- $746
- IRR
- —
- Equity multiple
- 205.54×
- Total profit
- $286,356
- Equity at exit
- $432
Cash invested: $1,400 (down + closing). Projections, not guarantees.
Landlord ↔ Tenant lean methodology
- Overall (STATE)
- 87 Strongly Landlord-Friendly
- State Florida
- 87 Strongly Landlord-Friendly · R+3
- County
- — inherits STATE
- City
- — inherits STATE
ZIP-level market 32118
- Rents YoY
- -0.2%
- Active inventory
- 920
- Price-to-rent
- 0.1×
Monthly cashflow live
- Estimated rent
- $3,078 high interval (Pro) →
- Mortgage (P&I)
- −$26
- Tax est. 1.5%
- −$6 /mo · $75/yr
- Insurance
- −$2
- HOA
- −$0
- Vacancy / Maint / Mgmt
- −$646
- Net cashflow
- $2,397
Break-even live
UW: 25.0% down · 7.5% · 30yr · 1.5% tax · 5.0% vac · 8.0% maint · 8.0% mgmt
Financing live
Cash to close
- Down payment
- $1,250
- Closing costs
- $150
- Reserves months
- —
- Total cash needed
- —
Loan-product check · same deal, 3 products live
Conventional
25% down · 7.5% · 30yr
- Down + closing
- —
- Monthly P&I
- —
- Monthly cashflow
- —
- DSCR
- —
- Eligible?
- —
Personal DTI + credit; lowest rate.
DSCR
20% down · 8.5% · 30yr
- Down + closing
- —
- Monthly P&I
- —
- Monthly cashflow
- —
- DSCR
- —
- Eligible?
- —
No personal income docs; deal must DSCR.
Hard money
10% down · 12.0% · 12mo
- Down + closing
- —
- Monthly P&I
- —
- Monthly cashflow
- —
- DSCR
- —
- Eligible?
- —
Short-term bridge; refi at stabilization.
Rent comps 7 comps
| Address | Beds | Baths | Sqft | Rent | $/sqft | DOM | Units | Dist |
|---|---|---|---|---|---|---|---|---|
| 94 Ivanhoe Dr Ormond Beach, FL | 3.0 | 2.0 | 2074 | $4,500 | $2.17 | 23d | 1 | 0.53mi |
| 2300 N Atlantic Ave #502 Daytona Beach, FL | 3.0 | 2.0 | 2000 | $4,000 | $2.00 | 23d | 1 | 0.58mi |
| 217 Zelda Blvd Daytona Beach, FL | 4.0 | 2.0 | 2196 | $2,500 | $1.14 | 14d | 1 | 0.83mi |
| 733 Buena Vista Ave Ormond Beach, FL | 3.0 | 2.0 | 1485 | $2,400 | $1.62 | 23d | 1 | 1.02mi |
| 462 Magnolia St Ormond Beach, FL | 3.0 | 2.0 | 1502 | $2,100 | $1.40 | 14d | 1 | 1.29mi |
| 497 Grandview Ave Ormond Beach, FL | 3.0 | 2.0 | 1590 | $2,800 | $1.76 | 23d | 1 | 1.31mi |
| 1216 N Atlantic Ave Daytona Beach, FL | 1.0–3.0 | 1.0–2.0 | 1112 | $4,400 | $3.96 | 18d | 99 | 1.32mi |
Listing history 6 events
-
2026-06-10days on market $5,000 Active 6 DOM
-
2026-06-09days on market $5,000 Active 5 DOM
-
2026-06-08days on market $5,000 Active 4 DOM
-
2026-06-07days on market $5,000 Active 3 DOM
-
2026-06-05remarks 293-char remark
-
2026-06-05$5,000 Active 1 DOM
ⓘ Source: listings_history table (triggers on properties + properties_extension) + one-shot
backfill from property_details.listing_events for pre-trigger history.
Climate risk First Street
- Flood 4/10 Moderate FEMA zone X (unshaded) · 17% chance over 30 yrs
- Wildfire 1/10 Low
- Heat 10/10 Extreme 7 d/yr ≥104°F today · 20 d/yr by 30 yrs out
- Wind 10/10 Extreme 99% chance of damaging wind over 30 yrs
- Air quality 2/10 Low 1 unhealthy d/yr today · 2 by 30 yrs out
Nearby sold comps map
Loading sold comps map…
Walkable amenities ~0.75 mi
Loading nearby amenities…
Taxation est. · year 1
- Rental income
- $36,938
- − Mortgage interest
- −$280
- − Property taxes
- −$75
- − Insurance
- −$25
- − Repairs & maintenance
- −$2,955
- − Management
- −$2,955
- − Depreciation
- −$145
- Taxable income
- $30,503
- Est. tax owed @ 24.0%
- −$7,321
- After-tax cash flow
- $21,446/yr
For passive investors: Depreciation is non-cash, so a rental often shows a tax loss while cash-flowing — sheltering income. Rental losses are passive: they offset passive income freely, and up to $25,000/yr can offset ordinary (W-2) income if you actively participate and your MAGI is under $100k (phasing out to $0 by $150k); unused losses carry forward. On sale, claimed depreciation is recaptured at up to 25%, and gains may owe capital-gains tax (a 1031 exchange can defer both). Figures are a year-1 estimate at your 24.0% rate — not tax advice; consult a CPA.
Schools (NCES district)
- District
- Volusia
- NCES district ID
- 1201920
- Math proficiency
- 44% ▼ -9.00%
- Reading proficiency
- 49% ▼ -3.00%
- Median HH income
- $42,946
- Composite
- 39.2/100
- National rank
- #4019
- State rank
- #47 of 73 in FL
Livability — Daytona Beach
- Score
- 83/100
- State rank
- #46
- US rank
- #867
Category grades
Schools grade is shown separately in the Schools card above.
Census & demographics
- Census place
- Daytona Beach, FL
- County
- Volusia County · 556,871 people
- City population
- 67,539
- Metro
- Deltona-Daytona Beach-Ormond Beach, FL
- Population (ZIP)
- 18,383
- Household income
- $61,266
- Rent vs Own
- Severe rent burden
- 937.0
Population outlook (Volusia County) Hauer SSP2
- Today (2025)
- 572,749 people
- By 2030
- 598,695 · +4.5%
- By 2040
- 644,880 · +12.6%
- By 2050
- 681,451 · +19.0%
- By 2075
- 759,957 · +32.7%
- By 2100
- 778,902 · +36.0%
Race, ethnicity, and origin ACS 2023
- Neighborhood character
- Predominantly White (81%)
- Race & ethnicity
- White 81% Two or more races 7% Hispanic / Latino 7% Black 4% Asian 2%
- Hispanic origin (detail)
- Mexican 1% Puerto Rican 2%
- Common ancestry
- Romanian 3% Lithuanian 3% Slovak 2%
- Foreign-born
- 12% · Canada, Vietnam, Dominican Republic
- Languages at home
- 85% English-only · Spanish 5% Other Indo-European 3% Russian/Polish/Slavic 2%
Political lean MEDSL · Volusia
- 2024 margin
- Strong R (+21.8) · D 38.7% · R 60.5%
- 2008→2024 swing
- -27.4pp toward R · 2008: 5.7pp · 2024: -21.8pp
- All cycles
- 2024: R+21.8 2020: R+14.1 2016: R+13.1 2012: R+1.2 2008: D+5.7
Not yet ingested
- Civics
- —
Market trends
- HPI YoY
- ▼ -534.90%
- Current HPI
- 262.3757
- Rent YoY
- ▼ -0.21%
- Metro
- Deltona-Daytona Beach-Ormond Beach, FL
- State GDP YoY
- ▲ 3.28%
- F500 in state
- 36
Industry mix (Fortune 500 HQ in FL)
| Industry | F500 HQs | Revenue |
|---|---|---|
| Industrial Technology | 2 | $29B |
|
||
| Insurance | 2 | $17B |
|
||
| Retail | 1 | $60B |
|
||
| Technology Distribution | 1 | $58B |
|
||
| Homebuilding | 1 | $35B |
|
||
| Technology Manufacturing | 1 | $35B |
|
||
Price history
-83.3% since first listed51 events — show timeline
- 2026-06-04 Listed $5,000 NFMLS
- 2025-01-30 Pending — Daytona MLS
- 2025-01-24 Relisted — Daytona MLS
- 2025-01-22 Pending — Daytona MLS
- 2024-09-19 Price Changed $369,000 Daytona MLS
- 2024-08-20 Relisted — Daytona MLS
- 2024-07-01 Listing Removed — Daytona MLS
- 2024-07-01 Listing Removed — Daytona MLS
- 2024-06-28 Listed $380,000 Daytona MLS
- 2024-06-05 Listing Removed — Stellar MLS as Distributed by MLS Grid
- 2024-05-24 Price Changed $419,000 SCMLS
- 2024-05-24 Price Changed $419,000 Stellar MLS as Distributed by MLS Grid
- 2024-04-30 Price Changed $423,000 Stellar MLS as Distributed by MLS Grid
- 2024-04-30 Price Changed $423,000 SCMLS
- 2024-04-22 Price Changed $425,000 Stellar MLS as Distributed by MLS Grid
- 2024-04-22 Price Changed $425,000 SCMLS
- 2024-04-10 Price Changed $427,000 SCMLS
- 2024-04-09 Price Changed $427,000 Stellar MLS as Distributed by MLS Grid
- 2023-12-14 Relisted — Stellar MLS as Distributed by MLS Grid
- 2023-12-14 Relisted — SCMLS
- 2023-11-06 Pending — Stellar MLS as Distributed by MLS Grid
- 2023-11-06 Pending — SCMLS
- 2023-11-06 Listing Removed — SCMLS
- 2023-10-26 Listed $429,000 SCMLS
- 2023-10-26 Listed $429,000 Stellar MLS as Distributed by MLS Grid
- 2021-08-06 Listing Removed — Stellar MLS as Distributed by MLS Grid
- 2021-06-22 Relisted — Stellar MLS as Distributed by MLS Grid
- 2021-06-22 Price Changed $359,900 Stellar MLS as Distributed by MLS Grid
- 2021-05-20 Pending — Stellar MLS as Distributed by MLS Grid
- 2021-05-10 Relisted — Stellar MLS as Distributed by MLS Grid
- 2021-05-08 Listing Removed — Daytona MLS
- 2021-04-19 Listed $360,000 Stellar MLS as Distributed by MLS Grid
- 2021-03-26 Price Changed $379,932 Daytona MLS
- 2021-02-26 Relisted — Daytona MLS
- 2021-02-19 Contingent — Daytona MLS
- 2021-01-18 Price Changed $384,932 Daytona MLS
- 2020-12-21 Price Changed $389,932 Daytona MLS
- 2020-12-10 Price Changed $394,932 Daytona MLS
- 2020-11-17 Listed $399,932 Daytona MLS
- 2020-11-04 Listing Removed — Daytona MLS
- 2020-11-04 Listing Removed — Stellar MLS as Distributed by MLS Grid
- 2020-08-13 Price Changed $399,932 Stellar MLS as Distributed by MLS Grid
- 2020-08-13 Price Changed $399,932 Daytona MLS
- 2020-07-21 Listed $409,932 Stellar MLS as Distributed by MLS Grid
- 2020-07-17 Listed $409,932 Daytona MLS
- 2018-09-17 Sold (Public Records) $194,000 Public Records
- 2018-09-17 Sold (Public Records) $142,000 Public Records
- 2012-12-03 Sold (Public Records) $145,000 Public Records
- 2012-11-30 Sold (MLS) $145,000 Daytona MLS
- 2012-04-24 Listed $149,900 Daytona MLS
- 1972-03-01 Sold (Public Records) $30,000 Public Records
Property tax history
+8.0%/yrLatest (2025): $7,289 · -0.7% YoY. Source: county tax records.
Cash-flow waterfall
monthlySold comps — $/sqft
last 12 mo · ≤1 miLoading sold comps…