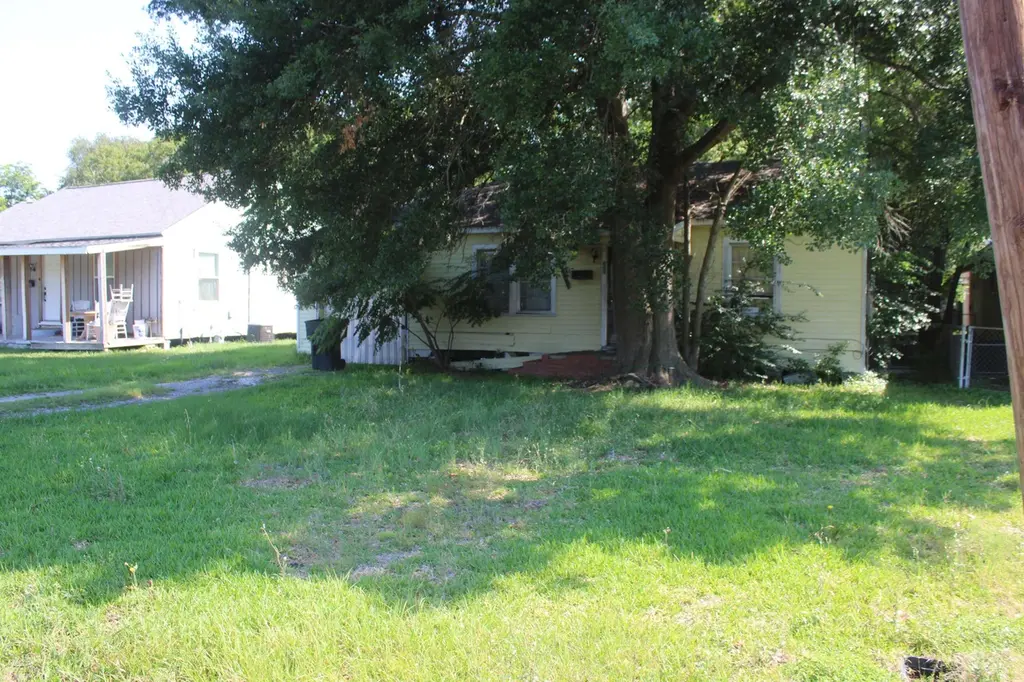
322 Hill Terrace Dr · Nederland, TX
Flood risk 7/10 · Major
- FEMA flood zone
- X
- Chance of flooding over 30 yrs
- 0.6%
- Est. flood insurance / yr
- $507 – $1,088
Fire risk 4/10 · Minor
- Est. fire insurance / yr
- $1,222 – $2,270
Heat risk 9/10 · Severe
- Hot days now (above 110°F)
- 7 days/yr
- Hot days in 30 yrs
- 24 days/yr
Wind risk 9/10 · Severe
- Chance of severe wind over 30 yrs
- 99.0%
Air-quality risk 2/10 · Minimal
- Unhealthy air days now
- 1 days/yr
- Unhealthy air days in 30 yrs
- 1 days/yr
Risk factors via First Street. Map © Google.
Why this score? — see what drove the B grade
The composite is a weighted blend of 9 inputs, each scored 0–100. Each bar is that input's sub-score; the figure is the points it added to the 100-point composite (weight × sub-score).
- Cash flow +30.0/30.0
- 1% rule +10.0/10.0
- DSCR +10.0/10.0
- ARV discount +7.5/15.0
- Rent growth +4.8/5.0
- Schools +4.5/10.0
- Livability +3.8/5.0
- Condition / age +2.5/5.0
- Appreciation +0.0/10.0
$64,900
🖨 Deal sheet 📄 Offer letter ✓ Due diligence
Listing remarks
BACK ON THE MARKET!! INVESTOR SPECIAL! PRIME PROPERTY! Located 2 blocks from Central Mall. Large lot to create your vision! Won't last long! AS IS so bring your offers! Appointment required to enter property!
Key facts
- Large lot
- Garage
- Listed 28 days
Tags
Property features AI
Exterior
- Parking: Attached garage (1 car)
- Utilities: Public water; Public sewer
- Home design: Single-family residential property
- Construction: Vinyl siding construction; Composition roof
- Exterior features: Composition roof; Vinyl siding; Subdivision: Hillcrest; Directions: Hwy. 365 to Hill Terrace Drive; house is on the right
Interior
- Bathrooms: 1 full bathroom
- Heating & cooling: Central air conditioning
- Interior features: Refrigerator included
Neighborhood map
What this means for you Summary
Snapshot
- This is a 2-bed/1.0-bath single-family listed at $65k.
Deal economics
- At list price, monthly cash flow is $428 ($5k/yr) — positive.
- The deal already cash-flows at list — no discount required.
- Meets the 1% rule at list price ($1k rent vs $65k).
- Recommended offer: $64k (1.5% below list) — sets the bar for market timing.
- Cap rate 15.4% vs local median 4.6% in Nederland — top-decile yield for the area; either an underpriced asset or a hidden risk that comps aren't pricing in. Stress-test before assuming the spread holds.
Location & tenants
- Location reads 75/100 on livability (#129 in TX, #3,906 nationally) — a middle-class / working-renter tenant base. Strengths: employment A+, cost of living A+, housing A+; Watch: amenities F, commute F.
- Nederland ISD (suburban): math 51% / reading 52% proficiency, ranked #138 of 826 in TX (top 17%) — acceptable for families but not a draw, mixed tenant base, ~2y average lease.
- Market conditions: Rents rising fast (+9.3%/yr); 111 active listings in the ZIP; 18 comparable units currently listed for rent nearby; rentals at typical pace (median 23d on market — plan ~3-4 weeks tenant-placement turnaround); solid renter incomes; 343 units permitted in Jefferson County in 2024 (0 in 5+ unit buildings).
Forward outlook
- Local home prices are declining (-3.0%/yr); year-one equity from $449 of loan paydown is wiped out by about $2k of value loss. Plan a longer hold.
- At projected returns (-3.0% appreciation + 8.0% rent growth), your $18k cash investment doubles in ~4 years — after that, you're playing with house money.
Negotiation context
- It's been on market 28 days — a 2% lower offer ($64k) is reasonable based on typical stale-listing flexibility.
- 2 sale attempts with the ask held roughly flat each time — persistent listings suggest the price (not the market) is what's stuck; bring a comps-based counter.
Risks & watch-outs
- Watch-outs: property tax is 3.2% of price; flood insurance adds $66/mo.
- Climate carrying-cost: major flood risk; severe wind risk, 99% chance of damaging wind over 30y; extreme-heat days projected 7→24/yr by 2055 (HVAC capex compounding) — expect insurance premiums to compound above CPI over the hold.
Questions for the listing agent
- Built in 1968 — when were the roof, HVAC, electrical panel, plumbing, and water heater last replaced?
- Property tax is high relative to price — has the assessment been appealed recently, and will the sale trigger a re-assessment?
- What's the actual annual flood-insurance premium (NFIP or private), and is the property in a SFHA with mandatory coverage?
- Is there a deadline driving the sale (1031 exchange, divorce, estate, relocation)? That informs how much negotiation room exists.
- Schools are A-rated — typically a magnet for longer-tenancy family renters. What's the average tenant stay here, and is there a school-zone premium baked into asking?
- What's the average days-on-market for RENTAL listings here right now (not sales)? A rising rental-DOM trend means longer vacancies and softer asking-rent achievability than the comps imply.
- What's the recent tenant-quality profile in this submarket — average credit score on applications, eviction rate, late-payment / NSF rate, and stable-employment percentage? A property-management company in the area should have these aggregated.
- How much new for-sale + rental construction is in the pipeline within 1–3 miles? Heavy new supply typically softens prices + rents 12–24 months out; constrained supply supports both.
Investment metrics
- 1% rule
- 2.02% ✓
- Cap rate
- 15.44%
- Cash-on-cash
- 32.66%
- DSCR
- 2.45
- GRM
- 4.1
CMA / ARV
- ARV (median comp)
- $152,443
- List price
- $64,900
- Delta
- -57.43%
- Verdict
- UNDERPRICED
- Comps
- 3 within 1.0 mi
Projected returns pro-forma
-3.0% appreciation · 8.0% rent growth · sell at horizon
- IRR
- 29.1%
- Equity multiple
- 2.31×
- Total profit
- $23,787
- Equity at exit
- $9,677
- IRR
- 39.7%
- Equity multiple
- 5.83×
- Total profit
- $87,794
- Equity at exit
- $5,611
Cash invested: $18,172 (down + closing). Projections, not guarantees.
Landlord ↔ Tenant lean methodology
- Overall (STATE)
- 87 Strongly Landlord-Friendly
- State Texas
- 87 Strongly Landlord-Friendly · R+5
- County
- — inherits STATE
- City
- — inherits STATE
ZIP-level market 77627
- Rents YoY
- 9.3%
- Active inventory
- 111
- Price-to-rent
- 4.1×
Monthly cashflow live
- Estimated rent
- $1,309 high interval (Pro) →
- Mortgage (P&I)
- −$340
- Tax from tax record
- −$173 /mo · $2,071/yr
- Insurance
- −$27
- Flood insurance flood zone
- −$66 /mo · $798/yr
- HOA
- −$0
- Vacancy / Maint / Mgmt
- −$275
- Net cashflow
- $428
Break-even live
UW: 25.0% down · 7.5% · 30yr · 1.5% tax · 5.0% vac · 8.0% maint · 8.0% mgmt
Financing live
Cash to close
- Down payment
- $16,225
- Closing costs
- $1,947
- Reserves months
- —
- Total cash needed
- —
Loan-product check · same deal, 3 products live
Conventional
25% down · 7.5% · 30yr
- Down + closing
- —
- Monthly P&I
- —
- Monthly cashflow
- —
- DSCR
- —
- Eligible?
- —
Personal DTI + credit; lowest rate.
DSCR
20% down · 8.5% · 30yr
- Down + closing
- —
- Monthly P&I
- —
- Monthly cashflow
- —
- DSCR
- —
- Eligible?
- —
No personal income docs; deal must DSCR.
Hard money
10% down · 12.0% · 12mo
- Down + closing
- —
- Monthly P&I
- —
- Monthly cashflow
- —
- DSCR
- —
- Eligible?
- —
Short-term bridge; refi at stabilization.
Rent comps 18 comps
| Address | Beds | Baths | Sqft | Rent | $/sqft | DOM | Units | Dist |
|---|---|---|---|---|---|---|---|---|
| 1212 S 36th St Nederland, TX | 3.0 | 1.0 | 1000 | $1,650 | $1.65 | 13d | 1 | 0.23mi |
| 531 S 28th St Unit B Nederland, TX | 1.0 | 1.0 | 660 | $750 | $1.14 | 23d | 1 | 0.62mi |
| 531 S 28th St Unit B Nederland, TX | 1.0 | 1.0 | 600 | $750 | $1.25 | 13d | 1 | 0.62mi |
| 303 Hardy Ave Unit 3 Nederland, TX | 1.0 | 1.0 | 700 | $850 | $1.21 | 43d | 1 | 0.65mi |
| 8849 Pinewood Dr Port Arthur, TX | 1.0–3.0 | 1.0–2.0 | 990 | $1,830 | $1.85 | 13d | 1 | 0.67mi |
| 224 S 35th St Nederland, TX | 3.0 | 1.0 | 1000 | $1,600 | $1.60 | 23d | 1 | 0.70mi |
| 2561 95th St Port Arthur, TX | 1.0 | 1.0 | 579 | $985 | $1.70 | 13d | 1 | 0.73mi |
| 2555 95th St Port Arthur, TX | 1.0–2.0 | 1.0–2.0 | 831 | $1,490 | $1.79 | 13d | 61 | 0.77mi |
| 2604 Avenue C Unit C Nederland, TX | 3.0 | 2.0 | 1008 | $1,795 | $1.78 | 43d | 1 | 0.78mi |
| 1924 Avenue H Unit H Nederland, TX | 2.0 | 1.0 | 900 | $1,000 | $1.11 | 43d | 1 | 0.89mi |
| 1619 Avenue G Unit G Nederland, TX | 3.0 | 1.5 | 1100 | $1,750 | $1.59 | 23d | 1 | 1.02mi |
| 7901 Heatherbrook Trl Unit 190 Port Arthur, TX | 2.0 | 1.0 | 988 | $1,425 | $1.44 | 21d | 1 | 1.12mi |
| 7901 Heatherbrook Trl Apt 3 Port Arthur, TX | 1.0 | 1.0 | 812 | $1,325 | $1.63 | 43d | 1 | 1.12mi |
| 7901 Heatherbrook Trl Unit 57 Port Arthur, TX | 2.0 | 1.0 | 988 | $1,425 | $1.44 | 13d | 1 | 1.13mi |
| 209 N 22nd St Unit 1 Nederland, TX | 2.0 | 1.0 | 900 | $1,100 | $1.22 | 43d | 1 | 1.13mi |
| 3527 Helena Ave Nederland, TX | 2.0 | 2.5 | 1088 | $1,200 | $1.10 | 43d | 1 | 1.29mi |
| 2901 Helena Ave Nederland, TX | 1.0 | 1.0 | 720 | $850 | $1.18 | 13d | 1 | 1.29mi |
| 3035 Lake Arthur Dr Port Arthur, TX | 1.0–2.0 | 1.0–2.0 | 901 | $1,917 | $2.13 | 13d | 22 | 1.47mi |
Listing history 17 events
-
2026-06-18days on market $64,900 Active 28 DOM
-
2026-06-17days on market $64,900 Active 27 DOM
-
2026-06-16days on market $64,900 Active 26 DOM
-
2026-06-15days on market $64,900 Active 25 DOM
-
2026-06-14days on market $64,900 Active 23 DOM
-
2026-06-13days on market $64,900 Active 22 DOM
-
2026-06-10days on market $64,900 Active 20 DOM
-
2026-06-09days on market $64,900 Active 19 DOM
-
2026-06-08days on market $64,900 Active 18 DOM
-
2026-06-07days on market $64,900 Active 17 DOM
-
2026-06-05days on market $64,900 Active 14 DOM
-
2026-06-03days on market $64,900 Active 13 DOM
-
2026-06-02days on market $64,900 Active 12 DOM
-
2026-06-01days on market $64,900 Active 11 DOM
-
2026-05-31days on market $64,900 Active 10 DOM
-
2026-05-30days on market $64,900 Active 9 DOM
-
2026-05-14$64,900 Active 192-char remark
ⓘ Source: listings_history table (triggers on properties + properties_extension) + one-shot
backfill from property_details.listing_events for pre-trigger history.
Tax reassessment forecast TX · Resets to sale price
- Current annual tax
- $2,071 · $173/mo
- Projected year-2 tax
- $2,071 · $173/mo
- Expected delta
- $0/yr ($0/mo · 0.0%)
ⓘ Screening estimate from a state-policy table — verify with the county assessor before closing.
Climate risk First Street
- Flood 7/10 Severe FEMA zone X · 60% chance over 30 yrs
- Wildfire 4/10 Moderate
- Heat 9/10 Extreme 7 d/yr ≥110°F today · 24 d/yr by 30 yrs out
- Wind 9/10 Extreme 99% chance of damaging wind over 30 yrs
- Air quality 2/10 Low 1 unhealthy d/yr today · 1 by 30 yrs out
Nearby sold comps map
Loading sold comps map…
Walkable amenities ~0.75 mi
Loading nearby amenities…
Taxation est. · year 1
- Rental income
- $15,714
- − Mortgage interest
- −$3,635
- − Property taxes
- −$2,071
- − Insurance
- −$1,122
- − Repairs & maintenance
- −$1,257
- − Management
- −$1,257
- − Depreciation
- −$1,888
- Taxable income
- $4,484
- Est. tax owed @ 24.0%
- −$1,076
- After-tax cash flow
- $4,061/yr
For passive investors: Depreciation is non-cash, so a rental often shows a tax loss while cash-flowing — sheltering income. Rental losses are passive: they offset passive income freely, and up to $25,000/yr can offset ordinary (W-2) income if you actively participate and your MAGI is under $100k (phasing out to $0 by $150k); unused losses carry forward. On sale, claimed depreciation is recaptured at up to 25%, and gains may owe capital-gains tax (a 1031 exchange can defer both). Figures are a year-1 estimate at your 24.0% rate — not tax advice; consult a CPA.
Schools (NCES district)
- District
- Nederland ISD
- NCES district ID
- 4832280
- Math proficiency
- 51% ▼ -3.00%
- Reading proficiency
- 52% ▼ -3.00%
- Median HH income
- $59,647
- Composite
- 44.95/100
- National rank
- #2709
- State rank
- #138 of 826 in TX
Livability — Nederland
- Score
- 75/100
- State rank
- #129
- US rank
- #3906
Category grades
Schools grade is shown separately in the Schools card above.
Census & demographics
- Census place
- Nederland, TX
- County
- Jefferson County · 203,592 people
- City population
- 22,357
- Metro
- Beaumont-Port Arthur, TX
- Population (ZIP)
- 22,357
- Household income
- $78,001
- Rent vs Own
- Severe rent burden
- 572.0
Population outlook (Jefferson County) Hauer SSP2
- Today (2025)
- 259,015 people
- By 2030
- 260,685 · +0.6%
- By 2040
- 263,309 · +1.7%
- By 2050
- 265,237 · +2.4%
- By 2075
- 270,193 · +4.3%
- By 2100
- 255,628 · -1.3%
Race, ethnicity, and origin ACS 2023
- Neighborhood character
- Predominantly White (78%)
- Race & ethnicity
- White 78% Hispanic / Latino 12% Two or more races 8% Black 4% Asian 3%
- Hispanic origin (detail)
- Mexican 8%
- Common ancestry
- Lithuanian 10% Slovak 3% Italian 2%
- Foreign-born
- 5% · Canada, Vietnam
- Languages at home
- 87% English-only · Spanish 8% Other Indo-European 1% Vietnamese 1%
Political lean MEDSL · Jefferson
- 2024 margin
- Lean R (+8.9) · D 45.1% · R 54.0%
- 2008→2024 swing
- -11.1pp toward R · 2008: 2.2pp · 2024: -8.9pp
- All cycles
- 2024: R+8.9 2020: R+1.6 2016: R+0.5 2012: D+1.6 2008: D+2.2
Not yet ingested
- Civics
- —
Market trends
- HPI YoY
- ▼ -228.91%
- Current HPI
- 176.2132
- Rent YoY
- ▲ 9.27%
- Metro
- Beaumont-Port Arthur, TX
- State GDP YoY
- ▲ 3.95%
- F500 in state
- 110
Industry mix (Fortune 500 HQ in TX)
| Industry | F500 HQs | Revenue |
|---|---|---|
| Energy | 16 | $1,198B |
|
||
| Technology | 5 | $198B |
|
||
| Engineering / Construction | 4 | $72B |
|
||
| Energy Services | 3 | $60B |
|
||
| Utilities | 3 | $41B |
|
||
| Healthcare | 2 | $330B |
|
||
Price history
3 events — show timeline
- 2026-05-28 Relisted — BBOR
- 2026-05-21 Pending — BBOR
- 2026-05-14 Listed $64,900 BBOR
Property tax history
+5.2%/yrLatest (2025): $2,071 · +20.1% YoY. Source: county tax records.
Cash-flow waterfall
monthlySold comps — $/sqft
last 12 mo · ≤1 miLoading sold comps…