 Duplex
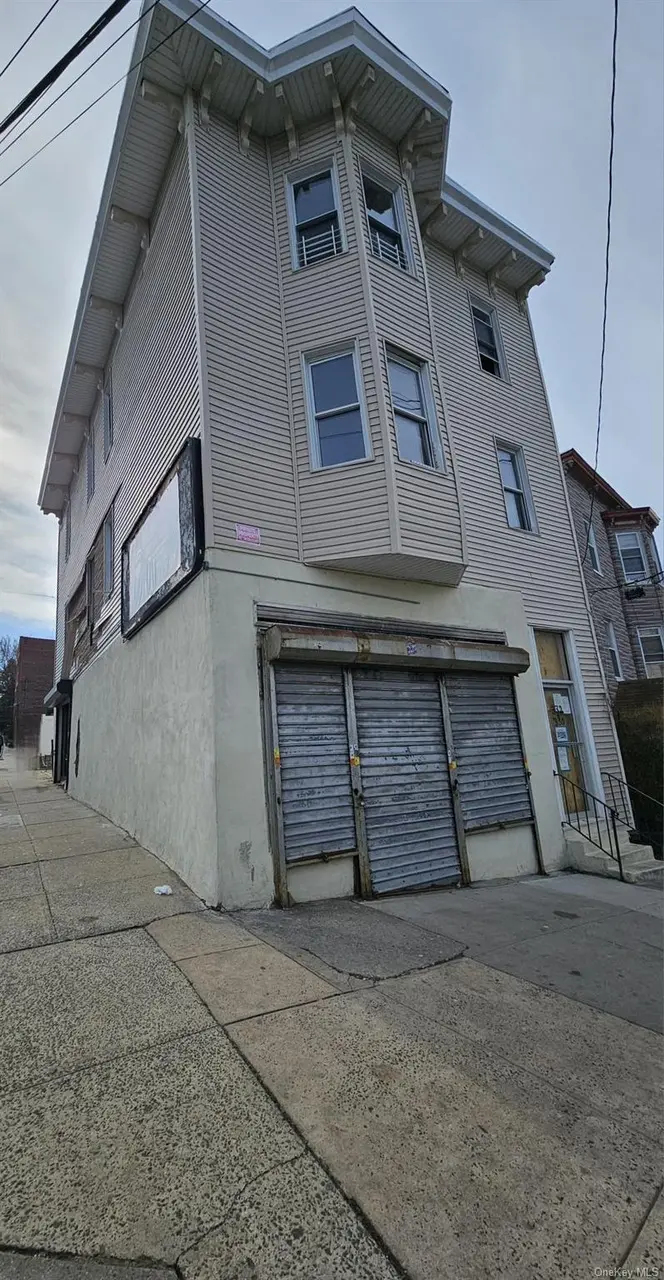
332 Walnut St · Yonkers, NY
Flood risk No data
- FEMA flood zone
- —
- Chance of flooding over 30 yrs
- —
- Est. flood insurance / yr
- —
Fire risk No data
- Est. fire insurance / yr
- —
Heat risk No data
- Hot days now (above threshold)
- —
- Hot days in 30 yrs
- —
Wind risk No data
- Chance of severe wind over 30 yrs
- —
Air-quality risk No data
- Unhealthy air days now
- —
- Unhealthy air days in 30 yrs
- —
Risk factors via First Street. Map © Google.
Why this score? — see what drove the B- grade
The composite is a weighted blend of 9 inputs, each scored 0–100. Each bar is that input's sub-score; the figure is the points it added to the 100-point composite (weight × sub-score).
- Cash flow +30.0/30.0
- DSCR +10.0/10.0
- 1% rule +8.8/10.0
- ARV discount +7.5/15.0
- Schools +4.1/10.0
- Rent growth +3.6/5.0
- Livability +3.4/5.0
- Condition / age +2.5/5.0
- Appreciation +0.0/10.0
$499,999
🖨 Deal sheet 📄 Offer letter ✓ Due diligence
Multi-family units
County records classify this as Multi-Family (2-4 Unit). Listing-text estimate: 2 units. confirmed
Listing remarks MLS
Mixed Use Multi Family Building with Income producing fully operational Laundromat. Both units renting under market value! Two off street parking spaces included. Seller supplies heat for the building. Tenants pay their own electric & cooking gas. Separate water, gas and electric meters for business***CASH OFFERS ONLY***Property needs Work. Sold As Is.
Key facts
- 1,742 sq ft lot
- 2 parking spots
- Built 1935
Property features AI
Finance
- Financial info: Tax year 2025
Exterior
- Parking: Two parking spaces; Attached parking; On-street parking; Parking lot; Private parking
- Security: Other security features
- Utilities: Con-Edison electric; Public sewer; Cable available; Electricity available; Natural gas available; Phone available; Sewer available; Trash collection (public); Water available; See remarks for additional utility details
- Home design: Triplex; Property condition: Fixer
- Construction: Frame construction; Concrete perimeter foundation
- Exterior features: Other exterior features; Corner lot; Level lot; Back yard fencing (partial vinyl); Shed(s)
Interior
- Bedrooms: Two 3-bedroom units
- Bathrooms: Six full bathrooms
- Heating & cooling: No central cooling; Heating: Other (see remarks)
- Interior features: Beamed ceilings; Other interior features
- Laundry & utility: Laundry area (other)
Neighborhood map
What this means for you Summary
Snapshot
- This is a 2 × 4-bed/?-bath units multifamily listed at $500k.
Deal economics
- At list price, monthly cash flow is $2k ($24k/yr) — positive. Per door: $1k/mo.
- The deal already cash-flows at list — no discount required.
- Meets the 1% rule at list price ($7k rent vs $500k).
- Recommended offer: $485k (3.0% below list) — sets the bar for market timing.
- Cap rate 11.1% vs local median 5.3% in Yonkers — top-decile yield for the area; either an underpriced asset or a hidden risk that comps aren't pricing in. Stress-test before assuming the spread holds.
Location & tenants
- Location reads 68/100 on livability (#528 in NY) — a middle-class / working-renter tenant base. Strengths: employment A, commute B; Watch: amenities F, cost of living F.
- Yonkers City School District (suburban): math 41% / reading 54% proficiency, ranked #413 of 590 in NY (top 70%) — families likely to look elsewhere, expect single-tenant / working-renter base with shorter leases; 64% free/reduced lunch — lower-income household profile, screen leases tightly.
- Zoned schools: Yonkers Early Childhood Academy (327 students, 72% FRL); Yonkers Middle School (math 17% / reading 37%, grade F, #587 of 729 statewide, top 81%, 601 students, 88% FRL); Yonkers High School (math 92% / reading 88%, grade A+, #238 of 1,100 statewide, top 23%, 1,060 students, 76% FRL) — zoned schools average 79% FRL vs 64% district-wide (15 pts higher); higher-poverty schools than district average — tighter screening recommended.
- Market conditions: Rents rising fast (+4.4%/yr); 183 active listings in the ZIP; 954 units permitted in Westchester County in 2024 (649 in 5+ unit buildings).
- At $6,910/mo this rent would consume 128% of the median local household income ($65k/yr) (locally 6045% of renters already pay >50% of income on rent) — very limited rent-growth headroom before tenants either downsize or default.
Forward outlook
- Local home prices are declining (-3.0%/yr); year-one equity from $3k of loan paydown is wiped out by about $15k of value loss. Plan a longer hold.
- Westchester County population projected at +10% by 2050 — modest demand growth; plan on rents tracking national, not racing it.
- At projected returns (-3.0% appreciation + 4.4% rent growth), your $140k cash investment doubles in ~7 years — after that, you're playing with house money.
Negotiation context
- It's been on market 49 days — a 3% lower offer ($485k) is reasonable based on typical stale-listing flexibility.
- 5 sale attempts since 9y ago with the ask held roughly flat each time — persistent listings suggest the price (not the market) is what's stuck; bring a comps-based counter.
- Current owner paid $267k; list at $500k implies a 87% gain — meaningful room to come down on a strong offer.
Risks & watch-outs
- Watch-outs: built in 1935 — expect roof / HVAC / electrical / plumbing capex.
Questions for the listing agent
- It's been on market 49 days. Have you received any prior offers? Is the seller open to a 3% concession, seller financing, or rate buy-down credit?
- Can we see the unit-by-unit rent roll, current vacancy, and any below-market leases? What's the average tenancy length?
- What capital expenditures (roof, boiler, parking lot, exteriors) have been made in the last 5 years, and what's planned in the next 2?
- Built in 1935 — when were the roof, HVAC, electrical panel, plumbing, and water heater last replaced?
- Is there a deadline driving the sale (1031 exchange, divorce, estate, relocation)? That informs how much negotiation room exists.
- What's the average days-on-market for RENTAL listings here right now (not sales)? A rising rental-DOM trend means longer vacancies and softer asking-rent achievability than the comps imply.
- What's the recent tenant-quality profile in this submarket — average credit score on applications, eviction rate, late-payment / NSF rate, and stable-employment percentage? A property-management company in the area should have these aggregated.
- How much new apartment / multifamily construction is in the pipeline within 1–3 miles? Heavy new supply (>2% of stock underway) typically softens rents 12–24 months out; light construction supports rent growth.
Investment metrics
- 1% rule
- 1.38% ✓
- Cap rate
- 11.10%
- Cash-on-cash
- 17.17%
- DSCR
- 1.76
- GRM
- 6.0
CMA / ARV
- ARV (median comp)
- $1,341,852
- List price
- $499,999
- Delta
- -62.74%
- Verdict
- UNDERPRICED
- Comps
- 20 within 1.0 mi
Show comp detail 6 sales within ~0.75 mi
| Address | Dist | Beds/Ba | Sqft | Sold | Price | $/sf | Match |
|---|---|---|---|---|---|---|---|
| 198 Elm St | 0.07mi | 9/3.0 (+1) | 2,772 (-6%) | 19mo | $665,000 | $240 | 55 |
| 83 Alta Ave | 0.71mi | 8/— | 3,200 (+9%) | 4mo | $825,000 | $258 | 49 |
| 9 Van Buren St | 0.24mi | 9/3.0 (+1) | 2,763 (-6%) | 16mo | $655,000 | $237 | 48 |
| 156 Beech St | 0.28mi | 8/3.0 | 2,526 (-14%) | 8mo | $825,000 | $327 | 45 |
| 43 Oak St | 0.16mi | 9/3.0 (+1) | 3,287 (+12%) | 17mo | $800,000 | $243 | 42 |
| 59 Park Hill Ave | 0.41mi | 9/4.0 (+1) | 3,240 (+10%) | 11mo | $899,000 | $277 | 41 |
Match score weights: distance 35% · size 25% · config 20% · recency 20%. Top-matched comps best support the ARV.
Projected returns pro-forma
-3.0% appreciation · 4.39% rent growth · sell at horizon
- IRR
- 10.1%
- Equity multiple
- 1.40×
- Total profit
- $56,486
- Equity at exit
- $74,551
- IRR
- 20.3%
- Equity multiple
- 2.82×
- Total profit
- $255,282
- Equity at exit
- $43,231
Cash invested: $140,000 (down + closing). Projections, not guarantees.
Landlord ↔ Tenant lean methodology
- Overall (CITY)
- 5 Strongly Tenant-Friendly
- State New York
- 15 Strongly Tenant-Friendly · D+10
- County
- — inherits STATE
- City Yonkers
- 5 Strongly Tenant-Friendly · D+20
ZIP-level market 10701
- Rents YoY
- 4.4%
- Active inventory
- 183
- Price-to-rent
- 12.1×
Monthly cashflow live
- Estimated rent
- $6,910 high interval (Pro) →
- Mortgage (P&I)
- −$2,622
- Tax est. 1.5%
- −$625 /mo · $7,500/yr
- Insurance
- −$208
- HOA
- −$0
- Vacancy / Maint / Mgmt
- −$1,451
- Net cashflow
- $2,004
Break-even live
2-unit breakdown (identical units grouped — click to expand)
| Units | Beds | Baths | Est. rent |
|---|---|---|---|
| 2× units | 4 | — | $6,910 |
| #1 | 4 | — | $3,455 |
| #2 | 4 | — | $3,455 |
| Total (2 units) | $6,910 | ||
UW: 25.0% down · 7.5% · 30yr · 1.5% tax · 5.0% vac · 8.0% maint · 8.0% mgmt
Financing live
Cash to close
- Down payment
- $125,000
- Closing costs
- $15,000
- Reserves months
- —
- Total cash needed
- —
Loan-product check · same deal, 3 products live
Conventional
25% down · 7.5% · 30yr
- Down + closing
- —
- Monthly P&I
- —
- Monthly cashflow
- —
- DSCR
- —
- Eligible?
- —
Personal DTI + credit; lowest rate.
DSCR
20% down · 8.5% · 30yr
- Down + closing
- —
- Monthly P&I
- —
- Monthly cashflow
- —
- DSCR
- —
- Eligible?
- —
No personal income docs; deal must DSCR.
Hard money
10% down · 12.0% · 12mo
- Down + closing
- —
- Monthly P&I
- —
- Monthly cashflow
- —
- DSCR
- —
- Eligible?
- —
Short-term bridge; refi at stabilization.
Listing history 24 events
-
2026-06-18days on market $499,999 Active 49 DOM
-
2026-06-17days on market $499,999 Active 48 DOM
-
2026-06-16days on market $499,999 Active 47 DOM
-
2026-06-15days on market $499,999 Active 46 DOM
-
2026-06-13days on market $499,999 Active 44 DOM
-
2026-06-09days on market $499,999 Active 40 DOM
-
2026-06-08days on market $499,999 Active 39 DOM
-
2026-06-07days on market $499,999 Active 38 DOM
-
2026-06-04days on market $499,999 Active 35 DOM
-
2026-06-03days on market $499,999 Active 34 DOM
-
2026-06-02days on market $499,999 Active 33 DOM
-
2026-06-01days on market $499,999 Active 32 DOM
-
2026-05-31days on market $499,999 Active 31 DOM
-
2026-05-01$499,999 Active 2427-char remark
-
2026-05-01historical $499,999 2427-char remark
-
2018-08-17historical
-
2018-08-15$824,999 Active
-
2017-12-14soldstatus $266,689 Sold
Show marketing remark (359 chars)
Mixed Use Multi Family Building with Income producing fully operational Laundromat. Both units renting under market value! Two off street parking spaces included. Seller supplies heat for the building. Tenants pay their own electric & cooking gas. Separate water, gas and electric meters for business***CASH OFFERS ONLY***Property needs Work. Sold As Is.
-
2017-11-08historical Pending
Show marketing remark (359 chars)
Mixed Use Multi Family Building with Income producing fully operational Laundromat. Both units renting under market value! Two off street parking spaces included. Seller supplies heat for the building. Tenants pay their own electric & cooking gas. Separate water, gas and electric meters for business***CASH OFFERS ONLY***Property needs Work. Sold As Is.
-
2017-09-05$375,000 Active
Show marketing remark (359 chars)
Mixed Use Multi Family Building with Income producing fully operational Laundromat. Both units renting under market value! Two off street parking spaces included. Seller supplies heat for the building. Tenants pay their own electric & cooking gas. Separate water, gas and electric meters for business***CASH OFFERS ONLY***Property needs Work. Sold As Is.
-
2017-09-01historical
-
2017-06-09$429,000 Active
-
2017-04-27historical
-
2017-04-19$589,000 Active
ⓘ Source: listings_history table (triggers on properties + properties_extension) + one-shot
backfill from property_details.listing_events for pre-trigger history.
Nearby sold comps map
Loading sold comps map…
Walkable amenities ~0.75 mi
Loading nearby amenities…
Taxation est. · year 1
- Rental income
- $82,920
- − Mortgage interest
- −$28,008
- − Property taxes
- −$7,500
- − Insurance
- −$2,500
- − Repairs & maintenance
- −$6,634
- − Management
- −$6,634
- − Depreciation
- −$14,545
- Taxable income
- $17,100
- Est. tax owed @ 24.0%
- −$4,104
- After-tax cash flow
- $19,938/yr
For passive investors: Depreciation is non-cash, so a rental often shows a tax loss while cash-flowing — sheltering income. Rental losses are passive: they offset passive income freely, and up to $25,000/yr can offset ordinary (W-2) income if you actively participate and your MAGI is under $100k (phasing out to $0 by $150k); unused losses carry forward. On sale, claimed depreciation is recaptured at up to 25%, and gains may owe capital-gains tax (a 1031 exchange can defer both). Figures are a year-1 estimate at your 24.0% rate — not tax advice; consult a CPA.
Schools (NCES district)
- District
- Yonkers City School District
- NCES district ID
- 3631920
- Math proficiency
- 41% ▼ -1.00%
- Reading proficiency
- 54% ▲ 14.00%
- Median HH income
- $58,042
- Composite
- 41.43/100
- National rank
- #3471
- State rank
- #413 of 590 in NY
Livability — Yonkers
- Score
- 68/100
- State rank
- #528
- US rank
- #9394
Category grades
Schools grade is shown separately in the Schools card above.
Census & demographics
- Census place
- Yonkers, NY
- County
- Westchester County · 709,332 people
- City population
- 212,407
- Metro
- New York-Newark-Jersey City, NY-NJ-PA
- Population (ZIP)
- 70,676
- Household income
- $64,776
- Rent vs Own
- Severe rent burden
- 6045.0
Population outlook (Westchester County) Hauer SSP2
- Today (2025)
- 1,028,035 people
- By 2030
- 1,051,636 · +2.3%
- By 2040
- 1,098,520 · +6.9%
- By 2050
- 1,136,044 · +10.5%
- By 2075
- 1,196,925 · +16.4%
- By 2100
- 1,175,147 · +14.3%
Race, ethnicity, and origin ACS 2023
- Neighborhood character
- Diverse neighborhood (Simpson 0.65)
- Race & ethnicity
- Hispanic / Latino 52% White 21% Black 21% Two or more races 18% Asian 3% Native American 1%
- Hispanic origin (detail)
- Mexican 11% Puerto Rican 9% Dominican 19%
- Common ancestry
- Romanian 1% Russian 1% Subsaharan African 1%
- Foreign-born
- 35% · Canada, Jamaica, South Korea
- Languages at home
- 45% English-only · Spanish 42% Other Indo-European 3% Arabic 2%
Political lean MEDSL · Westchester
- 2024 margin
- Strong D (+26.3) · D 63.1% · R 36.9%
- 2008→2024 swing
- -1.3pp toward R · 2008: 27.6pp · 2024: 26.3pp
- All cycles
- 2024: D+26.3 2020: D+36.3 2016: D+32.8 2012: D+22.2 2008: D+27.6
Not yet ingested
- Civics
- —
Market trends
- HPI YoY
- ▼ -373.14%
- Current HPI
- 332.0999
- Rent YoY
- ▲ 4.39%
- Metro
- New York-Newark-Jersey City, NY-NJ-PA
- State GDP YoY
- ▲ 2.60%
- F500 in state
- 92
Industry mix (Fortune 500 HQ in NY)
| Industry | F500 HQs | Revenue |
|---|---|---|
| Financial Services | 10 | $950B |
|
||
| Consumer Goods | 9 | $162B |
|
||
| Insurance | 4 | $225B |
|
||
| Telecommunications | 2 | $144B |
|
||
| Pharmaceuticals | 2 | $112B |
|
||
| Media / Entertainment | 2 | $69B |
|
||
Price history
-15.1% since first listed11 events — show timeline
- 2026-05-01 Listed $499,999 OneKey® MLS as Distributed by MLS Grid
- 2026-05-01 Coming Soon $499,999 OneKey® MLS as Distributed by MLS Grid
- 2018-08-17 Listing Removed — OneKey® MLS as Distributed by MLS Grid
- 2018-08-15 Listed $824,999 OneKey® MLS as Distributed by MLS Grid
- 2017-12-14 Sold (MLS) $266,689 OneKey® MLS as Distributed by MLS Grid
- 2017-11-08 Contingent — OneKey® MLS as Distributed by MLS Grid
- 2017-09-05 Listed $375,000 OneKey® MLS as Distributed by MLS Grid
- 2017-09-01 Listing Removed — OneKey® MLS as Distributed by MLS Grid
- 2017-06-09 Listed $429,000 OneKey® MLS as Distributed by MLS Grid
- 2017-04-27 Listing Removed — OneKey® MLS as Distributed by MLS Grid
- 2017-04-19 Listed $589,000 OneKey® MLS as Distributed by MLS Grid
Cash-flow waterfall
monthlySold comps — $/sqft
last 12 mo · ≤1 miLoading sold comps…