805 W 15th St · Muncie, IN
Flood risk 1/10 · Minimal
- FEMA flood zone
- X (unshaded)
- Chance of flooding over 30 yrs
- 0.0%
- Est. flood insurance / yr
- $507 – $1,088
Fire risk 1/10 · Minimal
- Est. fire insurance / yr
- $717 – $1,331
Heat risk 3/10 · Minor
- Hot days now (above 100°F)
- 7 days/yr
- Hot days in 30 yrs
- 18 days/yr
Wind risk 2/10 · Minimal
- Chance of severe wind over 30 yrs
- 0.0%
Air-quality risk 3/10 · Minor
- Unhealthy air days now
- 2 days/yr
- Unhealthy air days in 30 yrs
- 3 days/yr
Risk factors via First Street. Map © Google.
Why this score? — see what drove the D+ grade
The composite is a weighted blend of 9 inputs, each scored 0–100. Each bar is that input's sub-score; the figure is the points it added to the 100-point composite (weight × sub-score).
- Cash flow +19.3/30.0
- DSCR +6.1/10.0
- 1% rule +5.1/10.0
- ARV discount +4.9/15.0
- Rent growth +4.0/5.0
- Livability +4.0/5.0
- Condition / age +2.5/5.0
- Schools +1.7/10.0
- Appreciation +0.0/10.0
$91,000
🖨 Deal sheet 📄 Offer letter ✓ Due diligence
Listing remarks MLS
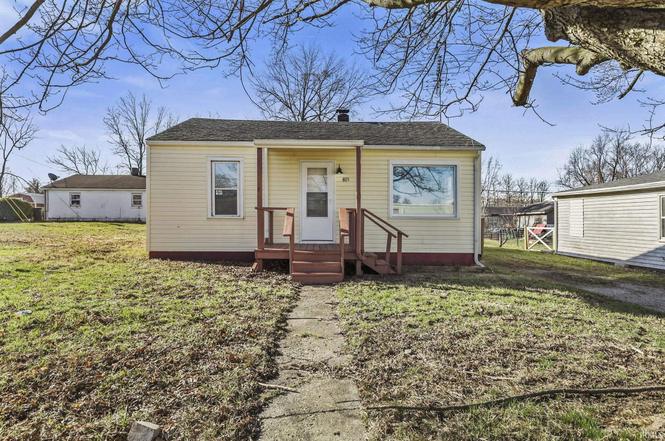
Great layout with updates! One story with easy access! 3 Bed 1 Bath with a open Kitchen mud rm / main floor laundry combo! Large central living room! Nice side deck and back yard for entertaining. New central air, paint, siding. .. etc Come take your tour today!
Key facts
- 6,970 sq ft lot
- Built 1946
- Listed 42 days
Neighborhood map
What this means for you Summary
Snapshot
- This is a 2-bed/1.0-bath single-family listed at $91k.
Deal economics
- At list price, monthly cash flow is $100 ($1k/yr) — positive.
- The deal already cash-flows at list — no discount required.
- Meets the 1% rule at list price ($922 rent vs $91k).
- Recommended offer: $88k (3.0% below list) — sets the bar for market timing.
- Cap rate 7.6% vs local median 6.0% in Muncie — meaningfully above typical; check what's discounted (condition, days-on-market, listing class) to confirm the premium yield is real.
Location & tenants
- Location reads 80/100 on livability (#18 in IN, #1,654 nationally) — a professional / high-income tenant draw. Strengths: amenities A+, commute A+, cost of living A+; Watch: crime F, employment F.
- Muncie Community Schools (urban): math 18% / reading 25% proficiency, ranked #275 of 301 in IN (top 91%) — low school quality limits family demand, transient renter base, plan for 1-2y turnover; 68% free/reduced lunch — lower-income household profile, screen leases tightly.
- Zoned schools: Southside Middle School (math 7% / reading 15%, grade F, #312 of 330 statewide, top 95%, 443 students, 85% FRL) — zoned schools average 85% FRL vs 68% district-wide (17 pts higher); higher-poverty schools than district average — tighter screening recommended.
- Market conditions: Rents rising fast (+6.1%/yr); 148 active listings in the ZIP; 40 comparable units currently listed for rent nearby; rentals lingering (median 44d on market — plan ~5-8 weeks vacancy on turnover, expect pricing pressure); 100% of comp listings sitting > 30 days — soft ceiling on asking rent; 171 units permitted in Delaware County in 2024 (57 in 5+ unit buildings).
Forward outlook
- Local home prices are declining (-3.0%/yr); year-one equity from $629 of loan paydown is wiped out by about $3k of value loss. Plan a longer hold.
- Delaware County population projected at -11% by 2050 — secular population decline; favor cash flow + early exit over multi-decade hold.
Negotiation context
- It's been on market 42 days — a 3% lower offer ($88k) is reasonable based on typical stale-listing flexibility.
- 4 sale attempts since 6y ago with the ask held roughly flat each time — persistent listings suggest the price (not the market) is what's stuck; bring a comps-based counter.
- Current owner paid $50k; list at $91k implies a 82% gain — meaningful room to come down on a strong offer.
Risks & watch-outs
- Watch-outs: built in 1946 — expect roof / HVAC / electrical / plumbing capex.
Questions for the listing agent
- It's been on market 42 days. Have you received any prior offers? Is the seller open to a 3% concession, seller financing, or rate buy-down credit?
- Built in 1946 — when were the roof, HVAC, electrical panel, plumbing, and water heater last replaced?
- Is there a deadline driving the sale (1031 exchange, divorce, estate, relocation)? That informs how much negotiation room exists.
- Schools are D-rated, which usually means shorter tenancies and higher turnover. Who's the typical renter profile here, and what's been the actual vacancy rate?
- Crime grade is F in this area — have there been break-ins, vandalism, or insurance claims at this property in the last 3 years? What carrier currently insures it and at what premium?
- The area grade is low — what's the realistic commute time and amenity access for the typical tenant pool here? Any planned neighborhood developments (good or bad) we should know about?
- What's the average days-on-market for RENTAL listings here right now (not sales)? A rising rental-DOM trend means longer vacancies and softer asking-rent achievability than the comps imply.
- What's the recent tenant-quality profile in this submarket — average credit score on applications, eviction rate, late-payment / NSF rate, and stable-employment percentage? A property-management company in the area should have these aggregated.
- How much new for-sale + rental construction is in the pipeline within 1–3 miles? Heavy new supply typically softens prices + rents 12–24 months out; constrained supply supports both.
Investment metrics
- 1% rule
- 1.01% ✓
- Cap rate
- 7.61%
- Cash-on-cash
- 4.69%
- DSCR
- 1.21
- GRM
- 8.2
CMA / ARV
- ARV (on-the-fly)
- $86,016
- Comps found
- 12
Show comp detail 12 sales within ~0.75 mi
| Address | Dist | Beds/Ba | Sqft | Sold | Price | $/sf | Match |
|---|---|---|---|---|---|---|---|
| 805 W 15th St | 0.00mi | 3/1.0 (+1) | 896 (0%) | 0mo | $91,000 | $102 | 95 |
| 1800 W 13th St | 0.62mi | 2/1.0 | 896 (0%) | 0mo | $97,000 | $108 | 71 |
| 1617 W 16th St | 0.54mi | 3/1.0 (+1) | 894 (-0%) | 2mo | $100,000 | $112 | 68 |
| 904 W 15th St | 0.06mi | 2/1.0 | 1,012 (+13%) | 10mo | $99,000 | $98 | 68 |
| 1436 W 14th St | 0.43mi | 2/1.0 | 952 (+6%) | 5mo | $95,000 | $100 | 66 |
| 1308 W 16th St | 0.32mi | 2/1.0 | 992 (+11%) | 10mo | $60,000 | $60 | 59 |
| 2316 S Walnut St | 0.48mi | 3/1.0 (+1) | 956 (+7%) | 5mo | $35,000 | $37 | 57 |
| 226 E 16th St | 0.56mi | 2/1.0 | 960 (+7%) | 6mo | $50,000 | $52 | 57 |
| 1720 S Jefferson St | 0.65mi | 2/1.0 | 936 (+4%) | 9mo | $89,900 | $96 | 55 |
| 1816 W 13th St | 0.65mi | 2/1.0 | 942 (+5%) | 11mo | $82,000 | $87 | 52 |
| 1804 W 15th St | 0.61mi | 2/1.0 | 822 (-8%) | 9mo | $57,150 | $70 | 50 |
| 1712 S Elm St | 0.71mi | 2/1.0 | 1,004 (+12%) | 12mo | $96,200 | $96 | 37 |
Match score weights: distance 35% · size 25% · config 20% · recency 20%. Top-matched comps best support the ARV.
Projected returns pro-forma
-3.0% appreciation · 6.11% rent growth · sell at horizon
- IRR
- -5.5%
- Equity multiple
- 0.79×
- Total profit
- $-5,416
- Equity at exit
- $13,568
- IRR
- 7.5%
- Equity multiple
- 1.65×
- Total profit
- $16,519
- Equity at exit
- $7,868
Cash invested: $25,480 (down + closing). Projections, not guarantees.
Landlord ↔ Tenant lean methodology
- Overall (STATE)
- 90 Strongly Landlord-Friendly
- State Indiana
- 90 Strongly Landlord-Friendly · R+11
- County
- — inherits STATE
- City
- — inherits STATE
ZIP-level market 47302
- Home prices YoY
- -12.6%
- Rents YoY
- 6.1%
- Active inventory
- 148
- Price-to-rent
- 8.2×
Monthly cashflow live
- Estimated rent
- $922 high interval (Pro) →
- Mortgage (P&I)
- −$477
- Tax est. 1.5%
- −$114 /mo · $1,365/yr
- Insurance
- −$38
- HOA
- −$0
- Vacancy / Maint / Mgmt
- −$194
- Net cashflow
- $100
Break-even live
UW: 25.0% down · 7.5% · 30yr · 1.5% tax · 5.0% vac · 8.0% maint · 8.0% mgmt
Financing live
Cash to close
- Down payment
- $22,750
- Closing costs
- $2,730
- Reserves months
- —
- Total cash needed
- —
Loan-product check · same deal, 3 products live
Conventional
25% down · 7.5% · 30yr
- Down + closing
- —
- Monthly P&I
- —
- Monthly cashflow
- —
- DSCR
- —
- Eligible?
- —
Personal DTI + credit; lowest rate.
DSCR
20% down · 8.5% · 30yr
- Down + closing
- —
- Monthly P&I
- —
- Monthly cashflow
- —
- DSCR
- —
- Eligible?
- —
No personal income docs; deal must DSCR.
Hard money
10% down · 12.0% · 12mo
- Down + closing
- —
- Monthly P&I
- —
- Monthly cashflow
- —
- DSCR
- —
- Eligible?
- —
Short-term bridge; refi at stabilization.
Rent comps 40 comps
| Address | Beds | Baths | Sqft | Rent | $/sqft | DOM | Units | Dist |
|---|---|---|---|---|---|---|---|---|
| 815 W Memorial Dr Muncie, IN | 2.0 | 1.0 | 800 | $750 | $0.94 | 43d | 1 | 0.15mi |
| 301 W 13th St Muncie, IN | 1.0–2.0 | 1.0 | 725 | $844 | $1.16 | 43d | 1 | 0.32mi |
| 1609 S Gharkey St Muncie, IN | 2.0 | 1.0 | 744 | $750 | $1.01 | 43d | 1 | 0.34mi |
| 206 W 13th St Muncie, IN | 2.0 | 1.0 | 992 | $900 | $0.91 | 43d | 1 | 0.38mi |
| 421 W 9th St Muncie, IN | 1.0 | 1.0 | 672 | $525 | $0.78 | 43d | 1 | 0.41mi |
| 319 W 10th St Muncie, IN | 2.0 | 1.0 | 869 | $885 | $1.02 | 43d | 1 | 0.42mi |
| 415 W 9th St Muncie, IN | 2.0 | 1.0 | 705 | $925 | $1.31 | 43d | 1 | 0.42mi |
| 509 W 8th St Muncie, IN | 3.0 | 1.0 | 1008 | $1,325 | $1.31 | 43d | 1 | 0.43mi |
| 2316 S Walnut St Muncie, IN | 3.0 | 1.0 | 956 | $1,100 | $1.15 | 43d | 1 | 0.49mi |
| 1704 W 15th St Muncie, IN | 3.0 | 1.0 | 1026 | $1,275 | $1.24 | 43d | 1 | 0.56mi |
| 1525 S Walnut St Unit 11 Muncie, IN | 2.0 | 1.0 | 800 | $775 | $0.97 | 43d | 1 | 0.57mi |
| 1721 S Elm St Muncie, IN | 2.0 | 1.0 | 940 | $925 | $0.98 | 43d | 1 | 0.67mi |
| 2815 S Elm St Muncie, IN | 2.0 | 1.0 | 672 | $875 | $1.30 | 43d | 1 | 0.80mi |
| 1001 W 1st St Unit 1 Muncie, IN | 3.0 | 1.5 | 1098 | $875 | $0.80 | 43d | 1 | 0.81mi |
| 2105 S Vine St Muncie, IN | 3.0 | 1.0 | 960 | $1,365 | $1.42 | 43d | 1 | 0.81mi |
| 810 W 1st St Muncie, IN | 1.0 | 1.0 | 980 | $599 | $0.61 | 43d | 1 | 0.83mi |
| 2302 S Hackley St Muncie, IN | 2.0 | 1.0 | 870 | $1,199 | $1.38 | 43d | 1 | 0.97mi |
| 514 W Charles St Muncie, IN | 2.0 | 1.0 | 1062 | $800 | $0.75 | 43d | 1 | 1.07mi |
| 3013 S Pershing Dr Muncie, IN | 3.0 | 1.0 | 814 | $850 | $1.04 | 43d | 1 | 1.09mi |
| 3106 S Vine St Muncie, IN | 3.0 | 1.0 | 1080 | $1,200 | $1.11 | 43d | 1 | 1.09mi |
| 326 W Charles St Muncie, IN | 2.0 | 1.0 | 836 | $1,300 | $1.56 | 43d | 1 | 1.09mi |
| 1307 S Ebright St Unit 2 Muncie, IN | 1.0 | 1.0 | 630 | $695 | $1.10 | 43d | 1 | 1.12mi |
| 522 W Adams St Muncie, IN | 2.0 | 1.0 | 750 | $810 | $1.08 | 43d | 6 | 1.14mi |
| 2600 W Memorial Dr Muncie, IN | 1.0 | 1.0 | 525 | $705 | $1.34 | 43d | 8 | 1.18mi |
| 1408 W White River Blvd Muncie, IN | 1.0 | 1.0 | 610 | $938 | $1.54 | 43d | 1 | 1.18mi |
| 2015 W Godman Ave Muncie, IN | 2.0 | 1.0 | 900 | $985 | $1.09 | 43d | 7 | 1.21mi |
| 907 W Main St Apt 1 Muncie, IN | 2.0 | 1.0 | 750 | $775 | $1.03 | 43d | 1 | 1.22mi |
| 1409 W Jackson St Muncie, IN | 2.0 | 1.0 | 811 | $844 | $1.04 | 43d | 1 | 1.23mi |
| 1311 E 11th St Unit 2 Muncie, IN | 1.0 | 1.0 | 672 | $715 | $1.06 | 43d | 1 | 1.23mi |
| 906 W Main St Muncie, IN | 1.0–2.0 | 1.0 | 712 | $995 | $1.40 | 43d | 3 | 1.25mi |
| 626 W Main St Muncie, IN | 1.0 | 1.0 | 738 | $715 | $0.97 | 43d | 2 | 1.25mi |
| 309 S McKinley Ave Muncie, IN | 2.0 | 1.0 | 875 | $1,100 | $1.26 | 43d | 1 | 1.28mi |
| 400 W Washington St Unit 101 Muncie, IN | 1.0 | 1.0 | 700 | $1,050 | $1.50 | 43d | 1 | 1.30mi |
| 400 W Washington St Unit 213 Muncie, IN | 2.0 | 2.0 | 1009 | $1,200 | $1.19 | 43d | 1 | 1.30mi |
| 1310 E 5th St Muncie, IN | 3.0 | 1.0 | 864 | $1,300 | $1.50 | 43d | 1 | 1.37mi |
| 1109 E Kirby Ave Muncie, IN | 2.0–3.0 | 1.0 | 971 | $835 | $0.86 | 43d | 2 | 1.37mi |
| 715 S Cole Ave Muncie, IN | 1.0–2.0 | 1.0 | 462 | $995 | $2.15 | 43d | 6 | 1.43mi |
| 106 N McKinley Ave Muncie, IN | 2.0 | 1.0 | 996 | $1,024 | $1.03 | 43d | 2 | 1.43mi |
| 210 N Martin St Muncie, IN | 1.0 | 1.0 | 640 | $742 | $1.16 | 43d | 3 | 1.44mi |
| 1703 E 14th St Apt 15 Muncie, IN | 2.0 | 1.0 | 756 | $777 | $1.03 | 43d | 1 | 1.49mi |
Listing history 8 events
-
2026-04-23status Pending
-
2026-03-28price $91,000
-
2026-03-12$92,000 Active
-
2021-11-23soldstatus $49,900 262-char remark
Show marketing remark (262 chars)
Great layout with updates! One story with easy access! 3 Bed 1 Bath with a open Kitchen mud rm / main floor laundry combo! Large central living room! Nice side deck and back yard for entertaining. New central air, paint, siding. .. etc Come take your tour today!
-
2021-11-23soldstatus $49,900
Show marketing remark (262 chars)
Great layout with updates! One story with easy access! 3 Bed 1 Bath with a open Kitchen mud rm / main floor laundry combo! Large central living room! Nice side deck and back yard for entertaining. New central air, paint, siding. .. etc Come take your tour today!
-
2021-10-22$49,900
-
2021-08-25$49,900 262-char remark
Show marketing remark (262 chars)
Great layout with updates! One story with easy access! 3 Bed 1 Bath with a open Kitchen mud rm / main floor laundry combo! Large central living room! Nice side deck and back yard for entertaining. New central air, paint, siding. .. etc Come take your tour today!
-
2020-11-04$28,900
ⓘ Source: listings_history table (triggers on properties + properties_extension) + one-shot
backfill from property_details.listing_events for pre-trigger history.
Climate risk First Street
- Flood 1/10 Low FEMA zone X (unshaded) · 0% chance over 30 yrs
- Wildfire 1/10 Low
- Heat 3/10 Moderate 7 d/yr ≥100°F today · 18 d/yr by 30 yrs out
- Wind 2/10 Low 0% chance of damaging wind over 30 yrs
- Air quality 3/10 Moderate 2 unhealthy d/yr today · 3 by 30 yrs out
Nearby sold comps map
Loading sold comps map…
Walkable amenities ~0.75 mi
Loading nearby amenities…
Taxation est. · year 1
- Rental income
- $11,065
- − Mortgage interest
- −$5,097
- − Property taxes
- −$1,365
- − Insurance
- −$455
- − Repairs & maintenance
- −$885
- − Management
- −$885
- − Depreciation
- −$2,647
- Taxable loss
- −$270
- Est. tax savings @ 24.0%
- +$65
- After-tax cash flow
- $1,260/yr
For passive investors: Depreciation is non-cash, so a rental often shows a tax loss while cash-flowing — sheltering income. Rental losses are passive: they offset passive income freely, and up to $25,000/yr can offset ordinary (W-2) income if you actively participate and your MAGI is under $100k (phasing out to $0 by $150k); unused losses carry forward. On sale, claimed depreciation is recaptured at up to 25%, and gains may owe capital-gains tax (a 1031 exchange can defer both). Figures are a year-1 estimate at your 24.0% rate — not tax advice; consult a CPA.
Schools (NCES district)
- District
- Muncie Community Schools
- NCES district ID
- 1807320
- Math proficiency
- 18% ▼ -9.00%
- Reading proficiency
- 25% ▼ -4.00%
- Median HH income
- $30,052
- Composite
- 17.22/100
- National rank
- #9099
- State rank
- #275 of 301 in IN
Livability — Muncie
- Score
- 80/100
- State rank
- #18
- US rank
- #1654
Category grades
Schools grade is shown separately in the Schools card above.
Census & demographics
- Census place
- Muncie, IN
- County
- Delaware County · 84,658 people
- City population
- 84,658
- Metro
- Muncie, IN
- Population (ZIP)
- 25,473
- Household income
- $47,837
- Rent vs Own
- Severe rent burden
- 1150.0
Population outlook (Delaware County) Hauer SSP2
- Today (2025)
- 113,036 people
- By 2030
- 111,313 · -1.5%
- By 2040
- 106,432 · -5.8%
- By 2050
- 100,747 · -10.9%
- By 2075
- 91,000 · -19.5%
- By 2100
- 80,687 · -28.6%
Race, ethnicity, and origin ACS 2023
- Neighborhood character
- Predominantly White (84%)
- Race & ethnicity
- White 84% Two or more races 6% Black 6% Hispanic / Latino 4%
- Common ancestry
- Italian 2% Slovak 1% Romanian 1%
- Foreign-born
- 1% · Canada
- Languages at home
- 98% English-only · Spanish 1% German/W. Germanic 1%
Political lean MEDSL · Delaware
- 2024 margin
- R (+15.8) · D 41.2% · R 57.0% · Other 1.8%
- 2008→2024 swing
- -30.8pp toward R · 2008: 15.0pp · 2024: -15.8pp
- All cycles
- 2024: R+15.8 2020: R+13.2 2016: R+13.7 2012: D+3.1 2008: D+15.0
Not yet ingested
- Civics
- —
Market trends
- HPI YoY
- ▼ -30.32%
- Current HPI
- 210.431
- Rent YoY
- ▲ 6.11%
- Metro
- Muncie, IN
- State GDP YoY
- ▲ 2.90%
- F500 in state
- 18
Industry mix (Fortune 500 HQ in IN)
| Industry | F500 HQs | Revenue |
|---|---|---|
| Industrial Machinery | 2 | $37B |
|
||
| Healthcare | 1 | $177B |
|
||
| Pharmaceuticals | 1 | $45B |
|
||
| Metals / Steel | 1 | $18B |
|
||
| Agriculture | 1 | $17B |
|
||
| Packaging | 1 | $12B |
|
||
Price history
+214.9% since first listed8 events — show timeline
- 2026-04-23 Pending — IRMLS
- 2026-03-28 Price Changed $91,000 IRMLS
- 2026-03-12 Listed $92,000 IRMLS
- 2021-11-23 Sold (MLS) $49,900 MIBOR as Distributed by MLS Grid
- 2021-11-23 Sold (MLS) $49,900 IRMLS
- 2021-10-22 Listed $49,900 MIBOR as Distributed by MLS Grid
- 2021-08-25 Listed $49,900 IRMLS
- 2020-11-04 Listed $28,900 IRMLS
Property tax history
-18.3%/yrLatest (2024): $118 · +0.0% YoY. Source: county tax records.
Cash-flow waterfall
monthlySold comps — $/sqft
last 12 mo · ≤1 miLoading sold comps…