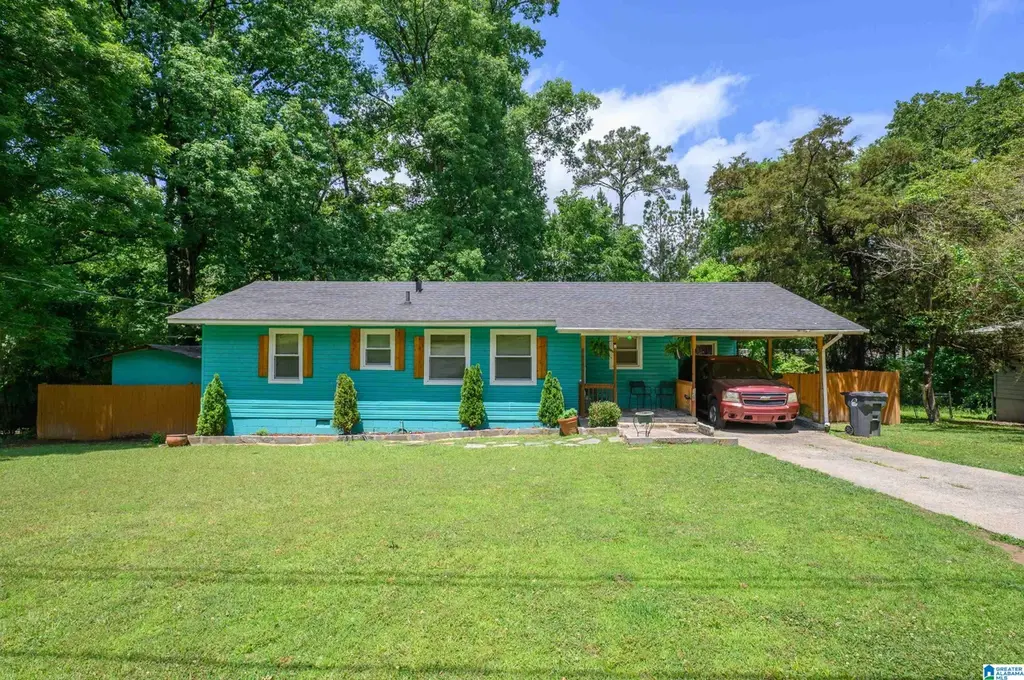
108 26th Ave NW · Center Point, AL
Flood risk 1/10 · Minimal
- FEMA flood zone
- X (unshaded)
- Chance of flooding over 30 yrs
- 0.0%
- Est. flood insurance / yr
- $507 – $1,088
Fire risk 3/10 · Minor
- Est. fire insurance / yr
- $916 – $1,700
Heat risk 5/10 · Moderate
- Hot days now (above 106°F)
- 7 days/yr
- Hot days in 30 yrs
- 18 days/yr
Wind risk 6/10 · Moderate
- Chance of severe wind over 30 yrs
- 27.0%
Air-quality risk 5/10 · Moderate
- Unhealthy air days now
- 6 days/yr
- Unhealthy air days in 30 yrs
- 11 days/yr
Risk factors via First Street. Map © Google.
Why this score? — see what drove the C+ grade
The composite is a weighted blend of 9 inputs, each scored 0–100. Each bar is that input's sub-score; the figure is the points it added to the 100-point composite (weight × sub-score).
- Cash flow +25.6/30.0
- ARV discount +11.8/15.0
- DSCR +8.5/10.0
- 1% rule +5.6/10.0
- Rent growth +3.3/5.0
- Livability +3.2/5.0
- Condition / age +2.5/5.0
- Schools +1.8/10.0
- Appreciation +0.0/10.0
$125,000
🖨 Deal sheet 📄 Offer letter ✓ Due diligence
Listing remarks
Welcome home to this move-in ready 3BR/1BA gem situated on a spacious lot in the heart of Center Point! Featuring over 1,100 sq ft, this home offers a large living area, generously sized bedrooms, and an eat-in kitchen perfect for everyday living. Step outside to enjoy the huge fenced backyard ideal for entertaining, pets, playtime, or relaxing evenings outdoors. Conveniently located near schools, shopping, dining, and major interstates, this home is perfect for first-time buyers or investors looking for a great opportunity. Affordable, charming, and full of potential
Key facts
- Large living area
- Spacious lot
- Eat-in kitchen
Tags
Property features AI
Finance
- Other: Property accessed via public road; Lot size approximately 0.34 acres; Located in the Center Point Highlands subdivision
- HOA & community: No association fees
Exterior
- Parking: Attached parking; Off-street parking; One carport space
- Utilities: Public water; Septic system; Electric water heater; Internet service available; Ceiling fans (energy feature)
- Home design: Existing single-family property; Single-story living areas (main level rooms listed); Crawl space foundation
- Construction: Vinyl siding exterior
- Exterior features: Open deck; Some trees on the lot; No pool; No patio; Not waterfront
Interior
- Kitchen: Refrigerator; Electric stove; Eating area
- Bedrooms: Master bedroom on main level; Additional bedrooms on main level (total 3 bedrooms)
- Flooring: Carpet; Hardwood
- Bathrooms: One full bathroom with tub/shower combo (main level)
- Heating & cooling: Central heating; Central air conditioning
- Interior features: Smooth ceilings; Some window treatments to remain; No special interior features listed
- Laundry & utility: Laundry room on main level; Washer hookup; Electric dryer hookup
Neighborhood map
What this means for you Summary
Snapshot
- This is a 3-bed/1.0-bath single-family listed at $125k.
Deal economics
- At list price, monthly cash flow is $297 ($4k/yr) — positive.
- The deal already cash-flows at list — no discount required.
- Meets the 1% rule at list price ($1k rent vs $125k).
- Recommended offer: $121k (3.0% below list) — sets the bar for market timing.
- Cap rate 9.1% vs local median 7.3% in Center Point — meaningfully above typical; check what's discounted (condition, days-on-market, listing class) to confirm the premium yield is real.
Location & tenants
- Location reads 63/100 on livability (#193 in AL) — a middle-class / working-renter tenant base. Strengths: cost of living A+, commute A, housing A; Watch: crime D, amenities F, employment F.
- Jefferson County (suburban): math 9% / reading 32% proficiency, ranked #104 of 129 in AL (top 81%) — low school quality limits family demand, transient renter base, plan for 1-2y turnover.
- Zoned schools: Center Point Elementary School (618 students, 82% FRL); Center Point High School (math 2% / reading 2%, grade F, #291 of 305 statewide, top 100%, 774 students, 91% FRL) — zoned schools average 86% FRL vs 49% district-wide (38 pts higher); higher-poverty schools than district average — tighter screening recommended.
- Zoned-school proficiency averages 2% at this address vs 20% district-wide (-18 pts) — the specific schools serving this property underperform the Jefferson County average; the district grade overstates school quality for this exact location.
- Market conditions: Rents rising (+3.0%/yr); 334 active listings in the ZIP; 40 comparable units currently listed for rent nearby; rentals at typical pace (median 24d on market — plan ~3-4 weeks tenant-placement turnaround); 42% of comp listings sitting > 30 days — soft ceiling on asking rent; 2,114 units permitted in Jefferson County in 2024 (556 in 5+ unit buildings).
- This rent runs 30% of the median local income ($53k/yr) — at the standard rent-burdened threshold; future hikes will face affordability resistance.
Forward outlook
- Local home prices are declining (-3.0%/yr); year-one equity from $864 of loan paydown is wiped out by about $4k of value loss. Plan a longer hold.
- Jefferson County population projected to shrink 4% by 2050 — rents likely to lag national; underwrite the cash flow, not the appreciation.
Negotiation context
- It's been on market 35 days — a 3% lower offer ($121k) is reasonable based on typical stale-listing flexibility.
- Current owner paid $68k; list at $125k implies a 84% gain — meaningful room to come down on a strong offer.
Risks & watch-outs
- Watch-outs: built in 1957 — expect roof / HVAC / electrical / plumbing capex.
- Climate carrying-cost: major wind risk, 27% chance of damaging wind over 30y; extreme-heat days projected 7→18/yr by 2055 (HVAC capex compounding) — expect insurance premiums to compound above CPI over the hold.
Questions for the listing agent
- It's been on market 35 days. Have you received any prior offers? Is the seller open to a 3% concession, seller financing, or rate buy-down credit?
- Built in 1957 — when were the roof, HVAC, electrical panel, plumbing, and water heater last replaced?
- Is there a deadline driving the sale (1031 exchange, divorce, estate, relocation)? That informs how much negotiation room exists.
- Schools are F-rated, which usually means shorter tenancies and higher turnover. Who's the typical renter profile here, and what's been the actual vacancy rate?
- Crime grade is D in this area — have there been break-ins, vandalism, or insurance claims at this property in the last 3 years? What carrier currently insures it and at what premium?
- What's the average days-on-market for RENTAL listings here right now (not sales)? A rising rental-DOM trend means longer vacancies and softer asking-rent achievability than the comps imply.
- What's the recent tenant-quality profile in this submarket — average credit score on applications, eviction rate, late-payment / NSF rate, and stable-employment percentage? A property-management company in the area should have these aggregated.
- How much new for-sale + rental construction is in the pipeline within 1–3 miles? Heavy new supply typically softens prices + rents 12–24 months out; constrained supply supports both.
Investment metrics
- 1% rule
- 1.06% ✓
- Cap rate
- 9.14%
- Cash-on-cash
- 10.18%
- DSCR
- 1.45
- GRM
- 7.8
CMA / ARV
- ARV (median comp)
- $138,301
- List price
- $125,000
- Delta
- -9.62%
- Verdict
- FAIR
- Comps
- 20 within 1.0 mi
Show comp detail 12 sales within ~0.75 mi
| Address | Dist | Beds/Ba | Sqft | Sold | Price | $/sf | Match |
|---|---|---|---|---|---|---|---|
| 2532 2nd Pl NW | 0.29mi | 3/1.0 | 1,132 (-3%) | 0mo | $120,000 | $106 | 81 |
| 316 25th Ave NW | 0.36mi | 3/1.5 | 1,200 (+3%) | 6mo | $130,000 | $108 | 72 |
| 2352 3rd Way NE | 0.54mi | 3/1.5 | 1,167 (-0%) | 4mo | $103,000 | $88 | 70 |
| 217 23rd Ter NW | 0.43mi | 3/1.5 | 1,232 (+5%) | 4mo | $86,000 | $70 | 66 |
| 101 23rd Ter NW | 0.32mi | 3/1.0 | 1,049 (-10%) | 5mo | $114,000 | $109 | 64 |
| 2245 3rd St NE | 0.68mi | 3/1.0 | 1,150 (-2%) | 5mo | $88,000 | $77 | 62 |
| 317 Sunhill Rd NW | 0.45mi | 2/2.0 (-1) | 1,144 (-2%) | 7mo | $85,000 | $74 | 61 |
| 2244 NW 1st St | 0.53mi | 3/1.5 | 1,116 (-5%) | 10mo | $100,000 | $90 | 58 |
| 2332 3rd St NW | 0.51mi | 3/1.0 | 1,336 (+14%) | 3mo | $110,000 | $82 | 50 |
| 227 27th Court Cir NW | 0.48mi | 3/2.0 | 1,338 (+14%) | 8mo | $60,000 | $45 | 43 |
| 517 Sunhill Rd NW | 0.72mi | 3/1.0 | 1,340 (+14%) | 7mo | $120,000 | $90 | 36 |
| 2224 NW 3rd St | 0.73mi | 3/1.0 | 1,004 (-14%) | 10mo | $86,500 | $86 | 34 |
Match score weights: distance 35% · size 25% · config 20% · recency 20%. Top-matched comps best support the ARV.
Projected returns pro-forma
-3.0% appreciation · 3.04% rent growth · sell at horizon
- IRR
- -1.0%
- Equity multiple
- 0.96×
- Total profit
- $-1,345
- Equity at exit
- $18,638
- IRR
- 8.7%
- Equity multiple
- 1.66×
- Total profit
- $23,196
- Equity at exit
- $10,808
Cash invested: $35,000 (down + closing). Projections, not guarantees.
Landlord ↔ Tenant lean methodology
- Overall (STATE)
- 90 Strongly Landlord-Friendly
- State Alabama
- 90 Strongly Landlord-Friendly · R+15
- County
- — inherits STATE
- City
- — inherits STATE
ZIP-level market 35215
- Home prices YoY
- -34.4%
- Rents YoY
- 3.0%
- Active inventory
- 334
- Price-to-rent
- 7.8×
Monthly cashflow live
- Estimated rent
- $1,328 high interval (Pro) →
- Mortgage (P&I)
- −$656
- Tax from tax record
- −$45 /mo · $541/yr
- Insurance
- −$52
- HOA
- −$0
- Vacancy / Maint / Mgmt
- −$279
- Net cashflow
- $297
Break-even live
UW: 25.0% down · 7.5% · 30yr · 1.5% tax · 5.0% vac · 8.0% maint · 8.0% mgmt
Financing live
Cash to close
- Down payment
- $31,250
- Closing costs
- $3,750
- Reserves months
- —
- Total cash needed
- —
Loan-product check · same deal, 3 products live
Conventional
25% down · 7.5% · 30yr
- Down + closing
- —
- Monthly P&I
- —
- Monthly cashflow
- —
- DSCR
- —
- Eligible?
- —
Personal DTI + credit; lowest rate.
DSCR
20% down · 8.5% · 30yr
- Down + closing
- —
- Monthly P&I
- —
- Monthly cashflow
- —
- DSCR
- —
- Eligible?
- —
No personal income docs; deal must DSCR.
Hard money
10% down · 12.0% · 12mo
- Down + closing
- —
- Monthly P&I
- —
- Monthly cashflow
- —
- DSCR
- —
- Eligible?
- —
Short-term bridge; refi at stabilization.
Rent comps 40 comps
| Address | Beds | Baths | Sqft | Rent | $/sqft | DOM | Units | Dist |
|---|---|---|---|---|---|---|---|---|
| 127 Fox Hill Ct Center Point, AL | 3.0 | 2.0 | 1418 | $1,545 | $1.09 | 43d | 1 | 0.15mi |
| 109 24th Ave NW Center Point, AL | 3.0 | 1.5 | 1023 | $1,215 | $1.19 | 43d | 1 | 0.27mi |
| 2629 Wood Dr NE Center Point, AL | 3.0 | 1.0 | 1203 | $1,250 | $1.04 | 43d | 1 | 0.35mi |
| 2537 3rd St NE Center Point, AL | 3.0 | 2.0 | 1040 | $1,350 | $1.30 | 23d | 1 | 0.45mi |
| 2318 Raintree Ct Center Point, AL | 2.0 | 1.0 | 975 | $1,100 | $1.13 | 2d | 2 | 0.48mi |
| 408 Sunhill Rd NW Center Point, AL | 3.0 | 1.5 | 1290 | $1,355 | $1.05 | 43d | 1 | 0.51mi |
| 2324 3rd St NE Center Point, AL | 3.0 | 2.0 | 1329 | $1,300 | $0.98 | 23d | 1 | 0.52mi |
| 3309 Chase Ln Unit 3309 Birmingham, AL | 2.0 | 2.0 | 1068 | $1,000 | $0.94 | 43d | 1 | 0.63mi |
| 2416 4th St NW Center Point, AL | 4.0 | 2.0 | 1400 | $1,500 | $1.07 | 23d | 1 | 0.63mi |
| 2412 4th St NW Center Point, AL | 3.0 | 1.0 | 1224 | $1,150 | $0.94 | 16d | 1 | 0.64mi |
| 2245 3rd St NW Center Point, AL | 3.0 | 1.0 | 1156 | $1,100 | $0.95 | 23d | 1 | 0.65mi |
| 232 Glenvalley Ln NW Birmingham, AL | 4.0 | 2.0 | 954 | $1,610 | $1.69 | 3d | 1 | 0.66mi |
| 2323 4th St NW Center Point, AL | 3.0 | 1.0 | 1038 | $1,305 | $1.26 | 3d | 1 | 0.67mi |
| 2245 3rd St NE Center Point, AL | 3.0 | 1.0 | 1150 | $1,100 | $0.96 | 23d | 1 | 0.68mi |
| 319 23rd Ave NW Center Point, AL | 3.0 | 2.0 | 1284 | $1,395 | $1.09 | 43d | 1 | 0.69mi |
| 202 Westchester Dr Birmingham, AL | 4.0 | 2.0 | 1374 | $1,300 | $0.95 | 23d | 1 | 0.70mi |
| 2613 5th St NW Center Point, AL | 3.0 | 1.0 | 1170 | $1,150 | $0.98 | 11d | 1 | 0.72mi |
| 3073 Panorama E Birmingham, AL | 1.0–3.0 | 1.0–2.0 | 975 | $1,275 | $1.31 | 1d | 20 | 0.74mi |
| 332 23rd Ave NE Center Point, AL | 3.0 | 1.0 | 1100 | $1,350 | $1.23 | 3d | 1 | 0.74mi |
| 2229 3rd St NE Center Point, AL | 3.0 | 1.0 | 1215 | $1,125 | $0.93 | 23d | 1 | 0.76mi |
| 2320 5th St NW Center Point, AL | 3.0 | 1.0 | 1098 | $1,150 | $1.05 | 43d | 1 | 0.78mi |
| 2708 7th St NE Center Point, AL | 3.0 | 1.0 | 1451 | $1,150 | $0.79 | 43d | 1 | 0.84mi |
| 124 21st Ave NE Unit 202 Center Point, AL | 2.0 | 1.0 | 830 | $750 | $0.90 | 16d | 1 | 0.89mi |
| 123 21st Ave NE Center Point, AL | 2.0 | 1.0 | 850 | $800 | $0.94 | 43d | 1 | 0.94mi |
| 2249 4th Place Cir NE Center Point, AL | 3.0 | 1.5 | 1400 | $1,400 | $1.00 | 43d | 1 | 0.94mi |
| 401 22nd Ave NE Center Point, AL | 2.0 | 1.5 | 850 | $745 | $0.88 | 16d | 1 | 0.96mi |
| 2109 Whetstone Ct Center Point, AL | 2.0 | 1.5 | 800 | $675 | $0.84 | 3d | 1 | 0.99mi |
| 424 Tupelo Way Center Point, AL | 4.0 | 2.0 | 1233 | $1,300 | $1.05 | 43d | 1 | 1.04mi |
| 107 Sterling Ct NW Center Point, AL | 2.0 | 1.5–2.0 | 1026 | $1,062 | $1.04 | 3d | 4 | 1.09mi |
| 1905 2nd St NW Center Point, AL | 3.0 | 1.0 | 1258 | $1,395 | $1.11 | 43d | 1 | 1.14mi |
| 113 19th Ave NW Center Point, AL | 3.0 | 2.0 | 1407 | $1,250 | $0.89 | 11d | 1 | 1.18mi |
| 509 20th Ave NE Center Point, AL | 3.0 | 1.5 | 1008 | $1,200 | $1.19 | 23d | 1 | 1.26mi |
| 305 18th Ct NW Center Point, AL | 3.0 | 1.5 | 1270 | $1,100 | $0.87 | 43d | 1 | 1.27mi |
| 149 Martin Dr Birmingham, AL | 3.0 | 2.0 | 1164 | $1,485 | $1.28 | 23d | 1 | 1.31mi |
| 5992 Princess Blvd Birmingham, AL | 3.0 | 2.0 | 1454 | $1,661 | $1.14 | 43d | 1 | 1.36mi |
| 405 18th Ave NW Center Point, AL | 3.0 | 2.0 | 1162 | $1,299 | $1.12 | 43d | 1 | 1.40mi |
| 856 Parkbrook Trl Birmingham, AL | 1.0–3.0 | 1.0–2.0 | 925 | $1,180 | $1.28 | 2d | 10 | 1.41mi |
| 1720 2nd St NE Center Point, AL | 3.0 | 2.0 | 1100 | $1,400 | $1.27 | 43d | 1 | 1.45mi |
| 2415 Ormond Dr Center Point, AL | 3.0 | 1.5 | 1194 | $1,295 | $1.08 | 43d | 1 | 1.46mi |
| 212 Saint John Dr NW Birmingham, AL | 2.0 | 2.0 | 1445 | $1,423 | $0.98 | 14d | 1 | 1.48mi |
Listing history 17 events
-
2026-06-18days on market $125,000 Active 35 DOM
-
2026-06-17days on market $125,000 Active 34 DOM
-
2026-06-16days on market $125,000 Active 33 DOM
-
2026-06-15days on market $125,000 Active 32 DOM
-
2026-06-13days on market $125,000 Active 30 DOM
-
2026-06-10days on market $125,000 Active 27 DOM
-
2026-06-09days on market $125,000 Active 26 DOM
-
2026-06-08days on market $125,000 Active 25 DOM
-
2026-06-07days on market $125,000 Active 24 DOM
-
2026-06-03days on market $125,000 Active 20 DOM
-
2026-06-02days on market $125,000 Active 19 DOM
-
2026-06-01days on market $125,000 Active 18 DOM
-
2026-05-31days on market $125,000 Active 17 DOM
-
2026-05-13$125,000 Active 574-char remark
-
2025-07-30price $129,900
-
2022-12-27soldstatus $68,000
-
2007-07-30soldstatus $45,000
ⓘ Source: listings_history table (triggers on properties + properties_extension) + one-shot
backfill from property_details.listing_events for pre-trigger history.
Tax reassessment forecast AL · Resets to sale price
- Current annual tax
- $541 · $45/mo
- Projected year-2 tax
- $541 · $45/mo
- Expected delta
- $0/yr ($0/mo · 0.0%)
ⓘ Screening estimate from a state-policy table — verify with the county assessor before closing.
Climate risk First Street
- Flood 1/10 Low FEMA zone X (unshaded) · 0% chance over 30 yrs
- Wildfire 3/10 Moderate
- Heat 5/10 Major 7 d/yr ≥106°F today · 18 d/yr by 30 yrs out
- Wind 6/10 Major 27% chance of damaging wind over 30 yrs
- Air quality 5/10 Major 6 unhealthy d/yr today · 11 by 30 yrs out
Nearby sold comps map
Loading sold comps map…
Walkable amenities ~0.75 mi
Loading nearby amenities…
Taxation est. · year 1
- Rental income
- $15,942
- − Mortgage interest
- −$7,002
- − Property taxes
- −$541
- − Insurance
- −$625
- − Repairs & maintenance
- −$1,275
- − Management
- −$1,275
- − Depreciation
- −$3,636
- Taxable income
- $1,587
- Est. tax owed @ 24.0%
- −$381
- After-tax cash flow
- $3,181/yr
For passive investors: Depreciation is non-cash, so a rental often shows a tax loss while cash-flowing — sheltering income. Rental losses are passive: they offset passive income freely, and up to $25,000/yr can offset ordinary (W-2) income if you actively participate and your MAGI is under $100k (phasing out to $0 by $150k); unused losses carry forward. On sale, claimed depreciation is recaptured at up to 25%, and gains may owe capital-gains tax (a 1031 exchange can defer both). Figures are a year-1 estimate at your 24.0% rate — not tax advice; consult a CPA.
Schools (NCES district)
- District
- Jefferson County
- NCES district ID
- 0101920
- Math proficiency
- 9% ▼ -24.00%
- Reading proficiency
- 32% ▼ -5.00%
- Median HH income
- $51,712
- Composite
- 18.4/100
- National rank
- #8937
- State rank
- #104 of 129 in AL
Livability — Center Point
- Score
- 63/100
- State rank
- #193
- US rank
- #15671
Category grades
Schools grade is shown separately in the Schools card above.
Census & demographics
- Census place
- Center Point, AL
- County
- Jefferson County · 527,445 people
- City population
- 22,599
- Metro
- Birmingham-Hoover, AL
- Population (ZIP)
- 43,903
- Household income
- $52,793
- Rent vs Own
- Severe rent burden
- 1729.0
Population outlook (Jefferson County) Hauer SSP2
- Today (2025)
- 669,185 people
- By 2030
- 669,694 · +0.1%
- By 2040
- 661,388 · -1.2%
- By 2050
- 643,086 · -3.9%
- By 2075
- 577,267 · -13.7%
- By 2100
- 474,758 · -29.1%
Race, ethnicity, and origin ACS 2023
- Neighborhood character
- Predominantly Black (75%)
- Race & ethnicity
- Black 75% White 15% Hispanic / Latino 7% Two or more races 3%
- Hispanic origin (detail)
- Mexican 4%
- Common ancestry
- Lithuanian 1% Italian 1% Slovak 1%
- Foreign-born
- 4% · Canada
- Languages at home
- 92% English-only · Spanish 7%
Political lean MEDSL · Jefferson
- 2024 margin
- D (+10.4) · D 54.6% · R 44.2% · Other 1.2%
- 2008→2024 swing
- +5.4pp toward D · 2008: 5.1pp · 2024: 10.4pp
- All cycles
- 2024: D+10.4 2020: D+13.2 2016: D+7.2 2012: D+6.0 2008: D+5.1
Not yet ingested
- Civics
- —
Market trends
- HPI YoY
- ▼ -112.97%
- Current HPI
- 215.0607
- Rent YoY
- ▲ 3.04%
- Metro
- Birmingham-Hoover, AL
- State GDP YoY
- ▲ 2.94%
- F500 in state
- 4
Industry mix (Fortune 500 HQ in AL)
| Industry | F500 HQs | Revenue |
|---|---|---|
| Financial Services | 1 | $8B |
|
||
| Healthcare | 1 | $5B |
|
||
Price history
+177.8% since first listed4 events — show timeline
- 2026-05-13 Listed $125,000 Greater Alabama MLS
- 2025-07-30 Price Changed $129,900 Greater Alabama MLS
- 2022-12-27 Sold (Public Records) $68,000 Public Records
- 2007-07-30 Sold (Public Records) $45,000 Public Records
Property tax history
-4.3%/yrLatest (2025): $541 · +7.7% YoY. Source: county tax records.
Cash-flow waterfall
monthlySold comps — $/sqft
last 12 mo · ≤1 miLoading sold comps…