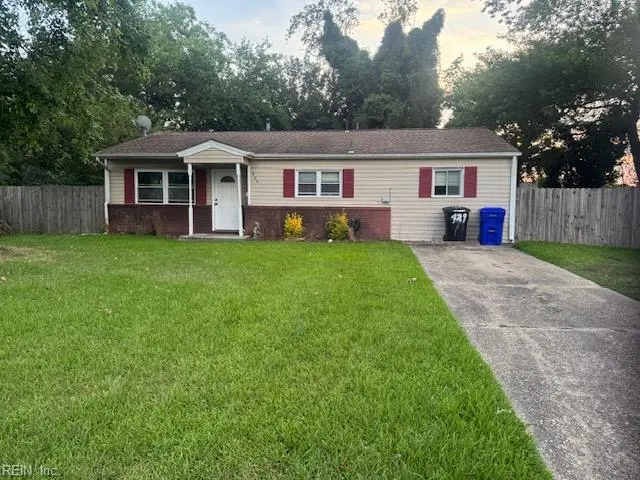
509 Brian Ave · Virginia Beach, VA
Flood risk 1/10 · Minimal
- FEMA flood zone
- X (unshaded)
- Chance of flooding over 30 yrs
- 0.0%
- Est. flood insurance / yr
- $507 – $1,088
Fire risk 1/10 · Minimal
- Est. fire insurance / yr
- $666 – $1,236
Heat risk 9/10 · Severe
- Hot days now (above 105°F)
- 7 days/yr
- Hot days in 30 yrs
- 16 days/yr
Wind risk 8/10 · Major
- Chance of severe wind over 30 yrs
- 95.0%
Air-quality risk 3/10 · Minor
- Unhealthy air days now
- 2 days/yr
- Unhealthy air days in 30 yrs
- 3 days/yr
Risk factors via First Street. Map © Google.
Why this score? — see what drove the D+ grade
The composite is a weighted blend of 9 inputs, each scored 0–100. Each bar is that input's sub-score; the figure is the points it added to the 100-point composite (weight × sub-score).
- ARV discount +14.8/15.0
- Cash flow +10.8/30.0
- Schools +6.4/10.0
- Livability +4.2/5.0
- Rent growth +3.9/5.0
- DSCR +3.1/10.0
- 1% rule +2.6/10.0
- Condition / age +2.5/5.0
- Appreciation +0.0/10.0
$265,000
🖨 Deal sheet 📄 Offer letter ✓ Due diligence
Listing remarks
Short Sale Opportunity! Beautiful 4-bedroom, 1.5-bath home featuring a fenced-in backyard, perfect for outdoor enjoyment, pets, or entertaining. Conveniently located near shopping, public transportation, and interstate access, this home offers both comfort and accessibility. Don’t miss this great opportunity to own a spacious home in a prime location!
Key facts
- Interstate access
- Outdoor enjoyment
- Fenced-in backyard
Tags
Property features AI
Finance
- HOA & community: No HOA fees indicated
Exterior
- Parking: 2 parking spaces; Driveway spaces; Street parking
- Utilities: City/County water; City/County sewer; Electric water heater; Electric power (implied by electric range and water heater)
- Home design: Detached single-family home; Ranch style; One story; Single living level; Simple ownership
- Construction: Asphalt shingle roof; Slab foundation
- Exterior features: Deck; Vinyl siding; Back privacy wood fence
Interior
- Kitchen: Electric range; Dishwasher
- Bedrooms: Master bedroom; Additional bedroom; Bedroom and full bathroom on the first floor
- Flooring: Carpet; Laminate
- Bathrooms: 1 full bathroom; 1 half bathroom
- Heating & cooling: Heat pump; Central air
- Interior features: Ceiling fan
- Laundry & utility: Washer hookup; Dryer hookup; Utility room
Neighborhood map
What this means for you Summary
Snapshot
- This is a 3-bed/1.5-bath single-family listed at $265k.
Deal economics
- At list price, monthly cash flow is $-122 ($-1k/yr) — negative.
- To cash-flow at today's rent, offer at most $243k (8.1% below list).
- To meet the 1% rule (rent ≥ 1% of price), the offer needs to be $201k (24.0% below list).
- Recommended offer: $201k (24.0% below list) — sets the bar for 1% rule.
- Cap rate 5.7% vs local median 3.5% in Virginia Beach — top-decile yield for the area; either an underpriced asset or a hidden risk that comps aren't pricing in. Stress-test before assuming the spread holds.
Location & tenants
- Location reads 83/100 on livability (#38 in VA, #880 nationally) — a professional / high-income tenant draw. Strengths: amenities A+, employment A+, housing A+; Watch: cost of living C-, commute F.
- Va Beach City Public School District (urban): math 69% / reading 78% proficiency, ranked #10 of 131 in VA (top 8%) — strong family-tenant draw, lease renewals of 3-5y typical.
- Zoned schools: Pembroke Elementary (math 68% / reading 70%, grade A-, #351 of 1,108 statewide, top 32%, 522 students, 71% FRL); Bayside High (math 63% / reading 75%, grade B, #170 of 319 statewide, top 55%, 1,983 students, 65% FRL) — zoned schools average 68% FRL vs 28% district-wide (40 pts higher); higher-poverty schools than district average — tighter screening recommended.
- Market conditions: Rents rising fast (+5.6%/yr); 220 active listings in the ZIP; 40 comparable units currently listed for rent nearby; rentals at typical pace (median 16d on market — plan ~3-4 weeks tenant-placement turnaround); 666 units permitted in Virginia Beach city in 2024 (347 in 5+ unit buildings).
- This rent runs 35% of the median local income ($69k/yr) — at the standard rent-burdened threshold; future hikes will face affordability resistance.
Forward outlook
- Local home prices are declining (-3.0%/yr); year-one equity from $2k of loan paydown is wiped out by about $8k of value loss. Plan a longer hold.
- Virginia Beach County population projected at +6% by 2050 — modest demand growth; plan on rents tracking national, not racing it.
Negotiation context
- Only 1 days on market — expect competitive offers; lowballing is unlikely to land.
- 2 sale attempts since 4y ago with the ask held roughly flat each time — persistent listings suggest the price (not the market) is what's stuck; bring a comps-based counter.
Risks & watch-outs
- Climate carrying-cost: severe wind risk, 95% chance of damaging wind over 30y; extreme-heat days projected 7→16/yr by 2055 (HVAC capex compounding) — expect insurance premiums to compound above CPI over the hold.
Questions for the listing agent
- What do current leases actually rent for vs. the listed asking? Can we see a recent rent roll and the last 12 months of T-12 income?
- Built in 1960 — when were the roof, HVAC, electrical panel, plumbing, and water heater last replaced?
- Is there a deadline driving the sale (1031 exchange, divorce, estate, relocation)? That informs how much negotiation room exists.
- Schools are A-rated — typically a magnet for longer-tenancy family renters. What's the average tenant stay here, and is there a school-zone premium baked into asking?
- The area grade is low — what's the realistic commute time and amenity access for the typical tenant pool here? Any planned neighborhood developments (good or bad) we should know about?
- What's the average days-on-market for RENTAL listings here right now (not sales)? A rising rental-DOM trend means longer vacancies and softer asking-rent achievability than the comps imply.
- What's the recent tenant-quality profile in this submarket — average credit score on applications, eviction rate, late-payment / NSF rate, and stable-employment percentage? A property-management company in the area should have these aggregated.
- How much new for-sale + rental construction is in the pipeline within 1–3 miles? Heavy new supply typically softens prices + rents 12–24 months out; constrained supply supports both.
Investment metrics
- 1% rule
- 0.76% ✗
- Cap rate
- 5.74%
- Cash-on-cash
- -1.98%
- DSCR
- 0.91
- GRM
- 11.0
CMA / ARV
- ARV (on-the-fly)
- $316,386
- Comps found
- 12
Show comp detail 12 sales within ~0.75 mi
| Address | Dist | Beds/Ba | Sqft | Sold | Price | $/sf | Match |
|---|---|---|---|---|---|---|---|
| 412 Southgate Ave | 0.34mi | 3/1.5 | 1,163 (+3%) | 1mo | $235,000 | $202 | 79 |
| 500 Kellam Rd | 0.49mi | 3/2.0 | 1,200 (+6%) | 5mo | $375,000 | $313 | 61 |
| 4943 Clover St | 0.29mi | 3/1.5 | 1,260 (+11%) | 8mo | $359,000 | $285 | 61 |
| 572 Rose Marie Ave | 0.09mi | 4/2.0 (+1) | 1,300 (+15%) | 5mo | $349,900 | $269 | 60 |
| 608 Birchridge Ct | 0.54mi | 3/2.0 | 1,210 (+7%) | 2mo | $345,000 | $285 | 60 |
| 409 Dorset Ave | 0.34mi | 3/1.0 | 1,014 (-11%) | 9mo | $305,000 | $301 | 57 |
| 5409 Sweetwater Ct | 0.64mi | 2/2.0 (-1) | 1,182 (+4%) | 2mo | $333,500 | $282 | 55 |
| 420 Kellam Rd | 0.57mi | 3/2.0 | 1,200 (+6%) | 9mo | $335,000 | $279 | 54 |
| 636 Bottino Ln | 0.46mi | 4/1.0 (+1) | 1,248 (+10%) | 0mo | $335,000 | $268 | 54 |
| 621 Raff Rd | 0.48mi | 3/2.0 | 1,260 (+11%) | 7mo | $320,000 | $254 | 51 |
| 720 Farnham Ln | 0.64mi | 3/1.0 | 1,272 (+12%) | 9mo | $335,000 | $263 | 40 |
| 336 Aragona Blvd | 0.57mi | 4/1.0 (+1) | 1,301 (+15%) | 6mo | $330,000 | $254 | 37 |
Match score weights: distance 35% · size 25% · config 20% · recency 20%. Top-matched comps best support the ARV.
Projected returns pro-forma
-3.0% appreciation · 5.61% rent growth · sell at horizon
- IRR
- -16.9%
- Equity multiple
- 0.39×
- Total profit
- $-45,337
- Equity at exit
- $39,512
- IRR
- -4.9%
- Equity multiple
- 0.65×
- Total profit
- $-26,176
- Equity at exit
- $22,912
Cash invested: $74,200 (down + closing). Projections, not guarantees.
Landlord ↔ Tenant lean methodology
- Overall (STATE)
- 55 Moderately Landlord-Leaning
- State Virginia
- 55 Moderately Landlord-Leaning · D+2
- County
- — inherits STATE
- City
- — inherits STATE
ZIP-level market 23462
- Rents YoY
- 5.6%
- Active inventory
- 220
- Price-to-rent
- 11.0×
Monthly cashflow live
- Estimated rent
- $2,014 high interval (Pro) →
- Mortgage (P&I)
- −$1,390
- Tax from tax record
- −$213 /mo · $2,558/yr
- Insurance
- −$110
- HOA
- −$0
- Vacancy / Maint / Mgmt
- −$423
- Net cashflow
- $-122
Break-even live
UW: 25.0% down · 7.5% · 30yr · 1.5% tax · 5.0% vac · 8.0% maint · 8.0% mgmt
Financing live
Cash to close
- Down payment
- $66,250
- Closing costs
- $7,950
- Reserves months
- —
- Total cash needed
- —
Loan-product check · same deal, 3 products live
Conventional
25% down · 7.5% · 30yr
- Down + closing
- —
- Monthly P&I
- —
- Monthly cashflow
- —
- DSCR
- —
- Eligible?
- —
Personal DTI + credit; lowest rate.
DSCR
20% down · 8.5% · 30yr
- Down + closing
- —
- Monthly P&I
- —
- Monthly cashflow
- —
- DSCR
- —
- Eligible?
- —
No personal income docs; deal must DSCR.
Hard money
10% down · 12.0% · 12mo
- Down + closing
- —
- Monthly P&I
- —
- Monthly cashflow
- —
- DSCR
- —
- Eligible?
- —
Short-term bridge; refi at stabilization.
Rent comps 40 comps
| Address | Beds | Baths | Sqft | Rent | $/sqft | DOM | Units | Dist |
|---|---|---|---|---|---|---|---|---|
| 512 Featherstone Ct Unit 501-201D Virginia Beach, VA | 2.0 | 1.0 | 897 | $1,549 | $1.73 | 23d | 1 | 0.32mi |
| 512 Featherstone Ct Unit 573F Virginia Beach, VA | 3.0 | 1.0 | 1047 | $1,675 | $1.60 | 23d | 1 | 0.32mi |
| 5161 Weaver Dr Virginia Beach, VA | 2.0–3.0 | 1.0 | 971 | $1,675 | $1.73 | 4d | 4 | 0.38mi |
| 5206 Richard Rd Virginia Beach, VA | 3.0 | 1.5 | 1240 | $1,795 | $1.45 | 21d | 1 | 0.46mi |
| 5212 Richard Rd Virginia Beach, VA | 3.0 | 2.5 | 1372 | $2,100 | $1.53 | 21d | 1 | 0.46mi |
| 337 Dorset Ave Virginia Beach, VA | 3.0 | 1.0 | 1180 | $1,700 | $1.44 | 7d | 1 | 0.46mi |
| 453 Peregrine St Virginia Beach, VA | 2.0 | 1.0 | 994 | $1,500 | $1.51 | 23d | 1 | 0.48mi |
| 449 Peregrine St Virginia Beach, VA | 3.0 | 2.0 | 1400 | $1,995 | $1.43 | 16d | 1 | 0.48mi |
| 4733 Adler Ave Virginia Beach, VA | 3.0 | 1.0 | 1150 | $1,995 | $1.73 | 21d | 1 | 0.55mi |
| 451 Adkins Arch Virginia Beach, VA | 2.0 | 2.0 | 1236 | $1,975 | $1.60 | 4d | 1 | 0.56mi |
| 326 Harrier St Virginia Beach, VA | 3.0 | 1.5 | 1178 | $1,995 | $1.69 | 16d | 1 | 0.58mi |
| 4606 Merrimac Ln Virginia Beach, VA | 2.0 | 2.5 | 1240 | $2,150 | $1.73 | 23d | 1 | 0.80mi |
| 616 Aubrey Dr Virginia Beach, VA | 3.0 | 1.5 | 1266 | $1,995 | $1.58 | 23d | 1 | 0.94mi |
| 912 Southmoor Dr #204 Virginia Beach, VA | 2.0 | 2.0 | 1367 | $1,810 | $1.32 | 12d | 1 | 0.99mi |
| 700 Moraine Ct Virginia Beach, VA | 2.0 | 1.0–1.5 | 754 | $1,750 | $2.32 | 1d | 3 | 1.00mi |
| 920 Southmoor Dr #305 Virginia Beach, VA | 2.0 | 2.0 | 1367 | $1,900 | $1.39 | 17d | 1 | 1.02mi |
| 924 Southmoor Dr #204 Virginia Beach, VA | 2.0 | 2.0 | 1367 | $1,950 | $1.43 | 21d | 1 | 1.03mi |
| 700 Wolftrap Ln Virginia Beach, VA | 2.0 | 2.5 | 1360 | $1,795 | $1.32 | 23d | 1 | 1.05mi |
| 700 Wolftrap Ln Virginia Beach, VA | 2.0 | 2.5 | 1360 | $1,795 | $1.32 | 16d | 1 | 1.05mi |
| 700 Wolftrap Ln Virginia Beach, VA | 2.0 | 3.0 | 1360 | $1,795 | $1.32 | 12d | 1 | 1.05mi |
| 4932 Westgrove Rd Virginia Beach, VA | 4.0 | 2.5 | 1400 | $2,450 | $1.75 | 23d | 1 | 1.05mi |
| 4409 Articles Ln Virginia Beach, VA | 3.0 | 1.5 | 1332 | $2,650 | $1.99 | 2d | 1 | 1.06mi |
| 5517 Lynbrook Lndg Virginia Beach, VA | 3.0 | 2.5 | 1360 | $2,335 | $1.72 | 23d | 1 | 1.07mi |
| 607 Crows Nest Ct Virginia Beach, VA | 2.0 | 1.0 | 700 | $1,700 | $2.43 | 23d | 1 | 1.09mi |
| 608 Spirit Ct Virginia Beach, VA | 2.0 | 1.0 | 866 | $1,875 | $2.17 | 7d | 1 | 1.09mi |
| 814 Gable Way Virginia Beach, VA | 3.0 | 2.5 | 1452 | $2,200 | $1.52 | 23d | 1 | 1.11mi |
| 5516 Seawall Ct Virginia Beach, VA | 2.0–3.0 | 1.0–3.0 | 1125 | $2,421 | $2.15 | 1d | 18 | 1.11mi |
| 5547 Lynbrook Lndg Virginia Beach, VA | 3.0 | 1.0 | 820 | $1,350 | $1.65 | 17d | 1 | 1.12mi |
| 502 Wharf Ct Virginia Beach, VA | 2.0 | 1.0 | 866 | $1,495 | $1.73 | 10d | 1 | 1.13mi |
| 5212 Nuthall Dr #103 Virginia Beach, VA | 2.0 | 2.0 | 1367 | $1,895 | $1.39 | 14d | 1 | 1.15mi |
| 5414 Catina Arch Virginia Beach, VA | 1.0–4.0 | 1.0–1.5 | 866 | $1,997 | $2.31 | 3d | 10 | 1.15mi |
| 825 Crossing Ct Virginia Beach, VA | 1.0–3.0 | 1.0–2.0 | 937 | $2,499 | $2.67 | 23d | 1 | 1.16mi |
| 4857 Westgrove Rd Virginia Beach, VA | 4.0 | 2.0 | 1378 | $2,450 | $1.78 | 3d | 1 | 1.17mi |
| 5300 Warminster Dr #205 Virginia Beach, VA | 2.0 | 2.0 | 1366 | $1,750 | $1.28 | 1d | 1 | 1.19mi |
| 5300 Warminster Dr #205 Virginia Beach, VA | 2.0 | 2.0 | 1366 | $1,795 | $1.31 | 12d | 1 | 1.19mi |
| 5317 Warminster Dr #303 Virginia Beach, VA | 2.0 | 2.0 | 1350 | $1,997 | $1.48 | 21d | 1 | 1.21mi |
| 5619 Summit Arch Virginia Beach, VA | 2.0 | 2.0 | 957 | $1,650 | $1.72 | 4d | 1 | 1.21mi |
| 4556 Columbus St Virginia Beach, VA | 2.0 | 1.0–2.0 | 763 | $2,626 | $3.44 | 3d | 14 | 1.27mi |
| 5441 Greenwich Rd Virginia Beach, VA | 1.0–2.0 | 1.0–2.0 | 1075 | $3,149 | $2.93 | 1d | 13 | 1.28mi |
| 5301 Justin Ct Virginia Beach, VA | 1.0–2.0 | 1.0 | 695 | $1,599 | $2.30 | 23d | 12 | 1.29mi |
Listing history 3 events
-
2026-06-13status $265,000 Under Contract 1 DOM
-
2026-06-10remarks 353-char remark
-
2026-06-10$265,000 Active 1 DOM
ⓘ Source: listings_history table (triggers on properties + properties_extension) + one-shot
backfill from property_details.listing_events for pre-trigger history.
Tax reassessment forecast VA · Resets to sale price
- Current annual tax
- $2,558 · $213/mo
- Projected year-2 tax
- $2,558 · $213/mo
- Expected delta
- $0/yr ($0/mo · 0.0%)
ⓘ Screening estimate from a state-policy table — verify with the county assessor before closing.
Climate risk First Street
- Flood 1/10 Low FEMA zone X (unshaded) · 0% chance over 30 yrs
- Wildfire 1/10 Low
- Heat 9/10 Extreme 7 d/yr ≥105°F today · 16 d/yr by 30 yrs out
- Wind 8/10 Severe 95% chance of damaging wind over 30 yrs
- Air quality 3/10 Moderate 2 unhealthy d/yr today · 3 by 30 yrs out
Nearby sold comps map
Loading sold comps map…
Walkable amenities ~0.75 mi
Loading nearby amenities…
Taxation est. · year 1
- Rental income
- $24,169
- − Mortgage interest
- −$14,844
- − Property taxes
- −$2,558
- − Insurance
- −$1,325
- − Repairs & maintenance
- −$1,933
- − Management
- −$1,933
- − Depreciation
- −$7,709
- Taxable loss
- −$6,134
- Est. tax savings @ 24.0%
- +$1,472
- After-tax cash flow
- $6/yr
For passive investors: Depreciation is non-cash, so a rental often shows a tax loss while cash-flowing — sheltering income. Rental losses are passive: they offset passive income freely, and up to $25,000/yr can offset ordinary (W-2) income if you actively participate and your MAGI is under $100k (phasing out to $0 by $150k); unused losses carry forward. On sale, claimed depreciation is recaptured at up to 25%, and gains may owe capital-gains tax (a 1031 exchange can defer both). Figures are a year-1 estimate at your 24.0% rate — not tax advice; consult a CPA.
Schools (NCES district)
- District
- Va Beach City Public School District
- NCES district ID
- 5103840
- Math proficiency
- 69% ▼ -19.00%
- Reading proficiency
- 78% ▼ -7.00%
- Median HH income
- $66,452
- Composite
- 63.81/100
- National rank
- #594
- State rank
- #10 of 131 in VA
Livability — Virginia Beach
- Score
- 83/100
- State rank
- #38
- US rank
- #880
Category grades
Schools grade is shown separately in the Schools card above.
Census & demographics
- Census place
- Virginia Beach, VA
- County
- Virginia Beach City · 448,227 people
- City population
- 448,227
- Metro
- Virginia Beach-Norfolk-Newport News, VA-NC
- Population (ZIP)
- 66,151
- Household income
- $69,040
- Rent vs Own
- Severe rent burden
- 3906.0
Population outlook (Virginia Beach County) Hauer SSP2
- Today (2025)
- 480,401 people
- By 2030
- 491,221 · +2.3%
- By 2040
- 504,882 · +5.1%
- By 2050
- 508,847 · +5.9%
- By 2075
- 504,831 · +5.1%
- By 2100
- 465,867 · -3.0%
Race, ethnicity, and origin ACS 2023
- Neighborhood character
- Diverse neighborhood (Simpson 0.68)
- Race & ethnicity
- White 45% Black 32% Hispanic / Latino 12% Two or more races 10% Asian 5%
- Hispanic origin (detail)
- Mexican 4% Puerto Rican 3%
- Common ancestry
- Romanian 2% Italian 1% Slovak 1%
- Foreign-born
- 9% · Canada, China, Vietnam
- Languages at home
- 87% English-only · Spanish 6% Tagalog/Filipino 2% Other Asian/Pacific 1%
Political lean MEDSL · Virginia Beach
- 2024 margin
- Toss-up / Even · D 50.7% · R 48.0% · Other 1.3%
- 2008→2024 swing
- +3.4pp toward D · 2008: -0.7pp · 2024: 2.6pp
- All cycles
- 2024: D+2.6 2020: D+5.4 2016: R+4.5 2012: R+2.5 2008: R+0.7
Not yet ingested
- Civics
- —
Market trends
- HPI YoY
- ▼ -269.19%
- Current HPI
- 333.1908
- Rent YoY
- ▲ 5.61%
- Metro
- Virginia Beach-Norfolk-Newport News, VA-NC
- State GDP YoY
- ▲ 2.40%
- F500 in state
- 50
Industry mix (Fortune 500 HQ in VA)
| Industry | F500 HQs | Revenue |
|---|---|---|
| Aerospace / Defense | 4 | $236B |
|
||
| Technology / Defense | 3 | $32B |
|
||
| Financial Services | 2 | $176B |
|
||
| Utilities | 2 | $27B |
|
||
| Insurance | 2 | $25B |
|
||
| Technology | 2 | $15B |
|
||
Price history
+51.4% since first listed6 events — show timeline
- 2026-06-09 Listed $265,000 REINMLS
- 2022-04-22 Sold (Public Records) $260,000 Public Records
- 2022-03-28 Pending — REINMLS
- 2022-03-22 Listed $250,000 REINMLS
- 2012-05-03 Sold (Public Records) $179,900 Public Records
- 2006-07-05 Sold (Public Records) $175,000 Public Records
Property tax history
+5.1%/yrLatest (2025): $2,558 · +2.1% YoY. Source: county tax records.
Cash-flow waterfall
monthlySold comps — $/sqft
last 12 mo · ≤1 miLoading sold comps…