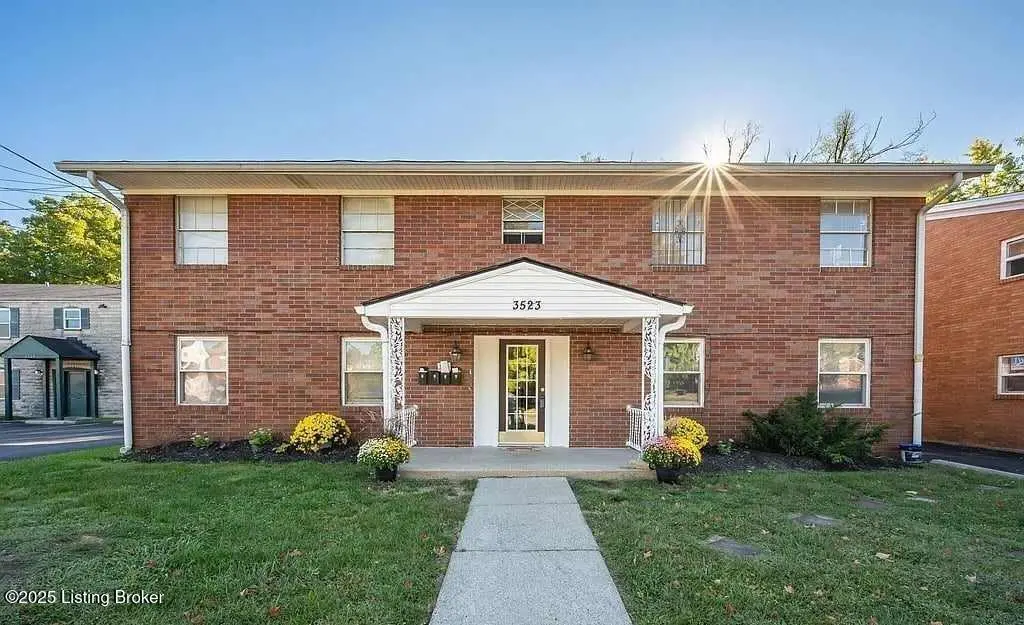
3523 Georgetown Pl #3 · Louisville, KY
Flood risk 5/10 · Moderate
- FEMA flood zone
- X (unshaded)
- Chance of flooding over 30 yrs
- 0.65%
- Est. flood insurance / yr
- $507 – $1,088
Fire risk 1/10 · Minimal
- Est. fire insurance / yr
- $839 – $1,559
Heat risk 5/10 · Moderate
- Hot days now (above 104°F)
- 7 days/yr
- Hot days in 30 yrs
- 19 days/yr
Wind risk 2/10 · Minimal
- Chance of severe wind over 30 yrs
- 1.0%
Air-quality risk 2/10 · Minimal
- Unhealthy air days now
- 1 days/yr
- Unhealthy air days in 30 yrs
- 3 days/yr
Risk factors via First Street. Map © Google.
Why this score? — see what drove the D grade
The composite is a weighted blend of 9 inputs, each scored 0–100. Each bar is that input's sub-score; the figure is the points it added to the 100-point composite (weight × sub-score).
- Cash flow +15.0/30.0
- ARV discount +7.5/15.0
- 1% rule +5.0/10.0
- DSCR +5.0/10.0
- Rent growth +3.8/5.0
- Livability +3.2/5.0
- Condition / age +2.5/5.0
- Schools +2.3/10.0
- Appreciation +0.0/10.0
$850
🖨 Deal sheet 📄 Offer letter ✓ Due diligence
Listing remarks
Welcome to Georgetown Pl! This modern 2 bedroom 1 bath apartment provides the perfect place to be proud to show off, or just retreat and enjoy the quiet. New flooring and paint are just some of the features offered. Tired of going to the laundry mat? We have you covered, with your in-unit washer and dryer. Come see what the Georgetown Community has to offer!
Key facts
- New flooring
- New paint
- 6,832 sq ft lot
Tags
Property features AI
Finance
- Financial info: Second-level unit rent listed as $900 (rental/multi-unit detail)
- HOA & community: No association fee
Exterior
- Parking: Four parking spaces (not covered)
- Utilities: Electricity connected; Natural gas service; Tenant pays cable, electric, gas, sewer, and water; owner pays trash removal
- Home design: Apartment; Single-story count not specified; unit includes a 2nd level; Built in 1967; Pitched shingle roof
- Construction: Wood frame construction
- Exterior features: Sidewalk; No special exterior features listed
Interior
- Kitchen: Range on the 2nd level; Refrigerator on the 2nd level
- Bedrooms: Two bedrooms (both on the 2nd level)
- Bathrooms: One full bathroom (on the 2nd level)
- Heating & cooling: Forced air heating (natural gas); One furnace; Wall/window air conditioning unit(s)
- Interior features: Traditional architectural style; Second level living room
- Laundry & utility: Laundry facility on the property; In-unit laundry on the 2nd level; Separate meters
Neighborhood map
What this means for you Summary
Snapshot
- This is a 2-bed/1.0-bath condo listed at $850.
Deal economics
- At list price, monthly cash flow is $851 ($10k/yr) — positive.
- The deal already cash-flows at list — no discount required.
- Meets the 1% rule at list price ($1k rent vs $850).
- Recommended offer: $837 (1.5% below list) — sets the bar for market timing.
- Cap rate 1207.2% vs local median 5.0% in Louisville — top-decile yield for the area; either an underpriced asset or a hidden risk that comps aren't pricing in. Stress-test before assuming the spread holds.
Location & tenants
- Location reads 63/100 on livability (#333 in KY) — a middle-class / working-renter tenant base. Strengths: cost of living A+, housing A+; Watch: employment C-, health & safety D+, schools D-.
- Jefferson County (urban): math 19% / reading 35% proficiency, ranked #121 of 165 in KY (top 73%) — low school quality limits family demand, transient renter base, plan for 1-2y turnover.
- Market conditions: Rents rising fast (+5.2%/yr); 121 active listings in the ZIP; 40 comparable units currently listed for rent nearby; rentals at typical pace (median 17d on market — plan ~3-4 weeks tenant-placement turnaround); lower-income renter base — watch delinquency; 2,836 units permitted in Jefferson County in 2024 (1,558 in 5+ unit buildings).
Forward outlook
- Local home prices are declining (-3.0%/yr); year-one equity from $6 of loan paydown is wiped out by about $26 of value loss. Plan a longer hold.
- Jefferson County population projected at +13% by 2050 — modest demand growth; plan on rents tracking national, not racing it.
- At projected returns (-3.0% appreciation + 5.2% rent growth), your $238 cash investment doubles in ~1 year — after that, you're playing with house money.
Negotiation context
- It's been on market 15 days — a 2% lower offer ($837) is reasonable based on typical stale-listing flexibility.
Risks & watch-outs
- Climate carrying-cost: moderate flood risk; extreme-heat days projected 7→19/yr by 2055 (HVAC capex compounding) — expect insurance premiums to compound above CPI over the hold.
Questions for the listing agent
- Built in 1967 — when were the roof, HVAC, electrical panel, plumbing, and water heater last replaced?
- Any open or pending special assessments — roof, HVAC, plumbing, elevator, façade? What's the per-unit balance and payoff schedule, and is the seller paying it off at close or rolling it to the buyer?
- Is there a deadline driving the sale (1031 exchange, divorce, estate, relocation)? That informs how much negotiation room exists.
- Schools are D-rated, which usually means shorter tenancies and higher turnover. Who's the typical renter profile here, and what's been the actual vacancy rate?
- Crime grade is F in this area — have there been break-ins, vandalism, or insurance claims at this property in the last 3 years? What carrier currently insures it and at what premium?
- The area grade is low — what's the realistic commute time and amenity access for the typical tenant pool here? Any planned neighborhood developments (good or bad) we should know about?
- What's the average days-on-market for RENTAL listings here right now (not sales)? A rising rental-DOM trend means longer vacancies and softer asking-rent achievability than the comps imply.
- What's the recent tenant-quality profile in this submarket — average credit score on applications, eviction rate, late-payment / NSF rate, and stable-employment percentage? A property-management company in the area should have these aggregated.
- How much new apartment / multifamily construction is in the pipeline within 1–3 miles? Heavy new supply (>2% of stock underway) typically softens rents 12–24 months out; light construction supports rent growth.
Investment metrics
- 1% rule
- 127.55% ✓
- Cap rate
- 1207.19%
- Cash-on-cash
- 4288.92%
- DSCR
- 191.83
- GRM
- 0.1
CMA / ARV
No comps found within radius.
Projected returns pro-forma
-3.0% appreciation · 5.16% rent growth · sell at horizon
- IRR
- —
- Equity multiple
- 238.24×
- Total profit
- $56,463
- Equity at exit
- $127
- IRR
- —
- Equity multiple
- 544.36×
- Total profit
- $129,319
- Equity at exit
- $73
Cash invested: $238 (down + closing). Projections, not guarantees.
Landlord ↔ Tenant lean methodology
- Overall (STATE)
- 83 Strongly Landlord-Friendly
- State Kentucky
- 83 Strongly Landlord-Friendly · R+16
- County
- — inherits STATE
- City
- — inherits STATE
ZIP-level market 40215
- Home prices YoY
- -34.4%
- Rents YoY
- 5.2%
- Active inventory
- 121
- Price-to-rent
- 0.1×
Monthly cashflow live
- Estimated rent
- $1,084 high interval (Pro) →
- Mortgage (P&I)
- −$4
- Tax est. 1.5%
- −$1 /mo · $13/yr
- Insurance
- −$0
- HOA
- −$0
- Vacancy / Maint / Mgmt
- −$228
- Net cashflow
- $851
Break-even live
UW: 25.0% down · 7.5% · 30yr · 1.5% tax · 5.0% vac · 8.0% maint · 8.0% mgmt
Financing live
Cash to close
- Down payment
- $212
- Closing costs
- $26
- Reserves months
- —
- Total cash needed
- —
Loan-product check · same deal, 3 products live
Conventional
25% down · 7.5% · 30yr
- Down + closing
- —
- Monthly P&I
- —
- Monthly cashflow
- —
- DSCR
- —
- Eligible?
- —
Personal DTI + credit; lowest rate.
DSCR
20% down · 8.5% · 30yr
- Down + closing
- —
- Monthly P&I
- —
- Monthly cashflow
- —
- DSCR
- —
- Eligible?
- —
No personal income docs; deal must DSCR.
Hard money
10% down · 12.0% · 12mo
- Down + closing
- —
- Monthly P&I
- —
- Monthly cashflow
- —
- DSCR
- —
- Eligible?
- —
Short-term bridge; refi at stabilization.
Rent comps 40 comps
| Address | Beds | Baths | Sqft | Rent | $/sqft | DOM | Units | Dist |
|---|---|---|---|---|---|---|---|---|
| 3523 Georgetown Pl #3 Louisville, KY | 2.0 | 1.0 | 850 | $850 | $1.00 | 17d | 1 | 0.01mi |
| 3513 Georgetown Pl Unit 3 Louisville, KY | 2.0 | 1.0 | 800 | $949 | $1.19 | 24d | 1 | 0.05mi |
| 1709 Valley Forge Way Unit 2 Louisville, KY | 2.0 | 1.0 | 750 | $895 | $1.19 | 21d | 1 | 0.10mi |
| 1711 Valley Forge Way Unit 4 Louisville, KY | 2.0 | 1.0 | 900 | $949 | $1.05 | 10d | 1 | 0.11mi |
| 3627 Parthenia Ave Louisville, KY | 3.0 | 1.0 | 900 | $1,245 | $1.38 | 24d | 1 | 0.12mi |
| 3524 Georgetown Cir Louisville, KY | 1.0–3.0 | 1.0 | 684 | $1,108 | $1.62 | 24d | 2 | 0.15mi |
| 3524 Georgetown Cir Louisville, KY | 1.0–3.0 | 1.0 | 684 | $1,108 | $1.62 | 15d | 4 | 0.15mi |
| 3524 Georgetown Cir Louisville, KY | 2.0 | 1.0 | 734 | $1,050 | $1.43 | 3d | 1 | 0.15mi |
| 3524 Georgetown Cir Unit 3530 Louisville, KY | 3.0 | 1.0 | 886 | $1,350 | $1.52 | 3d | 1 | 0.15mi |
| 3700 Georgetown Pl Unit 2302-201 Louisville, KY | 2.0 | 1.0 | 800 | $901 | $1.13 | 12d | 1 | 0.23mi |
| 3700 Georgetown Pl Louisville, KY | 2.0 | 1.0 | 800 | $901 | $1.13 | 24d | 1 | 0.23mi |
| 3449 Powell Ave Louisville, KY | 2.0 | 1.0 | 800 | $1,000 | $1.25 | 24d | 1 | 0.24mi |
| 1411 Sale Ave Louisville, KY | 2.0 | 1.0 | 936 | $1,000 | $1.07 | 16d | 1 | 0.37mi |
| 3655 Kahlert Ave Louisville, KY | 2.0 | 1.0 | 915 | $1,300 | $1.42 | 12d | 1 | 0.37mi |
| 3717 Wheeler Ave Louisville, KY | 3.0 | 2.0 | 1124 | $1,450 | $1.29 | 24d | 1 | 0.39mi |
| 3746 Kahlert Ave Louisville, KY | 3.0 | 1.0 | 955 | $1,350 | $1.41 | 16d | 1 | 0.51mi |
| 4000 Churchman Ave Louisville, KY | 3.0 | 1.0 | 1000 | $1,200 | $1.20 | 16d | 1 | 0.62mi |
| 1519 Crums Ln Apt 25 Louisville, KY | 2.0 | 1.0 | 820 | $900 | $1.10 | 24d | 1 | 0.63mi |
| 1519 Crums Ln Louisville, KY | 2.0 | 1.0 | 820 | $888 | $1.08 | 16d | 2 | 0.63mi |
| 1118 W Whitney Ave Louisville, KY | 2.0 | 1.0 | 771 | $1,199 | $1.56 | 24d | 1 | 0.69mi |
| 1111 Dresden Ave Louisville, KY | 2.0 | 1.0 | 680 | $1,100 | $1.62 | 16d | 1 | 0.71mi |
| 1105 Beecher St Louisville, KY | 2.0 | 1.0 | 708 | $1,150 | $1.62 | 16d | 1 | 0.74mi |
| 1022 Stanley Ave Louisville, KY | 2.0 | 1.0 | 700 | $1,200 | $1.71 | 21d | 1 | 0.85mi |
| 4113 La Salle Ave Louisville, KY | 2.0 | 1.0 | 875 | $1,249 | $1.43 | 16d | 1 | 0.85mi |
| 4122 Craig Ave Louisville, KY | 2.0 | 1.0 | 705 | $1,051 | $1.49 | 12d | 1 | 0.85mi |
| 4046 Taylor Blvd Unit 2 Louisville, KY | 2.0 | 1.0 | 800 | $900 | $1.12 | 24d | 1 | 0.93mi |
| 4143 Hillview Ave Unit 5 Louisville, KY | 1.0 | 1.0 | 650 | $895 | $1.38 | 3d | 1 | 1.07mi |
| 3520 Park Row Dr #1 Shively, KY | 1.0 | 1.0 | 800 | $950 | $1.19 | 24d | 1 | 1.08mi |
| 3521 Janell Rd #1 Louisville, KY | 1.0 | 1.0 | 800 | $900 | $1.12 | 24d | 1 | 1.11mi |
| 3521 Janell Rd Louisville, KY | 1.0 | 1.0 | 800 | $900 | $1.12 | 16d | 1 | 1.11mi |
| 1122 Larchmont Ave Unit B Louisville, KY | 2.0 | 1.0 | 864 | $750 | $0.87 | 24d | 1 | 1.13mi |
| 1122 Larchmont Ave Unit B Louisville, KY | 1.0 | 1.0 | 700 | $750 | $1.07 | 17d | 1 | 1.13mi |
| 1122 Larchmont Ave Louisville, KY | 2.0 | 1.0 | 864 | $750 | $0.87 | 16d | 1 | 1.13mi |
| 1637 Thornberry Ave Louisville, KY | 2.0 | 1.0 | 700 | $1,250 | $1.79 | 3d | 1 | 1.17mi |
| 623 Dresden Ave Louisville, KY | 2.0 | 1.0 | 750 | $975 | $1.30 | 16d | 1 | 1.19mi |
| 554 Camden Ave Louisville, KY | 1.0 | 1.0 | 661 | $875 | $1.32 | 24d | 1 | 1.20mi |
| 615 Dresden Ave Louisville, KY | 3.0 | 1.0 | 884 | $1,450 | $1.64 | 24d | 1 | 1.22mi |
| 1305 Larchmont Ave Louisville, KY | 2.0 | 1.0 | 1113 | $1,350 | $1.21 | 16d | 1 | 1.23mi |
| 1726 Sonne Ave Louisville, KY | 2.0 | 1.0 | 820 | $1,095 | $1.34 | 16d | 1 | 1.26mi |
| 1731 Sonne Ave Louisville, KY | 3.0 | 1.0 | 1010 | $1,300 | $1.29 | 16d | 1 | 1.27mi |
HOA detail condo
- Monthly dues
- $0 · $0/yr
- Assessments
- None detected in remarks — confirm with the listing agent.
Listing history 5 events
-
2026-06-02days on market $850 Active 15 DOM
-
2026-06-02price $850 Active 14 DOM
-
2026-06-01days on market $900 Active 14 DOM
-
2026-05-31days on market $900 Active 13 DOM
-
2026-05-18$900 Active
ⓘ Source: listings_history table (triggers on properties + properties_extension) + one-shot
backfill from property_details.listing_events for pre-trigger history.
Climate risk First Street
- Flood 5/10 Major FEMA zone X (unshaded) · 65% chance over 30 yrs
- Wildfire 1/10 Low
- Heat 5/10 Major 7 d/yr ≥104°F today · 19 d/yr by 30 yrs out
- Wind 2/10 Low 100% chance of damaging wind over 30 yrs
- Air quality 2/10 Low 1 unhealthy d/yr today · 3 by 30 yrs out
Nearby sold comps map
Loading sold comps map…
Walkable amenities ~0.75 mi
Loading nearby amenities…
Taxation est. · year 1
- Rental income
- $13,010
- − Mortgage interest
- −$48
- − Property taxes
- −$13
- − Insurance
- −$4
- − Repairs & maintenance
- −$1,041
- − Management
- −$1,041
- − Depreciation
- −$25
- Taxable income
- $10,839
- Est. tax owed @ 24.0%
- −$2,601
- After-tax cash flow
- $7,606/yr
For passive investors: Depreciation is non-cash, so a rental often shows a tax loss while cash-flowing — sheltering income. Rental losses are passive: they offset passive income freely, and up to $25,000/yr can offset ordinary (W-2) income if you actively participate and your MAGI is under $100k (phasing out to $0 by $150k); unused losses carry forward. On sale, claimed depreciation is recaptured at up to 25%, and gains may owe capital-gains tax (a 1031 exchange can defer both). Figures are a year-1 estimate at your 24.0% rate — not tax advice; consult a CPA.
Schools (NCES district)
- District
- Jefferson County
- NCES district ID
- 2102990
- Math proficiency
- 19% ▼ -17.00%
- Reading proficiency
- 35% ▼ -11.00%
- Median HH income
- $47,885
- Composite
- 23.45/100
- National rank
- #7884
- State rank
- #121 of 165 in KY
Livability — Louisville
- Score
- 63/100
- State rank
- #333
- US rank
- #15887
Category grades
Schools grade is shown separately in the Schools card above.
Census & demographics
- Census place
- Louisville, KY
- County
- Jefferson County · 790,184 people
- City population
- 769,292
- Metro
- Louisville/Jefferson County, KY-IN
- Population (ZIP)
- 20,532
- Household income
- $43,725
- Rent vs Own
- Severe rent burden
- 997.0
Population outlook (Jefferson County) Hauer SSP2
- Today (2025)
- 823,112 people
- By 2030
- 849,343 · +3.2%
- By 2040
- 895,696 · +8.8%
- By 2050
- 933,630 · +13.4%
- By 2075
- 1,028,262 · +24.9%
- By 2100
- 1,072,675 · +30.3%
Race, ethnicity, and origin ACS 2023
- Neighborhood character
- Diverse neighborhood (Simpson 0.63)
- Race & ethnicity
- White 51% Black 33% Two or more races 11% Hispanic / Latino 6% Asian 2%
- Hispanic origin (detail)
- Mexican 2% Cuban 3%
- Common ancestry
- Slovak 1% Romanian 1% Serbian 1%
- Foreign-born
- 9% · Canada, Vietnam
- Languages at home
- 88% English-only · Spanish 5% Other Indo-European 2% Arabic 1%
Political lean MEDSL · Jefferson
- 2024 margin
- D (+16.6) · D 57.4% · R 40.9% · Other 1.7%
- 2008→2024 swing
- +4.5pp toward D · 2008: 12.0pp · 2024: 16.6pp
- All cycles
- 2024: D+16.6 2020: D+20.1 2016: D+13.3 2012: D+11.1 2008: D+12.0
Not yet ingested
- Civics
- —
Market trends
- HPI YoY
- ▼ -119.35%
- Current HPI
- 227.8248
- Rent YoY
- ▲ 5.16%
- Metro
- Louisville/Jefferson County, KY-IN
- State GDP YoY
- ▲ 1.81%
- F500 in state
- 4
Industry mix (Fortune 500 HQ in KY)
| Industry | F500 HQs | Revenue |
|---|---|---|
| Healthcare | 1 | $118B |
|
||
| Food / Beverage | 1 | $7B |
|
||
Cash-flow waterfall
monthlySold comps — $/sqft
last 12 mo · ≤1 miLoading sold comps…