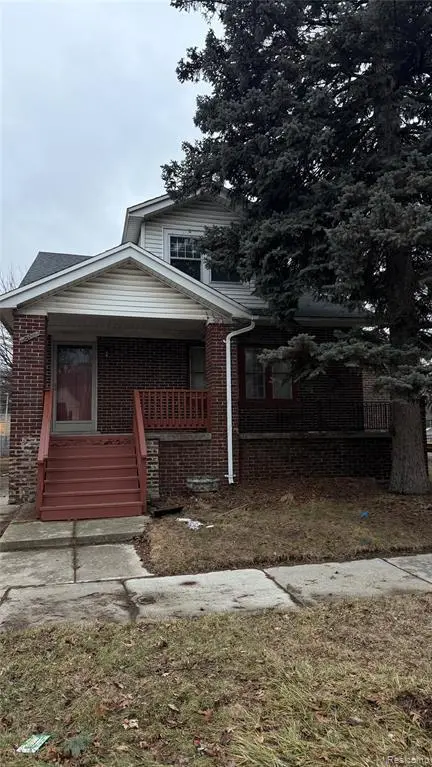
231 W Bennett Ave · Ferndale, MI
Flood risk 1/10 · Minimal
- FEMA flood zone
- X (unshaded)
- Chance of flooding over 30 yrs
- 0.0%
- Est. flood insurance / yr
- $473 – $860
Fire risk 2/10 · Minimal
- Est. fire insurance / yr
- $784 – $1,456
Heat risk 3/10 · Minor
- Hot days now (above 97°F)
- 7 days/yr
- Hot days in 30 yrs
- 15 days/yr
Wind risk 2/10 · Minimal
- Chance of severe wind over 30 yrs
- —
Air-quality risk 4/10 · Minor
- Unhealthy air days now
- 4 days/yr
- Unhealthy air days in 30 yrs
- 6 days/yr
Risk factors via First Street. Map © Google.
Why this score? — see what drove the B grade
The composite is a weighted blend of 9 inputs, each scored 0–100. Each bar is that input's sub-score; the figure is the points it added to the 100-point composite (weight × sub-score).
- Cash flow +30.0/30.0
- 1% rule +10.0/10.0
- DSCR +10.0/10.0
- ARV discount +7.5/15.0
- Livability +4.5/5.0
- Rent growth +4.1/5.0
- Schools +2.5/10.0
- Condition / age +2.5/5.0
- Appreciation +0.0/10.0
$130,000
🖨 Deal sheet 📄 Offer letter ✓ Due diligence
Listing remarks MLS
This home has endless potential! The next lucky owner of this home has the opportunity to truly show the character of this 100-year-old home. With a kitchen, bathroom, and two bedrooms upstairs, this home could easily be rented out as a duplex once updated. You will find hardwood floors on the first floor, built in shelves in the back formal living room and in the first-floor hallway, and a fenced in yard. Subject to court-probate approval. Home being sold as-is. All chattel to stay in the home. Exclusions include record player in living room, and two dressers in dining room.
Key facts
- Built in shelves
- Hardwood floors
- Fenced in yard
Tags
Neighborhood map
What this means for you Summary
Snapshot
- This is a 4-bed/2.0-bath single-family listed at $130k.
Deal economics
- At list price, monthly cash flow is $856 ($10k/yr) — positive.
- The deal already cash-flows at list — no discount required.
- Meets the 1% rule at list price ($2k rent vs $130k).
- Recommended offer: $128k (1.5% below list) — sets the bar for market timing.
- Cap rate 14.2% vs local median 4.5% in Ferndale — top-decile yield for the area; either an underpriced asset or a hidden risk that comps aren't pricing in. Stress-test before assuming the spread holds.
Location & tenants
- Location reads 90/100 on livability (#8 in MI, #103 nationally) — a professional / high-income tenant draw. Strengths: amenities A+, commute A+, employment A+; Watch: schools D+.
- Ferndale Public Schools (suburban): math 18% / reading 39% proficiency, ranked #366 of 540 in MI (top 68%) — low school quality limits family demand, transient renter base, plan for 1-2y turnover.
- Market conditions: Rents rising fast (+6.2%/yr); 171 active listings in the ZIP; 7 comparable units currently listed for rent nearby; rentals at typical pace (median 18d on market — plan ~3-4 weeks tenant-placement turnaround); 43% of comp listings sitting > 30 days — soft ceiling on asking rent; solid renter incomes; 2,614 units permitted in Oakland County in 2024 (721 in 5+ unit buildings).
- This rent runs 31% of the median local income ($90k/yr) — at the standard rent-burdened threshold; future hikes will face affordability resistance.
Forward outlook
- Local home prices are declining (-3.0%/yr); year-one equity from $899 of loan paydown is wiped out by about $4k of value loss. Plan a longer hold.
- Oakland County population projected at +10% by 2050 — modest demand growth; plan on rents tracking national, not racing it.
- At projected returns (-3.0% appreciation + 6.2% rent growth), your $36k cash investment doubles in ~4 years — after that, you're playing with house money.
Negotiation context
- It's been on market 25 days — a 2% lower offer ($128k) is reasonable based on typical stale-listing flexibility.
- 3 sale attempts with the ask held roughly flat each time — persistent listings suggest the price (not the market) is what's stuck; bring a comps-based counter.
Risks & watch-outs
- Watch-outs: built in 1926 — expect roof / HVAC / electrical / plumbing capex.
Questions for the listing agent
- Built in 1926 — when were the roof, HVAC, electrical panel, plumbing, and water heater last replaced?
- Is there a deadline driving the sale (1031 exchange, divorce, estate, relocation)? That informs how much negotiation room exists.
- Schools are D-rated, which usually means shorter tenancies and higher turnover. Who's the typical renter profile here, and what's been the actual vacancy rate?
- What's the average days-on-market for RENTAL listings here right now (not sales)? A rising rental-DOM trend means longer vacancies and softer asking-rent achievability than the comps imply.
- What's the recent tenant-quality profile in this submarket — average credit score on applications, eviction rate, late-payment / NSF rate, and stable-employment percentage? A property-management company in the area should have these aggregated.
- How much new for-sale + rental construction is in the pipeline within 1–3 miles? Heavy new supply typically softens prices + rents 12–24 months out; constrained supply supports both.
Investment metrics
- 1% rule
- 1.81% ✓
- Cap rate
- 14.20%
- Cash-on-cash
- 28.23%
- DSCR
- 2.26
- GRM
- 4.6
CMA / ARV
- ARV (on-the-fly)
- $285,444
- Comps found
- 12
Show comp detail 12 sales within ~0.75 mi
| Address | Dist | Beds/Ba | Sqft | Sold | Price | $/sf | Match |
|---|---|---|---|---|---|---|---|
| 287 Fielding. St | 0.21mi | 3/2.5 (-1) | 1,762 (0%) | 3mo | $331,000 | $188 | 80 |
| 2548 Woodstock Dr | 0.12mi | 4/2.5 | 1,997 (+13%) | 4mo | $237,000 | $119 | 67 |
| 370 Channing St | 0.40mi | 3/1.0 (-1) | 1,821 (+3%) | 2mo | $295,000 | $162 | 65 |
| 19960 Lichfield Rd | 0.56mi | 3/1.5 (-1) | 1,755 (-0%) | 4mo | $230,000 | $131 | 63 |
| 378 Fielding St | 0.28mi | 3/2.0 (-1) | 1,594 (-10%) | 7mo | $203,400 | $128 | 60 |
| 233 Silman St | 0.35mi | 3/2.0 (-1) | 1,970 (+12%) | 0mo | $382,000 | $194 | 58 |
| 19939 Lichfield Rd | 0.59mi | 3/2.0 (-1) | 1,801 (+2%) | 8mo | $370,000 | $205 | 58 |
| 770 Meadowdale St | 0.70mi | 3/1.0 (-1) | 1,779 (+1%) | 0mo | $260,000 | $146 | 57 |
| 398 W Hazelhurst St | 0.74mi | 3/1.5 (-1) | 1,784 (+1%) | 4mo | $317,500 | $178 | 53 |
| 615 E Webster St | 0.40mi | 3/1.0 (-1) | 1,580 (-10%) | 4mo | $195,000 | $123 | 52 |
| 335 Laprairie St | 0.45mi | 3/1.0 (-1) | 1,553 (-12%) | 1mo | $236,000 | $152 | 50 |
| 559 Gardendale St | 0.68mi | 3/2.0 (-1) | 1,530 (-13%) | 7mo | $325,000 | $212 | 36 |
Match score weights: distance 35% · size 25% · config 20% · recency 20%. Top-matched comps best support the ARV.
Projected returns pro-forma
-3.0% appreciation · 6.24% rent growth · sell at horizon
- IRR
- 26.3%
- Equity multiple
- 2.14×
- Total profit
- $41,517
- Equity at exit
- $19,383
- IRR
- 36.0%
- Equity multiple
- 4.89×
- Total profit
- $141,608
- Equity at exit
- $11,240
Cash invested: $36,400 (down + closing). Projections, not guarantees.
Landlord ↔ Tenant lean methodology
- Overall (STATE)
- 62 Landlord-Friendly
- State Michigan
- 62 Landlord-Friendly · EVEN
- County
- — inherits STATE
- City
- — inherits STATE
ZIP-level market 48220
- Rents YoY
- 6.2%
- Active inventory
- 171
- Price-to-rent
- 4.6×
Monthly cashflow live
- Estimated rent
- $2,358 high interval (Pro) →
- Mortgage (P&I)
- −$682
- Tax from tax record
- −$270 /mo · $3,242/yr
- Insurance
- −$54
- HOA
- −$0
- Vacancy / Maint / Mgmt
- −$495
- Net cashflow
- $856
Break-even live
UW: 25.0% down · 7.5% · 30yr · 1.5% tax · 5.0% vac · 8.0% maint · 8.0% mgmt
Financing live
Cash to close
- Down payment
- $32,500
- Closing costs
- $3,900
- Reserves months
- —
- Total cash needed
- —
Loan-product check · same deal, 3 products live
Conventional
25% down · 7.5% · 30yr
- Down + closing
- —
- Monthly P&I
- —
- Monthly cashflow
- —
- DSCR
- —
- Eligible?
- —
Personal DTI + credit; lowest rate.
DSCR
20% down · 8.5% · 30yr
- Down + closing
- —
- Monthly P&I
- —
- Monthly cashflow
- —
- DSCR
- —
- Eligible?
- —
No personal income docs; deal must DSCR.
Hard money
10% down · 12.0% · 12mo
- Down + closing
- —
- Monthly P&I
- —
- Monthly cashflow
- —
- DSCR
- —
- Eligible?
- —
Short-term bridge; refi at stabilization.
Rent comps 7 comps
| Address | Beds | Baths | Sqft | Rent | $/sqft | DOM | Units | Dist |
|---|---|---|---|---|---|---|---|---|
| 2554 Woodstock Dr Highland Park, MI | 3.0 | 1.5 | 1929 | $2,250 | $1.17 | 14d | 1 | 0.13mi |
| 351 Edgewood Pl Unit 2 Ferndale, MI | 3.0 | 2.0 | 1600 | $2,200 | $1.38 | 18d | 1 | 0.29mi |
| 1330 E Chesterfield St Ferndale, MI | 4.0 | 2.0 | 1795 | $2,800 | $1.56 | 1d | 1 | 0.78mi |
| 320 E Troy St Ferndale, MI | 4.0 | 2.0 | 1627 | $2,200 | $1.35 | 43d | 1 | 0.90mi |
| 329 W Muir Ave Hazel Park, MI | 4.0 | 2.0 | 1606 | $2,000 | $1.25 | 10d | 1 | 1.03mi |
| 631 Shasta Pl Ferndale, MI | 3.0 | 2.0 | 1317 | $2,100 | $1.59 | 43d | 1 | 1.03mi |
| 574 W Golden Gate Highland Park, MI | 3.0 | 1.0 | 1315 | $1,300 | $0.99 | 43d | 1 | 1.50mi |
Listing history 8 events
-
2026-04-28status Pending 582-char remark
Show marketing remark (582 chars)
This home has endless potential! The next lucky owner of this home has the opportunity to truly show the character of this 100-year-old home. With a kitchen, bathroom, and two bedrooms upstairs, this home could easily be rented out as a duplex once updated. You will find hardwood floors on the first floor, built in shelves in the back formal living room and in the first-floor hallway, and a fenced in yard. Subject to court-probate approval. Home being sold as-is. All chattel to stay in the home. Exclusions include record player in living room, and two dressers in dining room.
-
2026-04-28status Pending
Show marketing remark (582 chars)
This home has endless potential! The next lucky owner of this home has the opportunity to truly show the character of this 100-year-old home. With a kitchen, bathroom, and two bedrooms upstairs, this home could easily be rented out as a duplex once updated. You will find hardwood floors on the first floor, built in shelves in the back formal living room and in the first-floor hallway, and a fenced in yard. Subject to court-probate approval. Home being sold as-is. All chattel to stay in the home. Exclusions include record player in living room, and two dressers in dining room.
-
2026-04-03$130,000 Active 582-char remark
Show marketing remark (582 chars)
This home has endless potential! The next lucky owner of this home has the opportunity to truly show the character of this 100-year-old home. With a kitchen, bathroom, and two bedrooms upstairs, this home could easily be rented out as a duplex once updated. You will find hardwood floors on the first floor, built in shelves in the back formal living room and in the first-floor hallway, and a fenced in yard. Subject to court-probate approval. Home being sold as-is. All chattel to stay in the home. Exclusions include record player in living room, and two dressers in dining room.
-
2026-04-03$130,000 Active
Show marketing remark (582 chars)
This home has endless potential! The next lucky owner of this home has the opportunity to truly show the character of this 100-year-old home. With a kitchen, bathroom, and two bedrooms upstairs, this home could easily be rented out as a duplex once updated. You will find hardwood floors on the first floor, built in shelves in the back formal living room and in the first-floor hallway, and a fenced in yard. Subject to court-probate approval. Home being sold as-is. All chattel to stay in the home. Exclusions include record player in living room, and two dressers in dining room.
-
2026-03-10historical
-
2026-03-10historical
-
2026-03-10$104,500
-
2026-03-10historical
ⓘ Source: listings_history table (triggers on properties + properties_extension) + one-shot
backfill from property_details.listing_events for pre-trigger history.
Tax reassessment forecast MI · Partial reset (capped growth)
- Current annual tax
- $3,242 · $270/mo
- Projected year-2 tax
- $3,242 · $270/mo
- Expected delta
- $0/yr ($0/mo · 0.0%)
ⓘ Screening estimate from a state-policy table — verify with the county assessor before closing.
Climate risk First Street
- Flood 1/10 Low FEMA zone X (unshaded) · 0% chance over 30 yrs
- Wildfire 2/10 Low
- Heat 3/10 Moderate 7 d/yr ≥97°F today · 15 d/yr by 30 yrs out
- Wind 2/10 Low
- Air quality 4/10 Moderate 4 unhealthy d/yr today · 6 by 30 yrs out
Nearby sold comps map
Loading sold comps map…
Walkable amenities ~0.75 mi
Loading nearby amenities…
Taxation est. · year 1
- Rental income
- $28,291
- − Mortgage interest
- −$7,282
- − Property taxes
- −$3,242
- − Insurance
- −$650
- − Repairs & maintenance
- −$2,263
- − Management
- −$2,263
- − Depreciation
- −$3,782
- Taxable income
- $8,809
- Est. tax owed @ 24.0%
- −$2,114
- After-tax cash flow
- $8,163/yr
For passive investors: Depreciation is non-cash, so a rental often shows a tax loss while cash-flowing — sheltering income. Rental losses are passive: they offset passive income freely, and up to $25,000/yr can offset ordinary (W-2) income if you actively participate and your MAGI is under $100k (phasing out to $0 by $150k); unused losses carry forward. On sale, claimed depreciation is recaptured at up to 25%, and gains may owe capital-gains tax (a 1031 exchange can defer both). Figures are a year-1 estimate at your 24.0% rate — not tax advice; consult a CPA.
Schools (NCES district)
- District
- Ferndale Public Schools
- NCES district ID
- 2614280
- Math proficiency
- 18% ▼ -3.00%
- Reading proficiency
- 39% ▲ 5.00%
- Median HH income
- $56,069
- Composite
- 25.46/100
- National rank
- #7449
- State rank
- #366 of 540 in MI
Livability — Ferndale
- Score
- 90/100
- State rank
- #8
- US rank
- #103
Category grades
Schools grade is shown separately in the Schools card above.
Census & demographics
- Census place
- Ferndale, MI
- County
- Oakland County · 1,009,092 people
- City population
- 21,527
- Metro
- Detroit-Warren-Dearborn, MI
- Population (ZIP)
- 21,527
- Household income
- $89,881
- Rent vs Own
- Severe rent burden
- 670.0
Population outlook (Oakland County) Hauer SSP2
- Today (2025)
- 1,335,747 people
- By 2030
- 1,375,100 · +2.9%
- By 2040
- 1,435,385 · +7.5%
- By 2050
- 1,469,250 · +10.0%
- By 2075
- 1,531,946 · +14.7%
- By 2100
- 1,450,485 · +8.6%
Race, ethnicity, and origin ACS 2023
- Neighborhood character
- Predominantly White (72%)
- Race & ethnicity
- White 72% Black 15% Two or more races 6% Hispanic / Latino 5% Asian 3%
- Common ancestry
- Romanian 11% Lithuanian 6% Slovak 3%
- Foreign-born
- 4% · Canada, South Korea
- Languages at home
- 95% English-only · Spanish 2% Other Indo-European 1% German/W. Germanic 1%
Political lean MEDSL · Oakland
- 2024 margin
- D (+10.6) · D 54.4% · R 43.8% · Other 1.9%
- 2008→2024 swing
- -3.9pp toward R · 2008: 14.5pp · 2024: 10.6pp
- All cycles
- 2024: D+10.6 2020: D+14.1 2016: D+8.1 2012: D+8.1 2008: D+14.5
Not yet ingested
- Civics
- —
Market trends
- HPI YoY
- ▼ -394.92%
- Current HPI
- 273.0986
- Rent YoY
- ▲ 6.24%
- Metro
- Detroit-Warren-Dearborn, MI
- State GDP YoY
- ▲ 1.37%
- F500 in state
- 28
Industry mix (Fortune 500 HQ in MI)
| Industry | F500 HQs | Revenue |
|---|---|---|
| Automotive Parts | 3 | $48B |
|
||
| Automotive | 2 | $372B |
|
||
| Chemicals | 1 | $45B |
|
||
| Automotive Retail | 1 | $29B |
|
||
| Healthcare / Medical Devices | 1 | $23B |
|
||
| Automotive Technology | 1 | $20B |
|
||
Price history
+24.4% since first listed8 events — show timeline
- 2026-04-28 Pending — MiRealSource-MiMLS
- 2026-04-28 Pending — REALCOMP
- 2026-04-03 Listed $130,000 REALCOMP
- 2026-04-03 Listed $130,000 MiRealSource-MiMLS
- 2026-03-10 Listing Removed — MiRealSource-MiMLS
- 2026-03-10 Listed $104,500 MiRealSource-MiMLS
- 2026-03-10 Listing Removed — MiRealSource-MiMLS
- 2026-03-10 Listing Removed — REALCOMP
Property tax history
+1.7%/yrLatest (2025): $3,242 · +2.0% YoY. Source: county tax records.
Cash-flow waterfall
monthlySold comps — $/sqft
last 12 mo · ≤1 miLoading sold comps…