 Multi-family
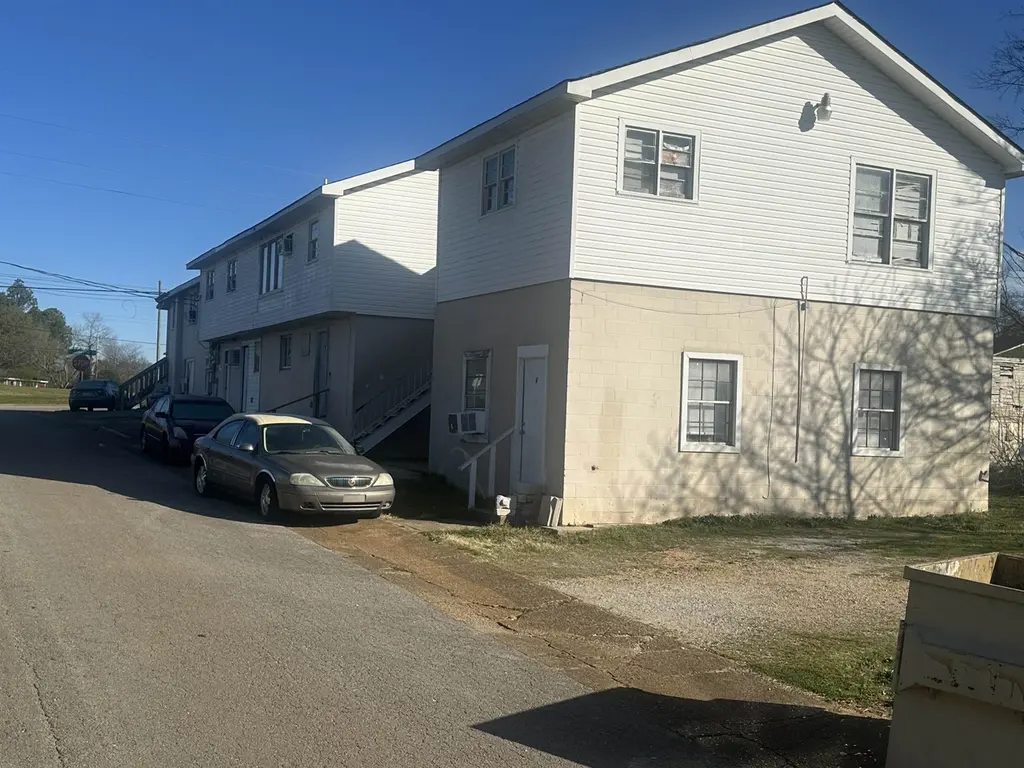
3202 Huntsville Rd · Florence, AL
Flood risk No data
- FEMA flood zone
- —
- Chance of flooding over 30 yrs
- —
- Est. flood insurance / yr
- —
Fire risk No data
- Est. fire insurance / yr
- —
Heat risk No data
- Hot days now (above threshold)
- —
- Hot days in 30 yrs
- —
Wind risk No data
- Chance of severe wind over 30 yrs
- —
Air-quality risk No data
- Unhealthy air days now
- —
- Unhealthy air days in 30 yrs
- —
Risk factors via First Street. Map © Google.
Why this score? — see what drove the C+ grade
The composite is a weighted blend of 9 inputs, each scored 0–100. Each bar is that input's sub-score; the figure is the points it added to the 100-point composite (weight × sub-score).
- Cash flow +24.8/30.0
- DSCR +8.0/10.0
- ARV discount +7.5/15.0
- 1% rule +6.4/10.0
- Livability +4.1/5.0
- Rent growth +4.0/5.0
- Schools +3.0/10.0
- Condition / age +2.2/5.0
- Appreciation +0.0/10.0
$785,000
🖨 Deal sheet 📄 Offer letter ✓ Due diligence
Multi-family units
County records classify this as Multi-Family (5+ Unit). Listing-text estimate: 1 unit. estimate disagrees with records
5+ unit building — per-unit beds/baths from public records are typically unavailable; the breakdown below (if shown) is an estimate from the listing text.
Listing remarks MLS
Architectural Roof installed 2024. Refrigerators and stoves in each unit Flooring is Mostly Vinyl Plank 5 - 1 bedroom Apts: The newest lease is $650. The other 4 are currently renting for $450. There is also 5 - 2 Bedroom Apts Rents 475 - 550. 3 rent for $475, 1 rents for $550, and 1 rents for $650 depending on when they move in. Some renters that have been there for a while are paying the lower rent Parking on two sides of building and street parking Water Provided under $200 monthly Built on Slab. part built in 1980 part in 1986 Wired Smoke Detectors. 2 bedroom house next door is can be a possible purchase also along with the Apartments but not able to purchase separate.
Key facts
- Parking on two sides
- Built on slab
- Water provided
Tags
Neighborhood map
What this means for you Summary
Snapshot
- This is a multifamily listed at $785k. Condition is rated fair.
Deal economics
- At list price, monthly cash flow is $2k ($20k/yr) — positive.
- The deal already cash-flows at list — no discount required.
- Meets the 1% rule at list price ($9k rent vs $785k).
- Recommended offer: $761k (3.0% below list) — sets the bar for market timing.
- Cap rate 8.8% vs local median 3.6% in Florence — top-decile yield for the area; either an underpriced asset or a hidden risk that comps aren't pricing in. Stress-test before assuming the spread holds.
Location & tenants
- Location reads 82/100 on livability (#4 in AL, #1,140 nationally) — a professional / high-income tenant draw. Strengths: amenities A+, commute A+, cost of living A+; Watch: crime F, employment F.
- Florence City (urban): math 28% / reading 44% proficiency, ranked #44 of 129 in AL (top 34%) — families likely to look elsewhere, expect single-tenant / working-renter base with shorter leases.
- Market conditions: Rents rising fast (+6.2%/yr); 268 active listings in the ZIP; 164 units permitted in Lauderdale County in 2024 (72 in 5+ unit buildings).
- At $8,975/mo this rent would consume 233% of the median local household income ($46k/yr) (locally 1516% of renters already pay >50% of income on rent) — very limited rent-growth headroom before tenants either downsize or default.
Forward outlook
- Local home prices are declining (-3.0%/yr); year-one equity from $5k of loan paydown is wiped out by about $24k of value loss. Plan a longer hold.
- At projected returns (-3.0% appreciation + 6.2% rent growth), your $220k cash investment doubles in ~9 years — after that, you're playing with house money.
Negotiation context
- It's been on market 39 days — a 3% lower offer ($761k) is reasonable based on typical stale-listing flexibility.
- 2 sale attempts with the ask held roughly flat each time — persistent listings suggest the price (not the market) is what's stuck; bring a comps-based counter.
Questions for the listing agent
- It's been on market 39 days. Have you received any prior offers? Is the seller open to a 3% concession, seller financing, or rate buy-down credit?
- Have any recent inspections been done? Can we get a copy of the seller's disclosures and any deferred-maintenance estimates?
- Is there a deadline driving the sale (1031 exchange, divorce, estate, relocation)? That informs how much negotiation room exists.
- Crime grade is F in this area — have there been break-ins, vandalism, or insurance claims at this property in the last 3 years? What carrier currently insures it and at what premium?
- What's the average days-on-market for RENTAL listings here right now (not sales)? A rising rental-DOM trend means longer vacancies and softer asking-rent achievability than the comps imply.
- What's the recent tenant-quality profile in this submarket — average credit score on applications, eviction rate, late-payment / NSF rate, and stable-employment percentage? A property-management company in the area should have these aggregated.
- How much new apartment / multifamily construction is in the pipeline within 1–3 miles? Heavy new supply (>2% of stock underway) typically softens rents 12–24 months out; light construction supports rent growth.
Investment metrics
- 1% rule
- 1.14% ✓
- Cap rate
- 8.84%
- Cash-on-cash
- 9.09%
- DSCR
- 1.40
- GRM
- 7.3
CMA / ARV
No comps found within radius.
Projected returns pro-forma
-3.0% appreciation · 6.18% rent growth · sell at horizon
- IRR
- 1.0%
- Equity multiple
- 1.04×
- Total profit
- $8,625
- Equity at exit
- $117,046
- IRR
- 13.6%
- Equity multiple
- 2.25×
- Total profit
- $274,438
- Equity at exit
- $67,872
Cash invested: $219,800 (down + closing). Projections, not guarantees.
Landlord ↔ Tenant lean methodology
- Overall (STATE)
- 90 Strongly Landlord-Friendly
- State Alabama
- 90 Strongly Landlord-Friendly · R+15
- County
- — inherits STATE
- City
- — inherits STATE
ZIP-level market 35630
- Home prices YoY
- -33.7%
- Rents YoY
- 6.2%
- Active inventory
- 268
- Price-to-rent
- 77.0×
Monthly cashflow live
- Estimated rent
- $8,975 medium interval (Pro) →
- Mortgage (P&I)
- −$4,117
- Tax est. 1.5%
- −$981 /mo · $11,775/yr
- Insurance
- −$327
- HOA
- −$0
- Vacancy / Maint / Mgmt
- −$1,885
- Net cashflow
- $1,665
Break-even live
10-unit breakdown (identical units grouped — click to expand)
| Units | Beds | Baths | Est. rent |
|---|---|---|---|
| 5× units | 1 | 1 | $4,245 |
| #1 | 1 | 1 | $849 |
| #2 | 1 | 1 | $849 |
| #3 | 1 | 1 | $849 |
| #4 | 1 | 1 | $849 |
| #5 | 1 | 1 | $849 |
| 5× units | 2 | 1 | $4,730 |
| #6 | 2 | 1 | $946 |
| #7 | 2 | 1 | $946 |
| #8 | 2 | 1 | $946 |
| #9 | 2 | 1 | $946 |
| #10 | 2 | 1 | $946 |
| Total (10 units) | $8,975 | ||
UW: 25.0% down · 7.5% · 30yr · 1.5% tax · 5.0% vac · 8.0% maint · 8.0% mgmt
Financing live
Cash to close
- Down payment
- $196,250
- Closing costs
- $23,550
- Reserves months
- —
- Total cash needed
- —
Loan-product check · same deal, 3 products live
Conventional
25% down · 7.5% · 30yr
- Down + closing
- —
- Monthly P&I
- —
- Monthly cashflow
- —
- DSCR
- —
- Eligible?
- —
Personal DTI + credit; lowest rate.
DSCR
20% down · 8.5% · 30yr
- Down + closing
- —
- Monthly P&I
- —
- Monthly cashflow
- —
- DSCR
- —
- Eligible?
- —
No personal income docs; deal must DSCR.
Hard money
10% down · 12.0% · 12mo
- Down + closing
- —
- Monthly P&I
- —
- Monthly cashflow
- —
- DSCR
- —
- Eligible?
- —
Short-term bridge; refi at stabilization.
Listing history 17 events
-
2026-06-19days on market $785,000 Active 39 DOM
-
2026-06-18days on market $785,000 Active 38 DOM
-
2026-06-17days on market $785,000 Active 37 DOM
-
2026-06-16days on market $785,000 Active 36 DOM
-
2026-06-15days on market $785,000 Active 35 DOM
-
2026-06-14days on market $785,000 Active 33 DOM
-
2026-06-13days on market $785,000 Active 32 DOM
-
2026-06-10days on market $785,000 Active 30 DOM
-
2026-06-09days on market $785,000 Active 29 DOM
-
2026-06-08days on market $785,000 Active 28 DOM
-
2026-06-05days on market $785,000 Active 24 DOM
-
2026-06-02days on market $785,000 Active 22 DOM
-
2026-06-01days on market $785,000 Active 21 DOM
-
2026-05-31days on market $785,000 Active 20 DOM
-
2026-05-30days on market $785,000 Active 19 DOM
-
2026-05-11$785,000 Active 686-char remark
Show marketing remark (686 chars)
Architectural Roof installed 2024. Refrigerators and stoves in each unit Flooring is Mostly Vinyl Plank 5 - 1 bedroom Apts: The newest lease is $650. The other 4 are currently renting for $450. There is also 5 - 2 Bedroom Apts Rents 475 - 550. 3 rent for $475, 1 rents for $550, and 1 rents for $650 depending on when they move in. Some renters that have been there for a while are paying the lower rent Parking on two sides of building and street parking Water Provided under $200 monthly Built on Slab. part built in 1980 part in 1986 Wired Smoke Detectors. 2 bedroom house next door is can be a possible purchase also along with the Apartments but not able to purchase separate.
-
2025-05-07$785,000 Active
ⓘ Source: listings_history table (triggers on properties + properties_extension) + one-shot
backfill from property_details.listing_events for pre-trigger history.
Nearby sold comps map
Loading sold comps map…
Walkable amenities ~0.75 mi
Loading nearby amenities…
Taxation est. · year 1
- Rental income
- $107,700
- − Mortgage interest
- −$43,972
- − Property taxes
- −$11,775
- − Insurance
- −$3,925
- − Repairs & maintenance
- −$8,616
- − Management
- −$8,616
- − Depreciation
- −$22,836
- Taxable income
- $7,959
- Est. tax owed @ 24.0%
- −$1,910
- After-tax cash flow
- $18,073/yr
For passive investors: Depreciation is non-cash, so a rental often shows a tax loss while cash-flowing — sheltering income. Rental losses are passive: they offset passive income freely, and up to $25,000/yr can offset ordinary (W-2) income if you actively participate and your MAGI is under $100k (phasing out to $0 by $150k); unused losses carry forward. On sale, claimed depreciation is recaptured at up to 25%, and gains may owe capital-gains tax (a 1031 exchange can defer both). Figures are a year-1 estimate at your 24.0% rate — not tax advice; consult a CPA.
Condition & rehab AI · 4 photos
This multi-family property requires moderate renovations, focusing on exterior repairs, landscaping, and interior updates to improve its resale and rental value.
Repairs flagged
- Major exterior siding — Significant wear and tear
- Major landscaping — Overgrown lawn and unkempt appearance
Value-add opportunities
- Both paint exterior — Enhances curb appeal and resale value
- Both landscaping — Improves curb appeal and rental value
- Both replace worn flooring — Enhances interior appearance and rental value
Renovation cost estimate screening
| Repair item | Severity | Est. cost |
|---|---|---|
| exterior siding · Significant wear and tear | Major | $15,000–50,000 |
| landscaping · Overgrown lawn and unkempt appearance | Major | $15,000–50,000 |
| Total estimated repair cost · 2 items | $30,000–100,000 |
Value-add ROI direction
- Both paint exterior — Enhances curb appeal and resale value ↑
- Both landscaping — Improves curb appeal and rental value ↑
- Both replace worn flooring — Enhances interior appearance and rental value ↑
ⓘ Cost ranges are severity-bucket heuristics (US national rule-of-thumb). Get contractor quotes + a written scope before underwriting a rehab budget.
Schools (NCES district)
- District
- Florence City
- NCES district ID
- 0101530
- Math proficiency
- 28% ▼ -28.00%
- Reading proficiency
- 44% ▼ -4.00%
- Median HH income
- $34,997
- Composite
- 29.69/100
- National rank
- #6456
- State rank
- #44 of 129 in AL
Livability — Florence
- Score
- 82/100
- State rank
- #4
- US rank
- #1140
Category grades
Schools grade is shown separately in the Schools card above.
Census & demographics
- Census place
- Florence, AL
- County
- Lauderdale County · 47,988 people
- City population
- 34,028
- Metro
- Florence-Muscle Shoals, AL
- Population (ZIP)
- 34,028
- Household income
- $46,304
- Rent vs Own
- Severe rent burden
- 1516.0
Population outlook (Lauderdale County) Hauer SSP2
- Today (2025)
- 93,386 people
- By 2030
- 93,634 · +0.3%
- By 2040
- 93,114 · -0.3%
- By 2050
- 91,586 · -1.9%
- By 2075
- 88,667 · -5.1%
- By 2100
- 81,098 · -13.2%
Race, ethnicity, and origin ACS 2023
- Neighborhood character
- Predominantly White (70%)
- Race & ethnicity
- White 70% Black 18% Two or more races 6% Hispanic / Latino 6%
- Hispanic origin (detail)
- Mexican 5%
- Common ancestry
- Slovak 3% Serbian 2% Romanian 1%
- Foreign-born
- 4% · Canada, Vietnam, Guatemala
- Languages at home
- 92% English-only · Spanish 6% Vietnamese 1%
Political lean MEDSL · Lauderdale
- 2024 margin
- Solid R (+51.5) · D 23.8% · R 75.3%
- 2008→2024 swing
- -23.3pp toward R · 2008: -28.2pp · 2024: -51.5pp
- All cycles
- 2024: R+51.5 2020: R+44.7 2016: R+46.0 2012: R+30.9 2008: R+28.2
Not yet ingested
- Civics
- —
Market trends
- HPI YoY
- ▼ -104.78%
- Current HPI
- 206.1364
- Rent YoY
- ▲ 6.18%
- Metro
- Florence-Muscle Shoals, AL
- State GDP YoY
- ▲ 2.94%
- F500 in state
- 4
Industry mix (Fortune 500 HQ in AL)
| Industry | F500 HQs | Revenue |
|---|---|---|
| Financial Services | 1 | $8B |
|
||
| Healthcare | 1 | $5B |
|
||
Price history
+0.0% since first listed2 events — show timeline
- 2026-05-11 Listed $785,000 SAARMLS
- 2025-05-07 Listed $785,000 SAARMLS
Cash-flow waterfall
monthlySold comps — $/sqft
last 12 mo · ≤1 miLoading sold comps…