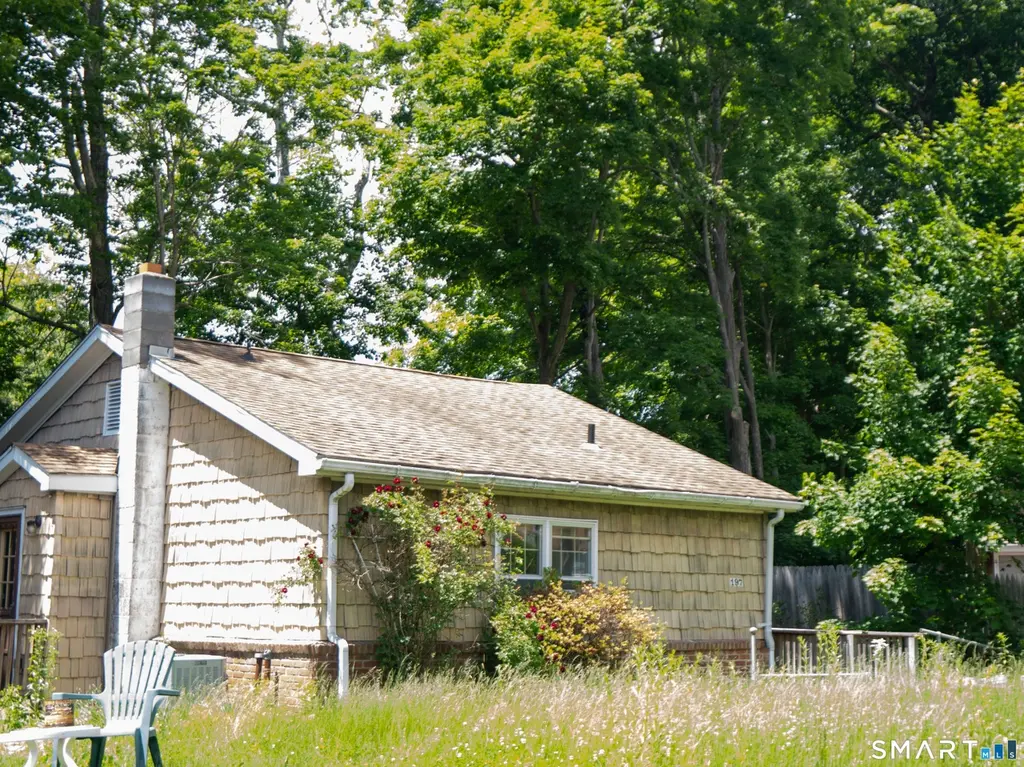
197 Lee Farm Dr · Southbury, CT
Flood risk 10/10 · Severe
- FEMA flood zone
- X (unshaded)
- Chance of flooding over 30 yrs
- 0.99%
- Est. flood insurance / yr
- $473 – $860
Fire risk 2/10 · Minimal
- Est. fire insurance / yr
- $829 – $1,539
Heat risk 5/10 · Moderate
- Hot days now (above 99°F)
- 7 days/yr
- Hot days in 30 yrs
- 16 days/yr
Wind risk 6/10 · Moderate
- Chance of severe wind over 30 yrs
- 27.0%
Air-quality risk 3/10 · Minor
- Unhealthy air days now
- 3 days/yr
- Unhealthy air days in 30 yrs
- 4 days/yr
Risk factors via First Street. Map © Google.
Why this score? — see what drove the D grade
The composite is a weighted blend of 9 inputs, each scored 0–100. Each bar is that input's sub-score; the figure is the points it added to the 100-point composite (weight × sub-score).
- ARV discount +15.0/15.0
- Cash flow +10.5/30.0
- Schools +5.4/10.0
- DSCR +3.0/10.0
- 1% rule +2.7/10.0
- Rent growth +2.5/5.0
- Livability +2.5/5.0
- Condition / age +2.5/5.0
- Appreciation +0.0/10.0
$235,000
🖨 Deal sheet 📄 Offer letter ✓ Due diligence
Listing remarks
This former summer cottage was converted for 4 season living. With a little effort and a few upgrades, you will have a great home in one of Southbury's popular lake communities. Trim a few limbs out and you will have great lake views. Property is being sold in "AS IS CONDITION"
Key facts
- Lake views
- 3,484 sq ft lot
- 2 garage spots
Tags
Property features AI
Exterior
- Parking: Detached garage (2-car); Paved and unpaved parking; Total of 4 parking spaces
- Utilities: Public water connected; Cesspool sewage system; Electric service (assumed); Oil fuel for heating and hot water
- Home design: Single family home
- Construction: Frame construction with concrete elements; Concrete foundation; Asphalt shingle roof; Vinyl siding; Tan exterior color
- Exterior features: Deck; Gutters; Sloping lot; Easements on property; Water view
Interior
- Kitchen: Gas cooktop; Refrigerator
- Bedrooms: 1 bedroom
- Bathrooms: 2 full bathrooms
- Heating & cooling: Hot air heating (oil-fired); Central air conditioning; Oil hot water (domestic); fuel tank located in basement
- Interior features: Open floor plan; Bonus room; Partial, heated, partially finished walk-out basement with concrete floor; Attic accessible via hatch
- Laundry & utility: Washer and electric dryer located on the lower level
Neighborhood map
What this means for you Summary
Snapshot
- This is a 1-bed/2.0-bath single-family listed at $235k.
Deal economics
- At list price, monthly cash flow is $-176 ($-2k/yr) — negative.
- To cash-flow at today's rent, offer at most $204k (13.2% below list).
- To meet the 1% rule (rent ≥ 1% of price), the offer needs to be $181k (22.8% below list).
- Recommended offer: $181k (22.8% below list) — sets the bar for 1% rule.
Location & tenants
- Location reads: area grade D — affects rentability + tenant quality, not the cash-flow math above.
- Regional School District 15 (suburban): math 56% / reading 64% proficiency, ranked #46 of 153 in CT (top 30%) — acceptable for families but not a draw, mixed tenant base, ~2y average lease; only 4% free/reduced lunch — higher-income household profile.
- Zoned schools: Pomperaug Regional High School (math 54% / reading 74%, grade B-, #37 of 194 statewide, top 19%, 1,039 students, 14% FRL).
- Market conditions: 156 active listings in the ZIP; 502 units permitted in Naugatuck Valley Planning Region in 2024 (171 in 5+ unit buildings).
Forward outlook
- Local home prices are declining (-3.0%/yr); year-one equity from $2k of loan paydown is wiped out by about $7k of value loss. Plan a longer hold.
Negotiation context
- Only 6 days on market — expect competitive offers; lowballing is unlikely to land.
- 11 sale attempts since 20y ago with the ask held roughly flat each time — persistent listings suggest the price (not the market) is what's stuck; bring a comps-based counter.
Risks & watch-outs
- Watch-outs: flood insurance adds $56/mo; built in 1929 — expect roof / HVAC / electrical / plumbing capex.
- Climate carrying-cost: severe flood risk; major wind risk, 27% chance of damaging wind over 30y; extreme-heat days projected 7→16/yr by 2055 (HVAC capex compounding) — expect insurance premiums to compound above CPI over the hold.
Questions for the listing agent
- What do current leases actually rent for vs. the listed asking? Can we see a recent rent roll and the last 12 months of T-12 income?
- Built in 1929 — when were the roof, HVAC, electrical panel, plumbing, and water heater last replaced?
- What's the actual annual flood-insurance premium (NFIP or private), and is the property in a SFHA with mandatory coverage?
- Is there a deadline driving the sale (1031 exchange, divorce, estate, relocation)? That informs how much negotiation room exists.
- The area grade is low — what's the realistic commute time and amenity access for the typical tenant pool here? Any planned neighborhood developments (good or bad) we should know about?
- What's the average days-on-market for RENTAL listings here right now (not sales)? A rising rental-DOM trend means longer vacancies and softer asking-rent achievability than the comps imply.
- What's the recent tenant-quality profile in this submarket — average credit score on applications, eviction rate, late-payment / NSF rate, and stable-employment percentage? A property-management company in the area should have these aggregated.
- How much new for-sale + rental construction is in the pipeline within 1–3 miles? Heavy new supply typically softens prices + rents 12–24 months out; constrained supply supports both.
Investment metrics
- 1% rule
- 0.77% ✗
- Cap rate
- 5.68%
- Cash-on-cash
- -2.20%
- DSCR
- 0.90
- GRM
- 10.8
CMA / ARV
- ARV (on-the-fly)
- $291,168
- Comps found
- 1
Show comp detail 1 sale within ~0.75 mi
| Address | Dist | Beds/Ba | Sqft | Sold | Price | $/sf | Match |
|---|---|---|---|---|---|---|---|
| 82 Scout Rd | 0.30mi | 1/1.0 | 660 (-2%) | 14mo | $285,000 | $432 | 67 |
Match score weights: distance 35% · size 25% · config 20% · recency 20%. Top-matched comps best support the ARV.
Projected returns pro-forma
-3.0% appreciation · 3.0% rent growth · sell at horizon
- IRR
- -21.7%
- Equity multiple
- 0.25×
- Total profit
- $-49,284
- Equity at exit
- $35,039
- IRR
- -15.4%
- Equity multiple
- 0.13×
- Total profit
- $-57,291
- Equity at exit
- $20,319
Cash invested: $65,800 (down + closing). Projections, not guarantees.
Landlord ↔ Tenant lean methodology
- Overall (STATE)
- 27 Tenant-Leaning
- State Connecticut
- 27 Tenant-Leaning · D+7
- County
- — inherits STATE
- City
- — inherits STATE
ZIP-level market 06488
- Active inventory
- 156
- Price-to-rent
- 10.8×
Monthly cashflow live
- Estimated rent
- $1,814 medium interval (Pro) →
- Mortgage (P&I)
- −$1,232
- Tax from tax record
- −$224 /mo · $2,685/yr
- Insurance
- −$98
- Flood insurance flood zone
- −$56 /mo · $666/yr
- HOA
- −$0
- Vacancy / Maint / Mgmt
- −$381
- Net cashflow
- $-176
Break-even live
UW: 25.0% down · 7.5% · 30yr · 1.5% tax · 5.0% vac · 8.0% maint · 8.0% mgmt
Financing live
Cash to close
- Down payment
- $58,750
- Closing costs
- $7,050
- Reserves months
- —
- Total cash needed
- —
Loan-product check · same deal, 3 products live
Conventional
25% down · 7.5% · 30yr
- Down + closing
- —
- Monthly P&I
- —
- Monthly cashflow
- —
- DSCR
- —
- Eligible?
- —
Personal DTI + credit; lowest rate.
DSCR
20% down · 8.5% · 30yr
- Down + closing
- —
- Monthly P&I
- —
- Monthly cashflow
- —
- DSCR
- —
- Eligible?
- —
No personal income docs; deal must DSCR.
Hard money
10% down · 12.0% · 12mo
- Down + closing
- —
- Monthly P&I
- —
- Monthly cashflow
- —
- DSCR
- —
- Eligible?
- —
Short-term bridge; refi at stabilization.
Listing history 6 events
-
2026-06-18days on market $235,000 Active 6 DOM
-
2026-06-17days on market $235,000 Active 5 DOM
-
2026-06-16days on market $235,000 Active 4 DOM
-
2026-06-15days on market $235,000 Active 3 DOM
-
2026-06-13remarks 278-char remark
-
2026-06-13$235,000 Active 1 DOM
ⓘ Source: listings_history table (triggers on properties + properties_extension) + one-shot
backfill from property_details.listing_events for pre-trigger history.
Tax reassessment forecast CT · Partial reset (capped growth)
- Current annual tax
- $2,685 · $224/mo
- Projected year-2 tax
- $3,857 · $321/mo
- Expected delta
- +$1,172/yr (+$98/mo · 43.6%)
ⓘ Screening estimate from a state-policy table — verify with the county assessor before closing.
Climate risk First Street
- Flood 10/10 Extreme FEMA zone X (unshaded) · 99% chance over 30 yrs
- Wildfire 2/10 Low
- Heat 5/10 Major 7 d/yr ≥99°F today · 16 d/yr by 30 yrs out
- Wind 6/10 Major 27% chance of damaging wind over 30 yrs
- Air quality 3/10 Moderate 3 unhealthy d/yr today · 4 by 30 yrs out
Nearby sold comps map
Loading sold comps map…
Walkable amenities ~0.75 mi
Loading nearby amenities…
Taxation est. · year 1
- Rental income
- $21,773
- − Mortgage interest
- −$13,164
- − Property taxes
- −$2,685
- − Insurance
- −$1,842
- − Repairs & maintenance
- −$1,742
- − Management
- −$1,742
- − Depreciation
- −$6,836
- Taxable loss
- −$6,237
- Est. tax savings @ 24.0%
- +$1,497
- After-tax cash flow
- $-617/yr
For passive investors: Depreciation is non-cash, so a rental often shows a tax loss while cash-flowing — sheltering income. Rental losses are passive: they offset passive income freely, and up to $25,000/yr can offset ordinary (W-2) income if you actively participate and your MAGI is under $100k (phasing out to $0 by $150k); unused losses carry forward. On sale, claimed depreciation is recaptured at up to 25%, and gains may owe capital-gains tax (a 1031 exchange can defer both). Figures are a year-1 estimate at your 24.0% rate — not tax advice; consult a CPA.
Schools (NCES district)
- District
- Regional School District 15
- NCES district ID
- 0903537
- Math proficiency
- 56% ▼ -15.00%
- Reading proficiency
- 64% ▼ -11.00%
- Median HH income
- $84,697
- Composite
- 54.36/100
- National rank
- #1361
- State rank
- #46 of 153 in CT
Livability — Southbury
No livability data for this city. (Only ~50 U.S. cities are tracked.)
Census & demographics
- Population (ZIP)
- 19,973
Population outlook (Naugatuck Valley County) Hauer SSP2
- By 2040
- 496,846
Race, ethnicity, and origin ACS 2023
- Neighborhood character
- Predominantly White (83%)
- Race & ethnicity
- White 83% Hispanic / Latino 9% Two or more races 7% Asian 3% Black 2%
- Hispanic origin (detail)
- Puerto Rican 4%
- Common ancestry
- Romanian 5% Lithuanian 3% Scotch-Irish 2%
- Foreign-born
- 8% · China, Canada, Jamaica
- Languages at home
- 89% English-only · Spanish 4% Chinese 2% Other Indo-European 2%
Political lean MEDSL · Naugatuck Valley
- 2024 margin
- Lean R (+7.4) · D 45.6% · R 53.0% · Other 1.4%
- All cycles
- 2024: R+7.4
Not yet ingested
- Civics
- —
Market trends
- HPI YoY
- ▼ -124.35%
- Current HPI
- 165.0514
- Rent YoY
- —
- Metro
- —
- State GDP YoY
- ▲ 1.06%
- F500 in state
- 38
Industry mix (Fortune 500 HQ in CT)
| Industry | F500 HQs | Revenue |
|---|---|---|
| Industrial Machinery | 4 | $38B |
|
||
| Insurance | 3 | $71B |
|
||
| Financial Services | 2 | $25B |
|
||
| Transportation / Logistics | 2 | $18B |
|
||
| Healthcare | 1 | $247B |
|
||
| Telecommunications | 1 | $55B |
|
||
Price history
-41.2% since first listed25 events — show timeline
- 2026-06-02 Listed $235,000 Smart MLS
- 2025-12-06 Listing Removed — Smart MLS
- 2025-08-23 Listed $254,900 Smart MLS
- 2025-08-10 Listing Removed — Smart MLS
- 2025-07-19 Price Changed $256,900 Smart MLS
- 2025-05-03 Price Changed $259,900 Smart MLS
- 2025-04-09 Listed $349,900 Smart MLS
- 2024-01-07 Listing Removed — Smart MLS
- 2023-12-09 Price Changed $239,900 Smart MLS
- 2023-11-30 Listed $260,000 Smart MLS
- 2023-11-01 Listing Removed — Smart MLS
- 2023-10-15 Relisted — Smart MLS
- 2023-09-06 Listing Removed — Smart MLS
- 2023-05-05 Listed $260,000 Smart MLS
- 2012-02-28 Listing Removed — Smart MLS
- 2011-11-28 Listed $179,900 Smart MLS
- 2011-11-18 Listing Removed — Smart MLS
- 2011-07-18 Listed $190,000 Smart MLS
- 2010-06-08 Listing Removed — Smart MLS
- 2010-03-08 Listed $200,000 Smart MLS
- 2008-08-26 Sold (Public Records) $255,000 Public Records
- 2008-08-26 Sold (MLS) $355,000 Smart MLS
- 2008-08-26 Listing Removed — Smart MLS
- 2007-03-28 Listed $399,900 Smart MLS
- 2006-10-25 Listed $399,900 Smart MLS
Property tax history
+0.5%/yrLatest (2023): $2,685 · +0.7% YoY. Source: county tax records.
Cash-flow waterfall
monthlySold comps — $/sqft
last 12 mo · ≤1 miLoading sold comps…