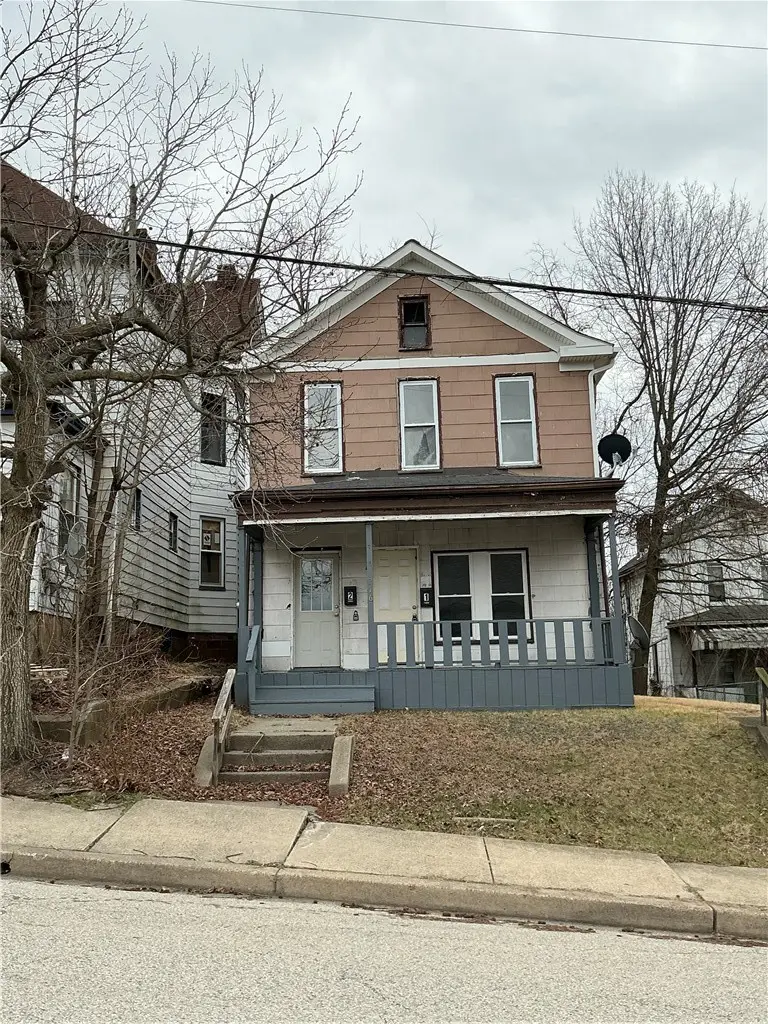
216 Ridge Ave · New Kensington, PA
Flood risk 1/10 · Minimal
- FEMA flood zone
- X (unshaded)
- Chance of flooding over 30 yrs
- 0.0%
- Est. flood insurance / yr
- $507 – $1,088
Fire risk 1/10 · Minimal
- Est. fire insurance / yr
- $511 – $949
Heat risk 4/10 · Minor
- Hot days now (above 96°F)
- 7 days/yr
- Hot days in 30 yrs
- 19 days/yr
Wind risk 2/10 · Minimal
- Chance of severe wind over 30 yrs
- —
Air-quality risk 4/10 · Minor
- Unhealthy air days now
- 5 days/yr
- Unhealthy air days in 30 yrs
- 6 days/yr
Risk factors via First Street. Map © Google.
Why this score? — see what drove the C grade
The composite is a weighted blend of 9 inputs, each scored 0–100. Each bar is that input's sub-score; the figure is the points it added to the 100-point composite (weight × sub-score).
- Cash flow +30.0/30.0
- DSCR +10.0/10.0
- 1% rule +8.9/10.0
- Livability +3.5/5.0
- Rent growth +3.0/5.0
- Condition / age +2.5/5.0
- Schools +1.9/10.0
- ARV discount +0.0/15.0
- Appreciation +0.0/10.0
$139,900
🖨 Deal sheet (PDF) 📄 Offer letter ✓ Due diligence
Listing remarks MLS
Recently remodeled top/down duplex with many quality and professional updates throughout, including renovated kitchens and bathrooms, plumbing, new flooring, new appliances, and fresh paint throughout. Off-street parking, a full basement, and a covered front porch. Situated on a friendly street. An excellent investment opportunity!
Key facts
- Covered front porch
- Remodeled duplex
- Renovated kitchens
Tags
Neighborhood map
What this means for you Summary
Snapshot
- This is a 6-bed/4.0-bath other listed at $140k.
Deal economics
- At list price, monthly cash flow is $572 ($7k/yr) — positive.
- The deal already cash-flows at list — no discount required.
- Meets the 1% rule at list price ($2k rent vs $140k).
- Recommended offer: $127k (9.0% below list) — sets the bar for market timing.
- Cap rate 11.2% vs local median 7.2% in New Kensington — top-decile yield for the area; either an underpriced asset or a hidden risk that comps aren't pricing in. Stress-test before assuming the spread holds.
Location & tenants
- Location reads 69/100 on livability (#840 in PA) — a middle-class / working-renter tenant base. Strengths: cost of living A+, housing A+; Watch: schools C-, employment D, crime F.
- New Kensington-Arnold SD (suburban): math 16% / reading 31% proficiency, ranked #483 of 539 in PA (top 90%) — low school quality limits family demand, transient renter base, plan for 1-2y turnover.
- Market conditions: Rents rising (+1.9%/yr); 171 active listings in the ZIP; 2 comparable units currently listed for rent nearby; 415 units permitted in Westmoreland County in 2024 (10 in 5+ unit buildings).
- This rent runs 37% of the median local income ($63k/yr) — at the standard rent-burdened threshold; future hikes will face affordability resistance.
Forward outlook
- Local home prices are declining (-3.0%/yr); year-one equity from $967 of loan paydown is wiped out by about $4k of value loss. Plan a longer hold.
- Westmoreland County population projected at -19% by 2050 — secular population decline; favor cash flow + early exit over multi-decade hold.
- At projected returns (-3.0% appreciation + 1.9% rent growth), your $39k cash investment doubles in ~8 years — after that, you're playing with house money.
Negotiation context
- It's been on market 99 days — a 9% lower offer ($127k) is reasonable based on typical stale-listing flexibility.
- 5 sale attempts since 29y ago; this cycle's ask has dropped $20k (13%) from the opening price — seller is motivated, your offer sets the floor, not the list.
- Current owner paid $85k; list at $140k implies a 65% gain — meaningful room to come down on a strong offer.
Risks & watch-outs
- Watch-outs: built in 1900 — expect roof / HVAC / electrical / plumbing capex.
Questions for the listing agent
- It's been on market 99 days. Have you received any prior offers? Is the seller open to a 9% concession, seller financing, or rate buy-down credit?
- Built in 1900 — when were the roof, HVAC, electrical panel, plumbing, and water heater last replaced?
- Why hasn't it sold? Are there any deal-killer items the seller is aware of (foundation, flood, title, zoning, code violations)?
- Is there a deadline driving the sale (1031 exchange, divorce, estate, relocation)? That informs how much negotiation room exists.
- Crime grade is F in this area — have there been break-ins, vandalism, or insurance claims at this property in the last 3 years? What carrier currently insures it and at what premium?
- What's the average days-on-market for RENTAL listings here right now (not sales)? A rising rental-DOM trend means longer vacancies and softer asking-rent achievability than the comps imply.
- What's the recent tenant-quality profile in this submarket — average credit score on applications, eviction rate, late-payment / NSF rate, and stable-employment percentage? A property-management company in the area should have these aggregated.
- How much new for-sale + rental construction is in the pipeline within 1–3 miles? Heavy new supply typically softens prices + rents 12–24 months out; constrained supply supports both.
Investment metrics
- 1% rule
- 1.39% ✓
- Cap rate
- 11.20%
- Cash-on-cash
- 17.52%
- DSCR
- 1.78
- GRM
- 6.0
CMA / ARV
- ARV (median comp)
- $111,537
- List price
- $139,900
- Delta
- 25.43%
- Verdict
- OVERPRICED
- Comps
- 1 within 2.0 mi
Projected returns pro-forma
-3.0% appreciation · 1.9% rent growth · sell at horizon
- IRR
- 7.7%
- Equity multiple
- 1.30×
- Total profit
- $11,646
- Equity at exit
- $20,860
- IRR
- 16.0%
- Equity multiple
- 2.24×
- Total profit
- $48,598
- Equity at exit
- $12,096
Cash invested: $39,172 (down + closing). Projections, not guarantees.
Landlord ↔ Tenant lean methodology
- Overall (STATE)
- 62 Landlord-Friendly
- State Pennsylvania
- 62 Landlord-Friendly · EVEN
- County
- — inherits STATE
- City
- — inherits STATE
ZIP-level market 15068
- Home prices YoY
- -12.2%
- Rents YoY
- 1.9%
- Active inventory
- 171
- Price-to-rent
- 6.0×
Monthly cashflow live
- Estimated rent
- $1,948 medium interval (Pro) →
- Mortgage (P&I)
- −$734
- Tax est. 1.5%
- −$175 /mo · $2,098/yr
- Insurance
- −$58
- HOA
- −$0
- Vacancy / Maint / Mgmt
- −$409
- Net cashflow
- $572
Break-even live
Sensitivity live
| Price | -10% $668 | -5% $620 | +0% $572 | +5% $523 | +10% $475 |
|---|---|---|---|---|---|
| Rent | -10% $418 | -5% $495 | +0% $572 | +5% $649 | +10% $726 |
| Rate | -1.0pp $642 | -0.5pp $607 | base $572 | +0.5pp $536 | +1.0pp $499 |
UW: 25.0% down · 7.5% · 30yr · 1.5% tax · 5.0% vac · 8.0% maint · 8.0% mgmt
Financing live
Cash to close
- Down payment
- $34,975
- Closing costs
- $4,197
- Reserves months
- —
- Total cash needed
- —
Loan-product check · same deal, 3 products live
Conventional
25% down · 7.5% · 30yr
- Down + closing
- —
- Monthly P&I
- —
- Monthly cashflow
- —
- DSCR
- —
- Eligible?
- —
Personal DTI + credit; lowest rate.
DSCR
20% down · 8.5% · 30yr
- Down + closing
- —
- Monthly P&I
- —
- Monthly cashflow
- —
- DSCR
- —
- Eligible?
- —
No personal income docs; deal must DSCR.
Hard money
10% down · 12.0% · 12mo
- Down + closing
- —
- Monthly P&I
- —
- Monthly cashflow
- —
- DSCR
- —
- Eligible?
- —
Short-term bridge; refi at stabilization.
Rent comps 2 comps
| Address | Beds | Baths | Sqft | Rent | $/sqft | DOM | Units | Dist |
|---|---|---|---|---|---|---|---|---|
| 1922 Kenneth Ave New Kensington, PA | 5.0 | 2.0 | 1800 | $2,150 | $1.19 | 8d | 1 | 1.09mi |
| 1922 Kenneth Ave New Kensington, PA | 5.0 | 2.0 | 1800 | $2,100 | $1.17 | 2d | 1 | 1.09mi |
Listing history 27 events
-
2026-06-21days on market $139,900 Active 99 DOM
-
2026-06-18days on market $139,900 Active 96 DOM
-
2026-06-17days on market $139,900 Active 95 DOM
-
2026-06-16days on market $139,900 Active 94 DOM
-
2026-06-15days on market $139,900 Active 93 DOM
-
2026-06-13days on market $139,900 Active 91 DOM
-
2026-06-09days on market $139,900 Active 87 DOM
-
2026-06-08days on market $139,900 Active 86 DOM
-
2026-06-07days on market $139,900 Active 85 DOM
-
2026-06-05pricedays on market $139,900 Active 82 DOM
-
2026-06-03days on market $150,000 Active 81 DOM
-
2026-06-02days on market $150,000 Active 80 DOM
-
2026-06-01days on market $150,000 Active 79 DOM
-
2026-05-31days on market $150,000 Active 78 DOM
-
2026-05-06price $150,000 334-char remark
Show marketing remark (334 chars)
Recently remodeled top/down duplex with many quality and professional updates throughout, including renovated kitchens and bathrooms, plumbing, new flooring, new appliances, and fresh paint throughout. Off-street parking, a full basement, and a covered front porch. Situated on a friendly street. An excellent investment opportunity!
-
2026-03-14$160,000 Active 334-char remark
Show marketing remark (334 chars)
Recently remodeled top/down duplex with many quality and professional updates throughout, including renovated kitchens and bathrooms, plumbing, new flooring, new appliances, and fresh paint throughout. Off-street parking, a full basement, and a covered front porch. Situated on a friendly street. An excellent investment opportunity!
-
2025-09-20historical Expired 393-char remark
Show marketing remark (393 chars)
Great Investment Opportunity! Updated Turnkey duplex located in the New Kensington neighborhood. This property features two units. Unit One is a 1 bed, 1 bath and Unit Two is a 2 bed, 1 bath. Recent Updates - Fresh paint throughout, Flooring, Brand new appliances, Renovated Bathrooms and Kitchens, Plumbing in basement, Added washers and dryers in unit and basement. Schedule a showing today!
-
2025-04-21$159,000 Active 393-char remark
Show marketing remark (393 chars)
Great Investment Opportunity! Updated Turnkey duplex located in the New Kensington neighborhood. This property features two units. Unit One is a 1 bed, 1 bath and Unit Two is a 2 bed, 1 bath. Recent Updates - Fresh paint throughout, Flooring, Brand new appliances, Renovated Bathrooms and Kitchens, Plumbing in basement, Added washers and dryers in unit and basement. Schedule a showing today!
-
2025-03-21price $169,999
-
2025-03-13$175,999 Active
-
2024-10-22status Pending
-
2024-10-21soldstatus $85,000 Closed
-
2024-09-03historical Contingent
-
2024-08-02price $100,000
-
2024-06-07$105,000 Active
-
1997-06-11soldstatus $18,000
-
1997-03-21$21,000
ⓘ Source: listings_history table (triggers on properties + properties_extension) + one-shot
backfill from property_details.listing_events for pre-trigger history.
Climate risk First Street
- Flood 1/10 Low FEMA zone X (unshaded) · 0% chance over 30 yrs
- Wildfire 1/10 Low
- Heat 4/10 Moderate 7 d/yr ≥96°F today · 19 d/yr by 30 yrs out
- Wind 2/10 Low
- Air quality 4/10 Moderate 5 unhealthy d/yr today · 6 by 30 yrs out
Nearby sold comps map
Loading sold comps map…
Walkable amenities ~0.75 mi
Loading nearby amenities…
Taxation est. · year 1
- Rental income
- $23,372
- − Mortgage interest
- −$7,837
- − Property taxes
- −$2,098
- − Insurance
- −$700
- − Repairs & maintenance
- −$1,870
- − Management
- −$1,870
- − Depreciation
- −$4,070
- Taxable income
- $4,928
- Est. tax owed @ 24.0%
- −$1,183
- After-tax cash flow
- $5,679/yr
For passive investors: Depreciation is non-cash, so a rental often shows a tax loss while cash-flowing — sheltering income. Rental losses are passive: they offset passive income freely, and up to $25,000/yr can offset ordinary (W-2) income if you actively participate and your MAGI is under $100k (phasing out to $0 by $150k); unused losses carry forward. On sale, claimed depreciation is recaptured at up to 25%, and gains may owe capital-gains tax (a 1031 exchange can defer both). Figures are a year-1 estimate at your 24.0% rate — not tax advice; consult a CPA.
Schools (NCES district)
- District
- New Kensington-Arnold SD
- NCES district ID
- 4216740
- Math proficiency
- 16% ▼ -7.00%
- Reading proficiency
- 31% ▼ -13.00%
- Median HH income
- $34,386
- Composite
- 19.26/100
- National rank
- #8805
- State rank
- #483 of 539 in PA
Livability — New Kensington
- Score
- 69/100
- State rank
- #840
- US rank
- #8791
Category grades
Schools grade is shown separately in the Schools card above.
Census & demographics
- Census place
- New Kensington, PA
- County
- Westmoreland County · 183,777 people
- City population
- 36,203
- Metro
- Pittsburgh, PA
- Population (ZIP)
- 36,203
- Household income
- $63,426
- Rent vs Own
- Severe rent burden
- 967.0
Population outlook (Westmoreland County) Hauer SSP2
- Today (2025)
- 342,555 people
- By 2030
- 331,717 · -3.2%
- By 2040
- 304,976 · -11.0%
- By 2050
- 277,444 · -19.0%
- By 2075
- 224,607 · -34.4%
- By 2100
- 171,084 · -50.1%
Race, ethnicity, and origin ACS 2023
- Neighborhood character
- Predominantly White (88%)
- Race & ethnicity
- White 88% Black 8% Two or more races 3% Hispanic / Latino 1%
- Common ancestry
- Romanian 12% Subsaharan African 2% Serbian 1%
- Foreign-born
- 1%
- Languages at home
- 97% English-only · Spanish 1% Other Indo-European 0%
Political lean MEDSL · Westmoreland
- 2024 margin
- Strong R (+28.4) · D 35.4% · R 63.9%
- 2008→2024 swing
- -11.7pp toward R · 2008: -16.7pp · 2024: -28.4pp
- All cycles
- 2024: R+28.4 2020: R+28.3 2016: R+31.3 2012: R+23.7 2008: R+16.7
Not yet ingested
- Civics
- —
Market trends
- HPI YoY
- ▼ -42.50%
- Current HPI
- 305.926
- Rent YoY
- ▲ 1.90%
- Metro
- Pittsburgh, PA
- State GDP YoY
- ▲ 1.68%
- F500 in state
- 34
Industry mix (Fortune 500 HQ in PA)
| Industry | F500 HQs | Revenue |
|---|---|---|
| Healthcare | 2 | $309B |
|
||
| Insurance | 2 | $27B |
|
||
| Telecommunications / Media | 1 | $124B |
|
||
| Industrial Distribution | 1 | $22B |
|
||
| Financial Services | 1 | $20B |
|
||
| Chemicals / Materials | 1 | $18B |
|
||
Price history
+614.3% since first listed13 events — show timeline
- 2026-05-06 Price Changed $150,000 West Penn MLS
- 2026-03-14 Listed $160,000 West Penn MLS
- 2025-09-20 Delisted — West Penn MLS
- 2025-04-21 Listed $159,000 West Penn MLS
- 2025-03-21 Price Changed $169,999 West Penn MLS
- 2025-03-13 Listed $175,999 West Penn MLS
- 2024-10-22 Pending — West Penn MLS
- 2024-10-21 Sold (MLS) $85,000 West Penn MLS
- 2024-09-03 Contingent — West Penn MLS
- 2024-08-02 Price Changed $100,000 West Penn MLS
- 2024-06-07 Listed $105,000 West Penn MLS
- 1997-06-11 Sold (MLS) $18,000 West Penn MLS
- 1997-03-21 Listed $21,000 West Penn MLS
Property tax history
-16.1%/yrLatest (2026): $114 · +0.0% YoY. Source: county tax records.
Cash-flow waterfall
monthlySold comps — $/sqft
last 12 mo · ≤1 miLoading sold comps…