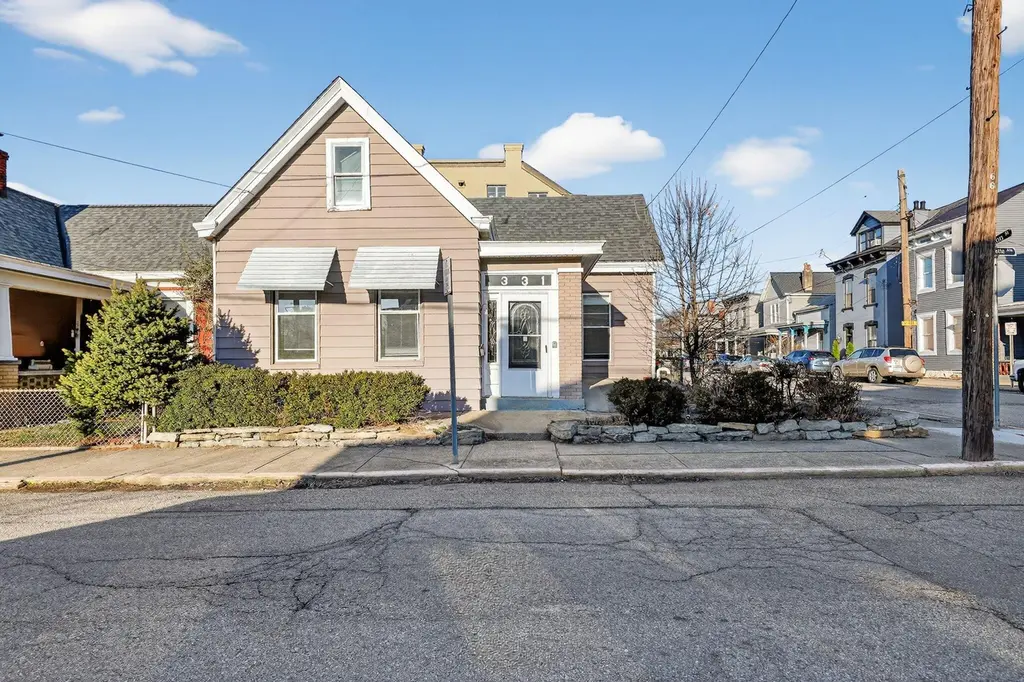
331 Lafayette Ave · Bellevue, KY
Flood risk 1/10 · Minimal
- FEMA flood zone
- X (unshaded)
- Chance of flooding over 30 yrs
- 0.0%
- Est. flood insurance / yr
- $507 – $1,088
Fire risk 1/10 · Minimal
- Est. fire insurance / yr
- $839 – $1,559
Heat risk 5/10 · Moderate
- Hot days now (above 103°F)
- 7 days/yr
- Hot days in 30 yrs
- 19 days/yr
Wind risk 2/10 · Minimal
- Chance of severe wind over 30 yrs
- 1.0%
Air-quality risk 3/10 · Minor
- Unhealthy air days now
- 2 days/yr
- Unhealthy air days in 30 yrs
- 3 days/yr
Risk factors via First Street. Map © Google.
Why this score? — see what drove the B grade
The composite is a weighted blend of 9 inputs, each scored 0–100. Each bar is that input's sub-score; the figure is the points it added to the 100-point composite (weight × sub-score).
- Cash flow +27.5/30.0
- ARV discount +15.0/15.0
- DSCR +9.6/10.0
- 1% rule +7.0/10.0
- Livability +4.6/5.0
- Rent growth +2.5/5.0
- Condition / age +2.5/5.0
- Schools +2.2/10.0
- Appreciation +0.0/10.0
$184,900
🖨 Deal sheet 📄 Offer letter ✓ Due diligence
Listing remarks MLS
Welcome to this charming 2-bedroom, 1-bath home in the heart of Bellevue! Featuring inviting living spaces and plenty of natural light, this property offers both comfort and character. Enjoy a prime location just minutes from downtown Cincinnati, local shops, dining, and the riverfront. Perfect for homeowners seeking convenience and a vibrant community atmosphere!
Key facts
- Natural light
- Prime location
- 2,134 sq ft lot
Tags
Neighborhood map
What this means for you Summary
Snapshot
- This is a 3-bed/2.0-bath single-family listed at $185k.
Deal economics
- At list price, monthly cash flow is $544 ($7k/yr) — positive.
- The deal already cash-flows at list — no discount required.
- Meets the 1% rule at list price ($2k rent vs $185k).
- Recommended offer: $174k (6.0% below list) — sets the bar for market timing.
- Cap rate 9.8% vs local median 4.5% in Bellevue — top-decile yield for the area; either an underpriced asset or a hidden risk that comps aren't pricing in. Stress-test before assuming the spread holds.
Location & tenants
- Location reads 92/100 on livability (#8 in KY, #24 nationally) — a professional / high-income tenant draw. Strengths: crime A+, amenities A+, commute A+; Watch: schools C-.
- Bellevue Independent (suburban): math 17% / reading 33% proficiency, ranked #136 of 165 in KY (top 82%) — low school quality limits family demand, transient renter base, plan for 1-2y turnover.
- Market conditions: Rents flat; 49 active listings in the ZIP; 38 comparable units currently listed for rent nearby; rentals leasing fast (median 5d on market — plan ~1-2 weeks tenant-placement turnaround); 247 units permitted in Campbell County in 2024 (77 in 5+ unit buildings).
- This rent runs 37% of the median local income ($71k/yr) — at the standard rent-burdened threshold; future hikes will face affordability resistance.
Forward outlook
- Local home prices are declining (-3.0%/yr); year-one equity from $1k of loan paydown is wiped out by about $6k of value loss. Plan a longer hold.
Negotiation context
- It's been on market 75 days — a 6% lower offer ($174k) is reasonable based on typical stale-listing flexibility.
- 5 sale attempts since 31y ago; this cycle's ask has dropped $25k (12%) from the opening price — seller is motivated, your offer sets the floor, not the list.
Risks & watch-outs
- Watch-outs: built in 1892 — expect roof / HVAC / electrical / plumbing capex.
- Climate carrying-cost: extreme-heat days projected 7→19/yr by 2055 (HVAC capex compounding) — expect insurance premiums to compound above CPI over the hold.
Questions for the listing agent
- It's been on market 75 days. Have you received any prior offers? Is the seller open to a 6% concession, seller financing, or rate buy-down credit?
- Built in 1892 — when were the roof, HVAC, electrical panel, plumbing, and water heater last replaced?
- Why hasn't it sold? Are there any deal-killer items the seller is aware of (foundation, flood, title, zoning, code violations)?
- Is there a deadline driving the sale (1031 exchange, divorce, estate, relocation)? That informs how much negotiation room exists.
- What's the average days-on-market for RENTAL listings here right now (not sales)? A rising rental-DOM trend means longer vacancies and softer asking-rent achievability than the comps imply.
- What's the recent tenant-quality profile in this submarket — average credit score on applications, eviction rate, late-payment / NSF rate, and stable-employment percentage? A property-management company in the area should have these aggregated.
- How much new for-sale + rental construction is in the pipeline within 1–3 miles? Heavy new supply typically softens prices + rents 12–24 months out; constrained supply supports both.
Investment metrics
- 1% rule
- 1.20% ✓
- Cap rate
- 9.82%
- Cash-on-cash
- 12.61%
- DSCR
- 1.56
- GRM
- 6.9
CMA / ARV
- ARV (median comp)
- $321,479
- List price
- $184,900
- Delta
- -42.48%
- Verdict
- UNDERPRICED
- Comps
- 20 within 1.0 mi
Show comp detail 12 sales within ~0.75 mi
| Address | Dist | Beds/Ba | Sqft | Sold | Price | $/sf | Match |
|---|---|---|---|---|---|---|---|
| 223 Poplar St | 0.08mi | 2/1.0 (-1) | 1,229 (+10%) | 2mo | $170,000 | $138 | 69 |
| 326 Covert Run Pike | 0.43mi | 3/1.0 | 1,078 (-4%) | 1mo | $258,000 | $239 | 68 |
| 911 Thornton St | 0.46mi | 3/1.5 | 1,075 (-4%) | 1mo | $216,000 | $201 | 68 |
| 428 Clark St | 0.18mi | 2/1.0 (-1) | 1,029 (-8%) | 2mo | $240,000 | $233 | 68 |
| 335 Prospect St | 0.21mi | 3/2.0 | 1,280 (+14%) | 1mo | $314,000 | $245 | 66 |
| 325 Washington Ave | 0.20mi | 3/1.0 | 985 (-12%) | 3mo | $150,000 | $152 | 64 |
| 356 Foote Ave | 0.23mi | 2/1.0 (-1) | 1,219 (+9%) | 2mo | $185,000 | $152 | 64 |
| 101 Cleveland Ave | 0.44mi | 3/1.5 | 1,035 (-8%) | 1mo | $285,000 | $275 | 64 |
| 411 Washington Ave | 0.22mi | 3/1.0 | 1,270 (+13%) | 2mo | $187,500 | $148 | 62 |
| 223 4th Ave | 0.65mi | 3/2.5 | 1,152 (+3%) | 2mo | $275,000 | $239 | 62 |
| 803 Taylor Ave | 0.47mi | 3/2.5 | 1,253 (+12%) | 1mo | $320,000 | $255 | 56 |
| 807 Linden Ave | 0.66mi | 2/2.5 (-1) | 1,225 (+9%) | 2mo | $425,000 | $347 | 46 |
Match score weights: distance 35% · size 25% · config 20% · recency 20%. Top-matched comps best support the ARV.
Projected returns pro-forma
-3.0% appreciation · 0.19% rent growth · sell at horizon
- IRR
- -0.7%
- Equity multiple
- 0.97×
- Total profit
- $-1,427
- Equity at exit
- $27,569
- IRR
- 5.8%
- Equity multiple
- 1.38×
- Total profit
- $19,662
- Equity at exit
- $15,987
Cash invested: $51,772 (down + closing). Projections, not guarantees.
Landlord ↔ Tenant lean methodology
- Overall (STATE)
- 83 Strongly Landlord-Friendly
- State Kentucky
- 83 Strongly Landlord-Friendly · R+16
- County
- — inherits STATE
- City
- — inherits STATE
ZIP-level market 41073
- Rents YoY
- 0.2%
- Active inventory
- 49
- Price-to-rent
- 6.9×
Monthly cashflow live
- Estimated rent
- $2,219 high interval (Pro) →
- Mortgage (P&I)
- −$970
- Tax from tax record
- −$162 /mo · $1,948/yr
- Insurance
- −$77
- HOA
- −$0
- Vacancy / Maint / Mgmt
- −$466
- Net cashflow
- $544
Break-even live
UW: 25.0% down · 7.5% · 30yr · 1.5% tax · 5.0% vac · 8.0% maint · 8.0% mgmt
Financing live
Cash to close
- Down payment
- $46,225
- Closing costs
- $5,547
- Reserves months
- —
- Total cash needed
- —
Loan-product check · same deal, 3 products live
Conventional
25% down · 7.5% · 30yr
- Down + closing
- —
- Monthly P&I
- —
- Monthly cashflow
- —
- DSCR
- —
- Eligible?
- —
Personal DTI + credit; lowest rate.
DSCR
20% down · 8.5% · 30yr
- Down + closing
- —
- Monthly P&I
- —
- Monthly cashflow
- —
- DSCR
- —
- Eligible?
- —
No personal income docs; deal must DSCR.
Hard money
10% down · 12.0% · 12mo
- Down + closing
- —
- Monthly P&I
- —
- Monthly cashflow
- —
- DSCR
- —
- Eligible?
- —
Short-term bridge; refi at stabilization.
Rent comps 38 comps
| Address | Beds | Baths | Sqft | Rent | $/sqft | DOM | Units | Dist |
|---|---|---|---|---|---|---|---|---|
| 324 Fairfield Ave Unit 4 Bellevue, KY | 2.0 | 1.0 | 1095 | $1,545 | $1.41 | 21d | 1 | 0.21mi |
| 324 Fairfield Ave Unit 1 Bellevue, KY | 2.0 | 1.0 | 1080 | $1,685 | $1.56 | 3d | 1 | 0.21mi |
| 239 Grandview Ave Bellevue, KY | 2.0 | 2.0 | 1093 | $1,645 | $1.50 | 4d | 2 | 0.25mi |
| 236 Ward Ave Bellevue, KY | 3.0 | 2.0 | 1500 | $2,585 | $1.72 | 12d | 1 | 0.30mi |
| 1243 Martin Dr Unit 1056135P Cincinnati, OH | 2.0 | 1.0 | 1184 | $3,099 | $2.62 | 1d | 1 | 0.70mi |
| 100 Aqua Way Newport, KY | 1.0–3.0 | 1.0–2.0 | 1092 | $3,850 | $3.53 | 1d | 4 | 0.78mi |
| 1137 Fuller St Unit 1056121P Cincinnati, OH | 1.0–2.0 | 1.0 | 1135 | $3,653 | $3.22 | 1d | 2 | 0.82mi |
| 1055 St Paul Pl Cincinnati, OH | 3.0 | 1.0–2.0 | 975 | $2,995 | $3.07 | 1d | 10 | 0.92mi |
| 814 Washington Ave Unit 2 Newport, KY | 2.0 | 2.0 | 1450 | $1,500 | $1.03 | 23d | 1 | 0.92mi |
| 929 Boone St Newport, KY | 2.0 | 2.0 | 1458 | $1,495 | $1.03 | 43d | 1 | 0.92mi |
| 601 E Pete Rose Way Cincinnati, OH | 3.0 | 1.0–2.5 | 1039 | $2,936 | $2.83 | 1d | 22 | 0.97mi |
| 427 Oregon St Cincinnati, OH | 1.0–2.0 | 1.0 | 980 | $2,800 | $2.86 | 1d | 4 | 1.04mi |
| 621 E Mehring Way Cincinnati, OH | 1.0–2.0 | 1.0–2.0 | 938 | $2,249 | $2.40 | 1d | 12 | 1.08mi |
| 1044 Washington Ave #2 Newport, KY | 2.0 | 2.0 | 1250 | $1,800 | $1.44 | 43d | 1 | 1.09mi |
| 2015 Edgecliff Pt Unit 4 Cincinnati, OH | 2.0 | 2.0 | 1200 | $1,595 | $1.33 | 4d | 1 | 1.16mi |
| 2118 Saint James Ave Cincinnati, OH | 2.0 | 1.0 | 1005 | $1,650 | $1.64 | 23d | 1 | 1.16mi |
| 911 Putnam St #2 Newport, KY | 2.0 | 1.0 | 1000 | $1,600 | $1.60 | 21d | 1 | 1.21mi |
| 210 W 5th St Newport, KY | 1.0–2.0 | 1.0–2.0 | 845 | $1,800 | $2.13 | 3d | 15 | 1.24mi |
| 203 W 8th St Newport, KY | 2.0 | 1.5 | 1456 | $2,300 | $1.58 | 21d | 1 | 1.30mi |
| 128 W 9th St Newport, KY | 2.0 | 1.0 | 1012 | $1,650 | $1.63 | 2d | 1 | 1.30mi |
| 2132 Gilbert Ave Unit A Cincinnati, OH | 2.0 | 2.5 | 1450 | $2,250 | $1.55 | 4d | 1 | 1.30mi |
| 345 E 7th St Cincinnati, OH | 2.0 | 1.0–2.0 | 1184 | $4,300 | $3.63 | 3d | 18 | 1.31mi |
| 509 E 12th St Cincinnati, OH | 1.0–2.0 | 1.0 | 796 | $1,200 | $1.51 | 4d | 1 | 1.34mi |
| 509 E 12th St Cincinnati, OH | 2.0 | 1.0 | 1000 | $1,200 | $1.20 | 14d | 2 | 1.34mi |
| 960 Francisco St Unit 107 Cincinnati, OH | 2.0 | 2.0 | 912 | $1,649 | $1.81 | 23d | 1 | 1.34mi |
| 309 Sycamore St #201 Cincinnati, OH | 2.0 | 2.0 | 850 | $1,600 | $1.88 | 23d | 1 | 1.35mi |
| 634 Sycamore St Cincinnati, OH | 2.0 | 1.0–1.5 | 1261 | $2,615 | $2.07 | 4d | 9 | 1.37mi |
| 1 E 4th St Unit 1404477P Cincinnati, OH | 2.0 | 1.0 | 618 | $3,476 | $5.62 | 21d | 2 | 1.41mi |
| 1065 Manhattan Blvd Dayton, KY | 1.0–3.0 | 1.0–2.0 | 1038 | $2,749 | $2.65 | 1d | 19 | 1.43mi |
| 2330 Victory Pkwy Cincinnati, OH | 1.0–2.0 | 1.0–2.0 | 693 | $1,999 | $2.88 | 2d | 6 | 1.43mi |
| 224 E 8th St Cincinnati, OH | 1.0–2.0 | 1.0–2.0 | 1200 | $2,462 | $2.05 | 1d | 5 | 1.44mi |
| 1304 Broadway Unit 1056130P Cincinnati, OH | 1.0–5.0 | 1.0–4.0 | 2072 | $5,808 | $2.80 | 10d | 2 | 1.46mi |
| 2401 Salutaris Ave Cincinnati, OH | 1.0–2.0 | 1.0 | 800 | $1,300 | $1.62 | 23d | 1 | 1.47mi |
| 1118 Sycamore St Cincinnati, OH | 2.0 | 1.0–2.0 | 891 | $3,194 | $3.58 | 2d | 22 | 1.49mi |
| 830 Main St Cincinnati, OH | 2.0 | 1.0–2.0 | 756 | $1,895 | $2.50 | 4d | 6 | 1.49mi |
| 1326 Broadway Unit 1324946P Cincinnati, OH | 1.0–3.0 | 1.0–3.0 | 1162 | $10,683 | $9.19 | 23d | 2 | 1.49mi |
| 721 Main St Cincinnati, OH | 2.0 | 1.0–2.0 | 991 | $3,205 | $3.23 | 1d | 15 | 1.49mi |
| 424 Liberty Hl Unit 1056033P Cincinnati, OH | 3.0 | 2.0 | 1453 | $5,780 | $3.98 | 1d | 1 | 1.50mi |
Listing history 31 events
-
2026-06-18status $184,900 Pending 75 DOM
-
2026-06-17days on market $184,900 Active 75 DOM
-
2026-06-16days on market $184,900 Active 74 DOM
-
2026-06-15days on market $184,900 Active 73 DOM
-
2026-06-13days on market $184,900 Active 71 DOM
-
2026-06-13pricedays on market $184,900 Active 70 DOM
-
2026-06-09days on market $189,900 Active 67 DOM
-
2026-06-08days on market $189,900 Active 66 DOM
-
2026-06-07days on market $189,900 Active 65 DOM
-
2026-06-03days on market $189,900 Active 61 DOM
-
2026-06-02days on market $189,900 Active 60 DOM
-
2026-06-01days on market $189,900 Active 59 DOM
-
2026-05-31days on market $189,900 Active 58 DOM
-
2026-05-15price $199,900 366-char remark
Show marketing remark (366 chars)
Welcome to this charming 2-bedroom, 1-bath home in the heart of Bellevue! Featuring inviting living spaces and plenty of natural light, this property offers both comfort and character. Enjoy a prime location just minutes from downtown Cincinnati, local shops, dining, and the riverfront. Perfect for homeowners seeking convenience and a vibrant community atmosphere!
-
2026-04-04$209,900 Active 366-char remark
Show marketing remark (366 chars)
Welcome to this charming 2-bedroom, 1-bath home in the heart of Bellevue! Featuring inviting living spaces and plenty of natural light, this property offers both comfort and character. Enjoy a prime location just minutes from downtown Cincinnati, local shops, dining, and the riverfront. Perfect for homeowners seeking convenience and a vibrant community atmosphere!
-
2018-01-17soldstatus $399,400
-
2018-01-17soldstatus $86,100
-
2018-01-17soldstatus $399,400
-
2015-10-28soldstatus $37,000 262-char remark
Show marketing remark (262 chars)
Attention Investors! 1 finished bedroom, 3 unfinished rooms upstairs, 2 full baths, first floor laundry, first floor master, large kitchen w/some updates, hardwood floors, corner lot with plenty of parking! Needs TLC. Subject to Third Party Approval. Sold As Is.
-
2015-03-02$50,000 262-char remark
Show marketing remark (262 chars)
Attention Investors! 1 finished bedroom, 3 unfinished rooms upstairs, 2 full baths, first floor laundry, first floor master, large kitchen w/some updates, hardwood floors, corner lot with plenty of parking! Needs TLC. Subject to Third Party Approval. Sold As Is.
-
2014-12-31historical
-
2014-04-12$99,900
-
2000-06-26soldstatus $48,000
-
2000-06-26soldstatus $48,000
-
2000-06-13soldstatus $49,900
-
2000-02-25$51,900
-
1995-07-26soldstatus $51,000
-
1995-07-25soldstatus $51,000
-
1995-05-17$49,900
-
1992-09-23soldstatus $40,000
-
1989-08-01soldstatus $19,500
ⓘ Source: listings_history table (triggers on properties + properties_extension) + one-shot
backfill from property_details.listing_events for pre-trigger history.
Tax reassessment forecast KY · Resets to sale price
- Current annual tax
- $1,948 · $162/mo
- Projected year-2 tax
- $1,948 · $162/mo
- Expected delta
- $0/yr ($0/mo · 0.0%)
ⓘ Screening estimate from a state-policy table — verify with the county assessor before closing.
Climate risk First Street
- Flood 1/10 Low FEMA zone X (unshaded) · 0% chance over 30 yrs
- Wildfire 1/10 Low
- Heat 5/10 Major 7 d/yr ≥103°F today · 19 d/yr by 30 yrs out
- Wind 2/10 Low 100% chance of damaging wind over 30 yrs
- Air quality 3/10 Moderate 2 unhealthy d/yr today · 3 by 30 yrs out
Nearby sold comps map
Loading sold comps map…
Walkable amenities ~0.75 mi
Loading nearby amenities…
Taxation est. · year 1
- Rental income
- $26,627
- − Mortgage interest
- −$10,357
- − Property taxes
- −$1,948
- − Insurance
- −$924
- − Repairs & maintenance
- −$2,130
- − Management
- −$2,130
- − Depreciation
- −$5,379
- Taxable income
- $3,758
- Est. tax owed @ 24.0%
- −$902
- After-tax cash flow
- $5,626/yr
For passive investors: Depreciation is non-cash, so a rental often shows a tax loss while cash-flowing — sheltering income. Rental losses are passive: they offset passive income freely, and up to $25,000/yr can offset ordinary (W-2) income if you actively participate and your MAGI is under $100k (phasing out to $0 by $150k); unused losses carry forward. On sale, claimed depreciation is recaptured at up to 25%, and gains may owe capital-gains tax (a 1031 exchange can defer both). Figures are a year-1 estimate at your 24.0% rate — not tax advice; consult a CPA.
Schools (NCES district)
- District
- Bellevue Independent
- NCES district ID
- 2100420
- Math proficiency
- 17% ▼ -16.00%
- Reading proficiency
- 33% ▼ -12.00%
- Median HH income
- $51,374
- Composite
- 22.13/100
- National rank
- #8173
- State rank
- #136 of 165 in KY
Livability — Bellevue
- Score
- 92/100
- State rank
- #8
- US rank
- #24
Category grades
Schools grade is shown separately in the Schools card above.
Census & demographics
- Census place
- Bellevue, KY
- County
- Campbell County · 84,793 people
- City population
- 5,636
- Metro
- Cincinnati, OH-KY-IN
- Population (ZIP)
- 5,636
- Household income
- $71,166
- Rent vs Own
- Severe rent burden
- 173.0
Population outlook (Campbell County) Hauer SSP2
- Today (2025)
- 95,668 people
- By 2030
- 96,886 · +1.3%
- By 2040
- 97,734 · +2.2%
- By 2050
- 96,413 · +0.8%
- By 2075
- 90,211 · -5.7%
- By 2100
- 79,434 · -17.0%
Race, ethnicity, and origin ACS 2023
- Neighborhood character
- Predominantly White (90%)
- Race & ethnicity
- White 90% Hispanic / Latino 4% Two or more races 2%
- Common ancestry
- Lithuanian 3% Slovak 3% Iranian 2%
- Foreign-born
- 2% · Canada
- Languages at home
- 95% English-only · Spanish 3% German/W. Germanic 2%
Political lean MEDSL · Campbell
- 2024 margin
- R (+19.7) · D 39.2% · R 58.9% · Other 1.9%
- 2008→2024 swing
- +1.2pp toward D · 2008: -20.9pp · 2024: -19.7pp
- All cycles
- 2024: R+19.7 2020: R+18.6 2016: R+24.5 2012: R+22.8 2008: R+20.9
Not yet ingested
- Civics
- —
Market trends
- HPI YoY
- ▼ -186.80%
- Current HPI
- 252.0078
- Rent YoY
- ▲ 0.19%
- Metro
- Cincinnati, OH-KY-IN
- State GDP YoY
- ▲ 1.81%
- F500 in state
- 4
Industry mix (Fortune 500 HQ in KY)
| Industry | F500 HQs | Revenue |
|---|---|---|
| Healthcare | 1 | $118B |
|
||
| Food / Beverage | 1 | $7B |
|
||
Price history
+925.1% since first listed18 events — show timeline
- 2026-05-15 Price Changed $199,900 NKMLS
- 2026-04-04 Listed $209,900 NKMLS
- 2018-01-17 Sold (Public Records) $399,400 Public Records
- 2018-01-17 Sold (Public Records) $86,100 Public Records
- 2018-01-17 Sold (Public Records) $399,400 Public Records
- 2015-10-28 Sold (MLS) $37,000 NKMLS
- 2015-03-02 Listed $50,000 NKMLS
- 2014-12-31 Listing Removed — NKMLS
- 2014-04-12 Listed $99,900 NKMLS
- 2000-06-26 Sold (Public Records) $48,000 Public Records
- 2000-06-26 Sold (Public Records) $48,000 Public Records
- 2000-06-13 Sold (MLS) $49,900 NKMLS
- 2000-02-25 Listed $51,900 NKMLS
- 1995-07-26 Sold (Public Records) $51,000 Public Records
- 1995-07-25 Sold (MLS) $51,000 NKMLS
- 1995-05-17 Listed $49,900 NKMLS
- 1992-09-23 Sold (Public Records) $40,000 Public Records
- 1989-08-01 Sold (Public Records) $19,500 Public Records
Property tax history
+6.7%/yrLatest (2025): $1,948 · +0.6% YoY. Source: county tax records.
Cash-flow waterfall
monthlySold comps — $/sqft
last 12 mo · ≤1 miLoading sold comps…