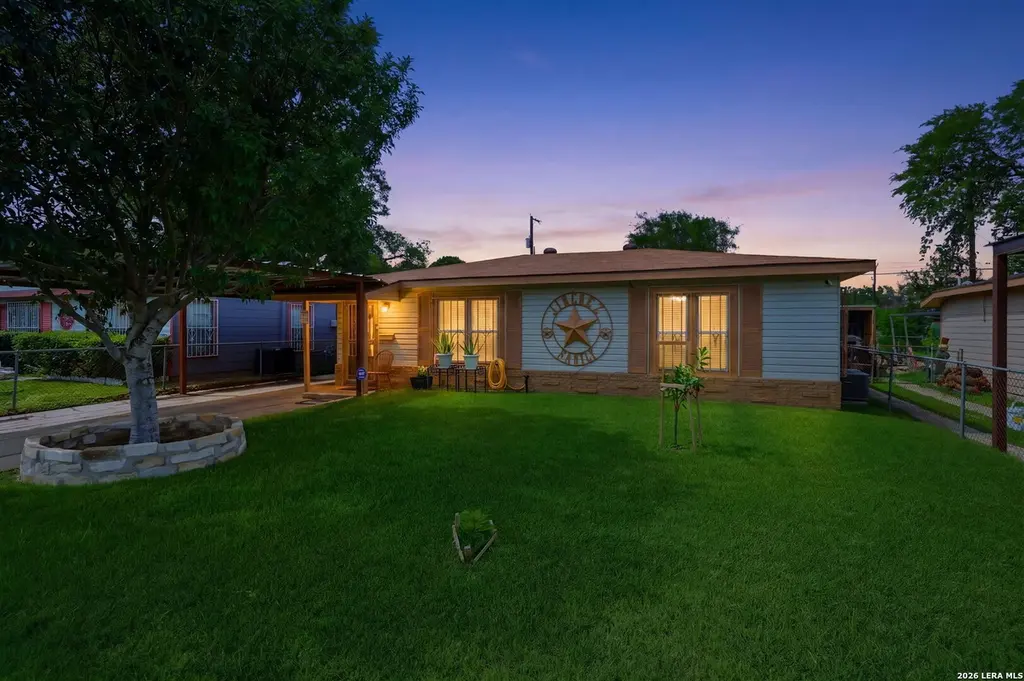
2123 Beechaven Dr · San Antonio, TX
Flood risk 1/10 · Minimal
- FEMA flood zone
- X (unshaded)
- Chance of flooding over 30 yrs
- 0.0%
- Est. flood insurance / yr
- $507 – $1,088
Fire risk 1/10 · Minimal
- Est. fire insurance / yr
- $1,222 – $2,270
Heat risk 8/10 · Major
- Hot days now (above 109°F)
- 7 days/yr
- Hot days in 30 yrs
- 21 days/yr
Wind risk 7/10 · Major
- Chance of severe wind over 30 yrs
- 78.0%
Air-quality risk 2/10 · Minimal
- Unhealthy air days now
- 1 days/yr
- Unhealthy air days in 30 yrs
- 2 days/yr
Risk factors via First Street. Map © Google.
Why this score? — see what drove the C- grade
The composite is a weighted blend of 9 inputs, each scored 0–100. Each bar is that input's sub-score; the figure is the points it added to the 100-point composite (weight × sub-score).
- Cash flow +11.1/30.0
- ARV discount +10.5/15.0
- Appreciation +10.0/10.0
- Rent growth +4.4/5.0
- Livability +4.0/5.0
- 1% rule +3.9/10.0
- DSCR +3.2/10.0
- Condition / age +2.5/5.0
- Schools +1.4/10.0
$170,000
🖨 Deal sheet 📄 Offer letter ✓ Due diligence
Listing remarks MLS
WOW! CLEAN AND READY TO MOVE IN. 3 BEDROOM. REMODELED. MOSTLY WOOD LAMINATE FLOORING. REFRIGERATOR, STOVE, WASHER, AND DRYER ARE INCLUDED. 2 WINDOW UNITS AND NEWER GAS HEATING SYSTEM. THIS ONE WILL NOT LAST!!!
Key facts
- 5,980 sq ft lot
- Built 1946
- Listed 8 days
Property features AI
Finance
- Financial info: No down payment resource indicated
- HOA & community: Subdivision: CUPPLES/ZARZAMORA
Exterior
- Parking: Level drive
- Security: Doors swing in
- Utilities: Water: SAWS (city water); Sewer: SAWS (city sewer); Gas: CPS; Electricity: CPS; City garbage service
- Home design: Pre-owned single-family home; Level entry (no steps); Accessible / adaptive features (grab bars in bathroom(s), vehicle transfer area, multiple access exits)
- Construction: Approximately 80 years old; Siding exterior; Slab foundation; Composition roof
- Exterior features: Covered patio; Patio slab; Chain link fence; Storage building / shed; Mature trees; Level lot; Street paved with curbs, sidewalks and streetlights; Alley access; City street
Interior
- Kitchen: Cooktop; Self-cleaning oven; Stove/Range; Gas cooking; Kitchen approx. 16 x 11
- Bedrooms: Primary bedroom on lower level, approx. 18 x 11; Bedroom 2 approx. 15 x 11; Bedroom 3 approx. 10 x 11
- Flooring: Ceramic tile; Vinyl; Laminate
- Bathrooms: One full bathroom and one half bathroom; Primary bathroom with tub/shower combination and single vanity (approx. 7 x 7)
- Heating & cooling: Central heating (natural gas); Central air conditioning
- Interior features: Ceiling fans; Eat-in kitchen with breakfast bar; Florida room; Utility room inside; Cable TV available; High-speed internet available; All bedrooms on lower level; Laundry on main level; All window coverings remain; City garbage service
- Laundry & utility: Washer connection; Dryer connection; Laundry located on main level
Neighborhood map
What this means for you Summary
Snapshot
- This is a 3-bed/1.0-bath single-family listed at $170k.
Deal economics
- At list price, monthly cash flow is $-69 ($-827/yr) — negative.
- To cash-flow at today's rent, offer at most $158k (7.2% below list).
- To meet the 1% rule (rent ≥ 1% of price), the offer needs to be $152k (10.8% below list).
- Recommended offer: $152k (10.8% below list) — sets the bar for 1% rule.
- Cap rate 5.8% vs local median 3.8% in San Antonio — top-decile yield for the area; either an underpriced asset or a hidden risk that comps aren't pricing in. Stress-test before assuming the spread holds.
Location & tenants
- Location reads 80/100 on livability (#31 in TX, #1,616 nationally) — a professional / high-income tenant draw. Strengths: amenities A+, commute A+, cost of living A+; Watch: crime F.
- San Antonio ISD (urban): math 12% / reading 22% proficiency, ranked #805 of 826 in TX (top 98%) — low school quality limits family demand, transient renter base, plan for 1-2y turnover; 80% free/reduced lunch — lower-income household profile, screen leases tightly.
- Zoned schools: Sarah S King El (math 22% / reading 27%, grade F, #3,052 of 4,322 statewide, top 74%, 564 students, 98% FRL); Lanier H S (math 9% / reading 15%, grade F, #1,554 of 1,632 statewide, top 95%, 1,547 students, 97% FRL) — zoned schools average 97% FRL vs 80% district-wide (17 pts higher); higher-poverty schools than district average — tighter screening recommended.
- Market conditions: Rents rising fast (+7.7%/yr); 154 active listings in the ZIP; 12 comparable units currently listed for rent nearby; rentals lingering (median 44d on market — plan ~5-8 weeks vacancy on turnover, expect pricing pressure); 50% of comp listings sitting > 30 days — soft ceiling on asking rent; lower-income renter base — watch delinquency; 8,308 units permitted in Bexar County in 2024 (2,506 in 5+ unit buildings).
Forward outlook
- In year one you build about $18k of equity ($1k loan paydown + $17k appreciation (10.0% local appreciation)).
- Bexar County population projected at +50% by 2050 — long-run rental-demand tailwind backs the buy-and-hold thesis.
- At projected returns (10.0% appreciation + 7.7% rent growth), your $48k cash investment doubles in ~3 years — after that, you're playing with house money.
- By year 3, paydown + projected appreciation supports a ~$46k cash-out refi (75% LTV) — recoverable capital for the next deal without selling this one.
Negotiation context
- Only 8 days on market — expect competitive offers; lowballing is unlikely to land.
- 2 sale attempts since 11y ago with the ask held roughly flat each time — persistent listings suggest the price (not the market) is what's stuck; bring a comps-based counter.
Risks & watch-outs
- Watch-outs: built in 1946 — expect roof / HVAC / electrical / plumbing capex.
- Climate carrying-cost: major wind risk, 78% chance of damaging wind over 30y; extreme-heat days projected 7→21/yr by 2055 (HVAC capex compounding) — expect insurance premiums to compound above CPI over the hold.
Questions for the listing agent
- What do current leases actually rent for vs. the listed asking? Can we see a recent rent roll and the last 12 months of T-12 income?
- Built in 1946 — when were the roof, HVAC, electrical panel, plumbing, and water heater last replaced?
- Is there a deadline driving the sale (1031 exchange, divorce, estate, relocation)? That informs how much negotiation room exists.
- Crime grade is F in this area — have there been break-ins, vandalism, or insurance claims at this property in the last 3 years? What carrier currently insures it and at what premium?
- What's the average days-on-market for RENTAL listings here right now (not sales)? A rising rental-DOM trend means longer vacancies and softer asking-rent achievability than the comps imply.
- What's the recent tenant-quality profile in this submarket — average credit score on applications, eviction rate, late-payment / NSF rate, and stable-employment percentage? A property-management company in the area should have these aggregated.
- How much new for-sale + rental construction is in the pipeline within 1–3 miles? Heavy new supply typically softens prices + rents 12–24 months out; constrained supply supports both.
Investment metrics
- 1% rule
- 0.89% ✗
- Cap rate
- 5.81%
- Cash-on-cash
- -1.74%
- DSCR
- 0.92
- GRM
- 9.3
CMA / ARV
- ARV (on-the-fly)
- $182,016
- Comps found
- 3
Show comp detail 3 sales within ~0.75 mi
| Address | Dist | Beds/Ba | Sqft | Sold | Price | $/sf | Match |
|---|---|---|---|---|---|---|---|
| 270 Lansing Ln | 0.23mi | 3/2.0 | 1,850 (-2%) | 15mo | $199,000 | $108 | 69 |
| 710 Darby | 0.63mi | 3/2.0 | 1,672 (-12%) | 3mo | $160,000 | $96 | 44 |
| 303 Carolyn St | 0.43mi | 3/2.0 | 1,669 (-12%) | 24mo | $115,000 | $69 | 36 |
Match score weights: distance 35% · size 25% · config 20% · recency 20%. Top-matched comps best support the ARV.
Projected returns pro-forma
10.0% appreciation · 7.73% rent growth · sell at horizon
- IRR
- 24.7%
- Equity multiple
- 3.01×
- Total profit
- $95,834
- Equity at exit
- $153,149
- IRR
- 23.2%
- Equity multiple
- 7.39×
- Total profit
- $304,354
- Equity at exit
- $330,273
Cash invested: $47,600 (down + closing). Projections, not guarantees.
Landlord ↔ Tenant lean methodology
- Overall (STATE)
- 87 Strongly Landlord-Friendly
- State Texas
- 87 Strongly Landlord-Friendly · R+5
- County
- — inherits STATE
- City
- — inherits STATE
ZIP-level market 78207
- Home prices YoY
- 15.2%
- Rents YoY
- 7.7%
- Active inventory
- 154
- Price-to-rent
- 9.3×
Monthly cashflow live
- Estimated rent
- $1,516 high interval (Pro) →
- Mortgage (P&I)
- −$891
- Tax from tax record
- −$304 /mo · $3,650/yr
- Insurance
- −$71
- HOA
- −$0
- Vacancy / Maint / Mgmt
- −$318
- Net cashflow
- $-69
Break-even live
UW: 25.0% down · 7.5% · 30yr · 1.5% tax · 5.0% vac · 8.0% maint · 8.0% mgmt
Financing live
Cash to close
- Down payment
- $42,500
- Closing costs
- $5,100
- Reserves months
- —
- Total cash needed
- —
Loan-product check · same deal, 3 products live
Conventional
25% down · 7.5% · 30yr
- Down + closing
- —
- Monthly P&I
- —
- Monthly cashflow
- —
- DSCR
- —
- Eligible?
- —
Personal DTI + credit; lowest rate.
DSCR
20% down · 8.5% · 30yr
- Down + closing
- —
- Monthly P&I
- —
- Monthly cashflow
- —
- DSCR
- —
- Eligible?
- —
No personal income docs; deal must DSCR.
Hard money
10% down · 12.0% · 12mo
- Down + closing
- —
- Monthly P&I
- —
- Monthly cashflow
- —
- DSCR
- —
- Eligible?
- —
Short-term bridge; refi at stabilization.
Rent comps 12 comps
| Address | Beds | Baths | Sqft | Rent | $/sqft | DOM | Units | Dist |
|---|---|---|---|---|---|---|---|---|
| 2003 S Zarzamora St San Antonio, TX | 1.0–4.0 | 1.0–2.0 | 1028 | $1,257 | $1.22 | 23d | 1 | 0.42mi |
| 2910 S Laredo St Unit 2 San Antonio, TX | 2.0 | 2.0 | 2127 | $1,295 | $0.61 | 3d | 1 | 0.54mi |
| 1906 Montezuma St San Antonio, TX | 2.0 | 1.5 | 1790 | $1,300 | $0.73 | 43d | 1 | 0.88mi |
| 542 Drake Ave San Antonio, TX | 3.0 | 2.0 | 1368 | $1,875 | $1.37 | 43d | 1 | 1.00mi |
| 2114 Jupiter St San Antonio, TX | 3.0 | 3.0 | 1233 | $1,457 | $1.18 | 21d | 1 | 1.03mi |
| 333 Frio City Rd Unit 1 San Antonio, TX | 2.0 | 1.0 | 1350 | $1,350 | $1.00 | 10d | 1 | 1.07mi |
| 709 S Chupaderas St San Antonio, TX | 3.0 | 2.0 | 1518 | $1,345 | $0.89 | 23d | 1 | 1.22mi |
| 410 N Park Blvd San Antonio, TX | 3.0 | 2.0 | 1326 | $1,650 | $1.24 | 43d | 1 | 1.24mi |
| 323 Thompson Pl San Antonio, TX | 4.0 | 2.0 | 1600 | $1,800 | $1.12 | 43d | 1 | 1.26mi |
| 242 Drake Ave Unit 242 San Antonio, TX | 3.0 | 2.0 | 1472 | $1,700 | $1.15 | 43d | 1 | 1.37mi |
| 2425 Monterey St San Antonio, TX | 3.0 | 2.0 | 1416 | $2,000 | $1.41 | 43d | 1 | 1.48mi |
| 2811 Buena Vista St San Antonio, TX | 4.0 | 2.0 | 1750 | $2,350 | $1.34 | 23d | 1 | 1.48mi |
Listing history 6 events
-
2026-06-13statusdays on market $170,000 Pending 8 DOM
-
2026-06-09days on market $170,000 Active Option 6 DOM
-
2026-06-08days on market $170,000 Active Option 5 DOM
-
2026-06-07days on market $170,000 Active Option 4 DOM
-
2026-06-04remarks 451-char remark
-
2026-06-04$170,000 Active Option 1 DOM
ⓘ Source: listings_history table (triggers on properties + properties_extension) + one-shot
backfill from property_details.listing_events for pre-trigger history.
Tax reassessment forecast TX · Resets to sale price
- Current annual tax
- $3,650 · $304/mo
- Projected year-2 tax
- $3,650 · $304/mo
- Expected delta
- $0/yr ($0/mo · 0.0%)
ⓘ Screening estimate from a state-policy table — verify with the county assessor before closing.
Climate risk First Street
- Flood 1/10 Low FEMA zone X (unshaded) · 0% chance over 30 yrs
- Wildfire 1/10 Low
- Heat 8/10 Severe 7 d/yr ≥109°F today · 21 d/yr by 30 yrs out
- Wind 7/10 Severe 78% chance of damaging wind over 30 yrs
- Air quality 2/10 Low 1 unhealthy d/yr today · 2 by 30 yrs out
Nearby sold comps map
Loading sold comps map…
Walkable amenities ~0.75 mi
Loading nearby amenities…
Taxation est. · year 1
- Rental income
- $18,190
- − Mortgage interest
- −$9,523
- − Property taxes
- −$3,650
- − Insurance
- −$850
- − Repairs & maintenance
- −$1,455
- − Management
- −$1,455
- − Depreciation
- −$4,945
- Taxable loss
- −$3,688
- Est. tax savings @ 24.0%
- +$885
- After-tax cash flow
- $58/yr
For passive investors: Depreciation is non-cash, so a rental often shows a tax loss while cash-flowing — sheltering income. Rental losses are passive: they offset passive income freely, and up to $25,000/yr can offset ordinary (W-2) income if you actively participate and your MAGI is under $100k (phasing out to $0 by $150k); unused losses carry forward. On sale, claimed depreciation is recaptured at up to 25%, and gains may owe capital-gains tax (a 1031 exchange can defer both). Figures are a year-1 estimate at your 24.0% rate — not tax advice; consult a CPA.
Schools (NCES district)
- District
- San Antonio ISD
- NCES district ID
- 4838730
- Math proficiency
- 12% ▼ -21.00%
- Reading proficiency
- 22% ▼ -7.00%
- Median HH income
- $30,952
- Composite
- 13.57/100
- National rank
- #9512
- State rank
- #805 of 826 in TX
Livability — San Antonio
- Score
- 80/100
- State rank
- #31
- US rank
- #1616
Category grades
Schools grade is shown separately in the Schools card above.
Census & demographics
- Census place
- San Antonio, TX
- County
- Bexar County · 1,990,555 people
- City population
- 1,806,925
- Metro
- San Antonio-New Braunfels, TX
- Population (ZIP)
- 55,474
- Household income
- $32,472
- Rent vs Own
- Severe rent burden
- 2789.0
Population outlook (Bexar County) Hauer SSP2
- Today (2025)
- 2,336,851 people
- By 2030
- 2,560,728 · +9.6%
- By 2040
- 3,020,569 · +29.3%
- By 2050
- 3,493,522 · +49.5%
- By 2075
- 4,668,459 · +99.8%
- By 2100
- 5,533,242 · +136.8%
Race, ethnicity, and origin ACS 2023
- Neighborhood character
- Predominantly Hispanic (88%)
- Race & ethnicity
- Hispanic / Latino 88% Two or more races 41% White 6% Black 5% Native American 2%
- Hispanic origin (detail)
- Mexican 79%
- Foreign-born
- 19% · Canada
- Languages at home
- 39% English-only · Spanish 60%
Political lean MEDSL · Bexar
- 2024 margin
- Lean D (+9.8) · D 54.3% · R 44.6% · Other 1.1%
- 2008→2024 swing
- +4.2pp toward D · 2008: 5.6pp · 2024: 9.8pp
- All cycles
- 2024: D+9.8 2020: D+18.2 2016: D+13.5 2012: D+4.6 2008: D+5.6
Not yet ingested
- Civics
- —
Market trends
- HPI YoY
- ▲ 34.92%
- Current HPI
- 264.7559
- Rent YoY
- ▲ 7.73%
- Metro
- San Antonio-New Braunfels, TX
- State GDP YoY
- ▲ 3.95%
- F500 in state
- 110
Industry mix (Fortune 500 HQ in TX)
| Industry | F500 HQs | Revenue |
|---|---|---|
| Energy | 16 | $1,198B |
|
||
| Technology | 5 | $198B |
|
||
| Engineering / Construction | 4 | $72B |
|
||
| Energy Services | 3 | $60B |
|
||
| Utilities | 3 | $41B |
|
||
| Healthcare | 2 | $330B |
|
||
Price history
+91.4% since first listed7 events — show timeline
- 2026-06-03 Contingent — LERA
- 2026-06-03 Listed $170,000 LERA
- 2016-03-04 Sold (MLS) — LERA
- 2015-12-31 Pending — LERA
- 2015-09-22 Pending — LERA
- 2015-08-28 Contingent — LERA
- 2015-08-19 Listed $88,800 LERA
Property tax history
+8.5%/yrLatest (2025): $3,650 · +10.0% YoY. Source: county tax records.
Cash-flow waterfall
monthlySold comps — $/sqft
last 12 mo · ≤1 miLoading sold comps…