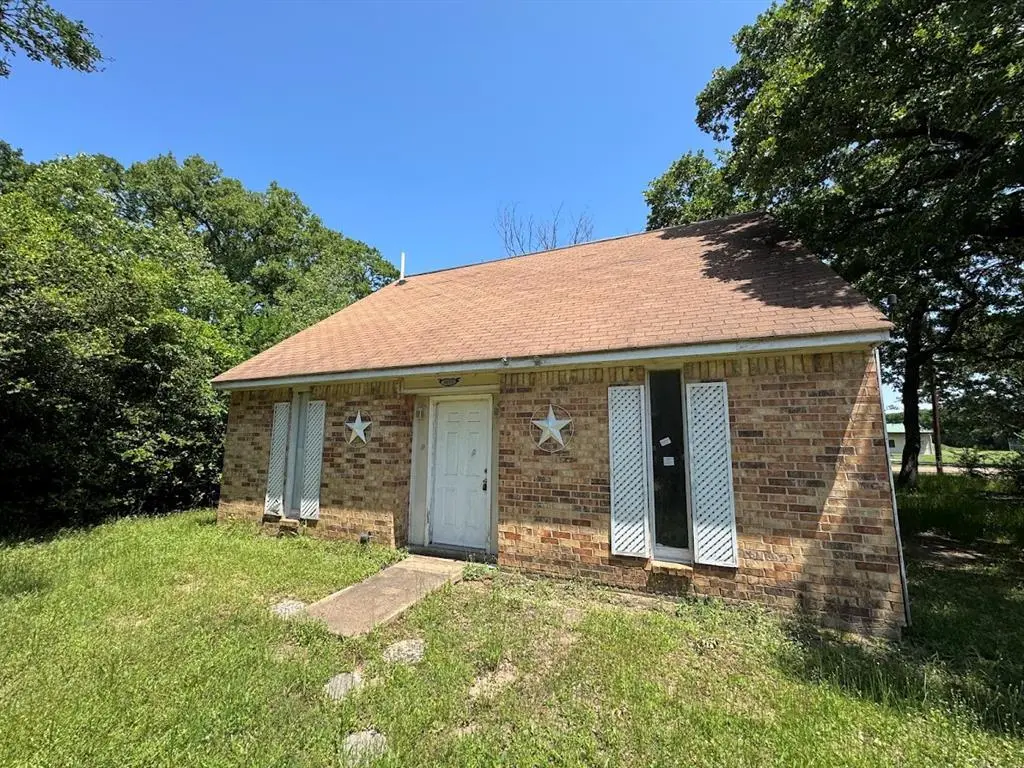
6133 Inca Dr · Enchanted Oaks, TX
Flood risk 1/10 · Minimal
- FEMA flood zone
- X (unshaded)
- Chance of flooding over 30 yrs
- 0.0%
- Est. flood insurance / yr
- $507 – $1,088
Fire risk 3/10 · Minor
- Est. fire insurance / yr
- $1,222 – $2,270
Heat risk 7/10 · Major
- Hot days now (above 109°F)
- 7 days/yr
- Hot days in 30 yrs
- 26 days/yr
Wind risk 6/10 · Moderate
- Chance of severe wind over 30 yrs
- 65.0%
Air-quality risk 2/10 · Minimal
- Unhealthy air days now
- 0 days/yr
- Unhealthy air days in 30 yrs
- 1 days/yr
Risk factors via First Street. Map © Google.
Why this score? — see what drove the C grade
The composite is a weighted blend of 9 inputs, each scored 0–100. Each bar is that input's sub-score; the figure is the points it added to the 100-point composite (weight × sub-score).
- Cash flow +20.8/30.0
- ARV discount +14.1/15.0
- DSCR +6.6/10.0
- 1% rule +5.1/10.0
- Schools +3.2/10.0
- Livability +3.0/5.0
- Condition / age +2.5/5.0
- Rent growth +1.1/5.0
- Appreciation +0.0/10.0
$179,999
🖨 Deal sheet 📄 Offer letter ✓ Due diligence
Listing remarks MLS
NEAR CEDAR CREEK LAKE! Charming property located in the heart of Mabank, just minutes from Cedar Creek Lake. Enjoy a peaceful setting with mature trees, spacious yard, and close proximity to schools, shopping, and recreation. Perfect opportunity for a weekend getaway or full-time residence. WE MAKE IT EASY TO OWN. This is a great opportunity! Don't wait, call us today to get more information on the owner's easy terms and smooth process that may be able to put the deed in your name and make this your dream home.
Key facts
- Cedar creek lake
- Spacious yard
- Mature trees
Tags
Neighborhood map
What this means for you Summary
Snapshot
- This is a 4-bed/2.0-bath single-family listed at $180k.
Deal economics
- At list price, monthly cash flow is $247 ($3k/yr) — positive.
- The deal already cash-flows at list — no discount required.
- Meets the 1% rule at list price ($2k rent vs $180k).
- Recommended offer: $158k (12.0% below list) — sets the bar for market timing.
- Cap rate 7.9% vs local median 2.2% in Enchanted Oaks — top-decile yield for the area; either an underpriced asset or a hidden risk that comps aren't pricing in. Stress-test before assuming the spread holds.
Location & tenants
- Location reads 60/100 on livability (#1,103 in TX) — a middle-class / working-renter tenant base. Strengths: cost of living A+, crime A, housing A; Watch: schools F, amenities F, commute F.
- Eustace ISD (rural): math 32% / reading 45% proficiency, ranked #455 of 826 in TX (top 55%) — families likely to look elsewhere, expect single-tenant / working-renter base with shorter leases; 62% free/reduced lunch — lower-income household profile, screen leases tightly.
- Market conditions: Rents falling (-5.8%/yr); 694 active listings in the ZIP; 1 comparable units currently listed for rent nearby; 263 units permitted in Henderson County in 2024 (0 in 5+ unit buildings).
- This rent runs 36% of the median local income ($61k/yr) — at the standard rent-burdened threshold; future hikes will face affordability resistance.
Forward outlook
- Local home prices are declining (-3.0%/yr); year-one equity from $1k of loan paydown is wiped out by about $5k of value loss. Plan a longer hold.
Negotiation context
- It's been on market 385 days — a 12% lower offer ($158k) is reasonable based on typical stale-listing flexibility.
- 8 sale attempts since 13y ago with the ask held roughly flat each time — persistent listings suggest the price (not the market) is what's stuck; bring a comps-based counter.
Risks & watch-outs
- Climate carrying-cost: major wind risk, 65% chance of damaging wind over 30y; extreme-heat days projected 7→26/yr by 2055 (HVAC capex compounding) — expect insurance premiums to compound above CPI over the hold.
Questions for the listing agent
- It's been on market 385 days. Have you received any prior offers? Is the seller open to a 12% concession, seller financing, or rate buy-down credit?
- Why hasn't it sold? Are there any deal-killer items the seller is aware of (foundation, flood, title, zoning, code violations)?
- Is there a deadline driving the sale (1031 exchange, divorce, estate, relocation)? That informs how much negotiation room exists.
- Schools are F-rated, which usually means shorter tenancies and higher turnover. Who's the typical renter profile here, and what's been the actual vacancy rate?
- What's the average days-on-market for RENTAL listings here right now (not sales)? A rising rental-DOM trend means longer vacancies and softer asking-rent achievability than the comps imply.
- What's the recent tenant-quality profile in this submarket — average credit score on applications, eviction rate, late-payment / NSF rate, and stable-employment percentage? A property-management company in the area should have these aggregated.
- How much new for-sale + rental construction is in the pipeline within 1–3 miles? Heavy new supply typically softens prices + rents 12–24 months out; constrained supply supports both.
Investment metrics
- 1% rule
- 1.01% ✓
- Cap rate
- 7.94%
- Cash-on-cash
- 5.88%
- DSCR
- 1.26
- GRM
- 8.3
CMA / ARV
- ARV (median comp)
- $211,037
- List price
- $179,999
- Delta
- -14.71%
- Verdict
- UNDERPRICED
- Comps
- 20 within 1.0 mi
Show comp detail 12 sales within ~0.75 mi
| Address | Dist | Beds/Ba | Sqft | Sold | Price | $/sf | Match |
|---|---|---|---|---|---|---|---|
| 6104 Chickasaw Dr | 0.22mi | 3/2.0 (-1) | 1,410 (+0%) | 0mo | $220,000 | $156 | 84 |
| 6112 Ottawa Trl | 0.20mi | 3/2.0 (-1) | 1,450 (+3%) | 1mo | $249,999 | $172 | 79 |
| 6105 Chickasaw Dr | 0.20mi | 3/2.0 (-1) | 1,350 (-4%) | 2mo | $196,500 | $146 | 77 |
| 6147 Inca Dr | 0.08mi | 4/2.0 | 1,554 (+11%) | 4mo | $325,000 | $209 | 75 |
| 6114 Inca Dr | 0.16mi | 3/2.0 (-1) | 1,364 (-3%) | 11mo | $215,000 | $158 | 74 |
| 162 Aztec Dr | 0.35mi | 3/2.0 (-1) | 1,377 (-2%) | 4mo | $539,000 | $391 | 73 |
| 6142 Inca Dr | 0.04mi | 3/2.0 (-1) | 1,248 (-11%) | 7mo | $213,000 | $171 | 69 |
| 6130 Inca Dr | 0.09mi | 3/2.0 (-1) | 1,250 (-11%) | 10mo | $202,000 | $162 | 64 |
| 112 Pierce Dr | 0.32mi | 3/2.0 (-1) | 1,296 (-8%) | 7mo | $149,000 | $115 | 61 |
| 6130 Aztec Dr | 0.26mi | 3/2.0 (-1) | 1,614 (+15%) | 2mo | $220,000 | $136 | 56 |
| 106 Comanche Dr | 0.40mi | 3/2.0 (-1) | 1,200 (-14%) | 7mo | $190,000 | $158 | 46 |
| 140 Mohican Trl | 0.65mi | 3/2.0 (-1) | 1,200 (-14%) | 11mo | $180,000 | $150 | 32 |
Match score weights: distance 35% · size 25% · config 20% · recency 20%. Top-matched comps best support the ARV.
Projected returns pro-forma
-3.0% appreciation · 0.0% rent growth · sell at horizon
- IRR
- -10.5%
- Equity multiple
- 0.63×
- Total profit
- $-18,775
- Equity at exit
- $26,838
- IRR
- -5.9%
- Equity multiple
- 0.67×
- Total profit
- $-16,712
- Equity at exit
- $15,563
Cash invested: $50,400 (down + closing). Projections, not guarantees.
Landlord ↔ Tenant lean methodology
- Overall (STATE)
- 87 Strongly Landlord-Friendly
- State Texas
- 87 Strongly Landlord-Friendly · R+5
- County
- — inherits STATE
- City
- — inherits STATE
ZIP-level market 75156
- Rents YoY
- -5.8%
- Active inventory
- 694
- Price-to-rent
- 8.3×
Monthly cashflow live
- Estimated rent
- $1,818 medium interval (Pro) →
- Mortgage (P&I)
- −$944
- Tax from tax record
- −$170 /mo · $2,042/yr
- Insurance
- −$75
- HOA
- −$0
- Vacancy / Maint / Mgmt
- −$382
- Net cashflow
- $247
Break-even live
UW: 25.0% down · 7.5% · 30yr · 1.5% tax · 5.0% vac · 8.0% maint · 8.0% mgmt
Financing live
Cash to close
- Down payment
- $45,000
- Closing costs
- $5,400
- Reserves months
- —
- Total cash needed
- —
Loan-product check · same deal, 3 products live
Conventional
25% down · 7.5% · 30yr
- Down + closing
- —
- Monthly P&I
- —
- Monthly cashflow
- —
- DSCR
- —
- Eligible?
- —
Personal DTI + credit; lowest rate.
DSCR
20% down · 8.5% · 30yr
- Down + closing
- —
- Monthly P&I
- —
- Monthly cashflow
- —
- DSCR
- —
- Eligible?
- —
No personal income docs; deal must DSCR.
Hard money
10% down · 12.0% · 12mo
- Down + closing
- —
- Monthly P&I
- —
- Monthly cashflow
- —
- DSCR
- —
- Eligible?
- —
Short-term bridge; refi at stabilization.
Rent comps 1 comps
| Address | Beds | Baths | Sqft | Rent | $/sqft | DOM | Units | Dist |
|---|---|---|---|---|---|---|---|---|
| 114 Sierra Madre St Mabank, TX | 3.0 | 2.0 | 1268 | $1,800 | $1.42 | 43d | 1 | 1.40mi |
Listing history 40 events
-
2026-06-19days on market $179,999 Active 385 DOM
-
2026-06-18days on market $179,999 Active 384 DOM
-
2026-06-17days on market $179,999 Active 383 DOM
-
2026-06-16days on market $179,999 Active 382 DOM
-
2026-06-15days on market $179,999 Active 381 DOM
-
2026-06-14days on market $179,999 Active 379 DOM
-
2026-06-12days on market $179,999 Active 378 DOM
-
2026-06-09days on market $179,999 Active 375 DOM
-
2026-06-08days on market $179,999 Active 374 DOM
-
2026-06-07days on market $179,999 Active 373 DOM
-
2026-06-05days on market $179,999 Active 370 DOM
-
2026-06-02days on market $179,999 Active 368 DOM
-
2026-06-01days on market $179,999 Active 367 DOM
-
2026-05-31days on market $179,999 Active 366 DOM
-
2026-05-30remarks 516-char remark
-
2026-05-30$179,999 Active 365 DOM
-
2025-05-30$179,999 Active 516-char remark
Show marketing remark (516 chars)
NEAR CEDAR CREEK LAKE! Charming property located in the heart of Mabank, just minutes from Cedar Creek Lake. Enjoy a peaceful setting with mature trees, spacious yard, and close proximity to schools, shopping, and recreation. Perfect opportunity for a weekend getaway or full-time residence. WE MAKE IT EASY TO OWN. This is a great opportunity! Don't wait, call us today to get more information on the owner's easy terms and smooth process that may be able to put the deed in your name and make this your dream home.
-
2025-05-30historical
Show marketing remark (516 chars)
NEAR CEDAR CREEK LAKE! Charming property located in the heart of Mabank, just minutes from Cedar Creek Lake. Enjoy a peaceful setting with mature trees, spacious yard, and close proximity to schools, shopping, and recreation. Perfect opportunity for a weekend getaway or full-time residence. WE MAKE IT EASY TO OWN. This is a great opportunity! Don't wait, call us today to get more information on the owner's easy terms and smooth process that may be able to put the deed in your name and make this your dream home.
-
2025-05-30$179,999 Active
Show marketing remark (516 chars)
NEAR CEDAR CREEK LAKE! Charming property located in the heart of Mabank, just minutes from Cedar Creek Lake. Enjoy a peaceful setting with mature trees, spacious yard, and close proximity to schools, shopping, and recreation. Perfect opportunity for a weekend getaway or full-time residence. WE MAKE IT EASY TO OWN. This is a great opportunity! Don't wait, call us today to get more information on the owner's easy terms and smooth process that may be able to put the deed in your name and make this your dream home.
-
2025-05-29$179,999 Active
-
2023-07-24price $135,000
-
2023-04-05$155,000 Active
-
2022-08-30soldstatus Closed
-
2022-08-26status Pending
-
2022-06-24$19,000 Active
-
2014-07-29soldstatus
-
2014-05-23soldstatus Closed
-
2014-05-23soldstatus
-
2014-05-23soldstatus
-
2014-05-13historical Active Contingent
-
2014-04-14price $69,495
-
2014-03-13price $69,500
-
2014-02-28price $69,995
-
2014-02-10price $74,900
-
2014-01-04price $79,500
-
2014-01-04$69,495
-
2013-12-24$79,995 Active
-
2013-07-02soldstatus
-
2013-04-22$29,900
-
2010-01-25soldstatus
ⓘ Source: listings_history table (triggers on properties + properties_extension) + one-shot
backfill from property_details.listing_events for pre-trigger history.
Tax reassessment forecast TX · Resets to sale price
- Current annual tax
- $2,042 · $170/mo
- Projected year-2 tax
- $3,294 · $274/mo
- Expected delta
- +$1,252/yr (+$104/mo · 61.3%)
ⓘ Screening estimate from a state-policy table — verify with the county assessor before closing.
Climate risk First Street
- Flood 1/10 Low FEMA zone X (unshaded) · 0% chance over 30 yrs
- Wildfire 3/10 Moderate
- Heat 7/10 Severe 7 d/yr ≥109°F today · 26 d/yr by 30 yrs out
- Wind 6/10 Major 65% chance of damaging wind over 30 yrs
- Air quality 2/10 Low 0 unhealthy d/yr today · 1 by 30 yrs out
Nearby sold comps map
Loading sold comps map…
Walkable amenities ~0.75 mi
Loading nearby amenities…
Taxation est. · year 1
- Rental income
- $21,812
- − Mortgage interest
- −$10,083
- − Property taxes
- −$2,042
- − Insurance
- −$900
- − Repairs & maintenance
- −$1,745
- − Management
- −$1,745
- − Depreciation
- −$5,236
- Taxable income
- $62
- Est. tax owed @ 24.0%
- −$15
- After-tax cash flow
- $2,948/yr
For passive investors: Depreciation is non-cash, so a rental often shows a tax loss while cash-flowing — sheltering income. Rental losses are passive: they offset passive income freely, and up to $25,000/yr can offset ordinary (W-2) income if you actively participate and your MAGI is under $100k (phasing out to $0 by $150k); unused losses carry forward. On sale, claimed depreciation is recaptured at up to 25%, and gains may owe capital-gains tax (a 1031 exchange can defer both). Figures are a year-1 estimate at your 24.0% rate — not tax advice; consult a CPA.
Schools (NCES district)
- District
- Eustace ISD
- NCES district ID
- 4818720
- Math proficiency
- 32% ▼ -18.00%
- Reading proficiency
- 45% ▼ -7.00%
- Median HH income
- $42,425
- Composite
- 32.48/100
- National rank
- #5711
- State rank
- #455 of 826 in TX
Livability — Enchanted Oaks
- Score
- 60/100
- State rank
- #1103
- US rank
- #19536
Category grades
Schools grade is shown separately in the Schools card above.
Census & demographics
- County
- Henderson County · 34,977 people
- Metro
- Athens, TX
- Population (ZIP)
- 16,333
- Household income
- $60,867
- Rent vs Own
- Severe rent burden
- 400.0
Population outlook (Henderson County) Hauer SSP2
- Today (2025)
- 80,471 people
- By 2030
- 80,608 · +0.2%
- By 2040
- 80,087 · -0.5%
- By 2050
- 78,208 · -2.8%
- By 2075
- 72,423 · -10.0%
- By 2100
- 61,012 · -24.2%
Race, ethnicity, and origin ACS 2023
- Neighborhood character
- Predominantly White (85%)
- Race & ethnicity
- White 85% Hispanic / Latino 7% Two or more races 7% Black 1%
- Hispanic origin (detail)
- Mexican 5%
- Common ancestry
- Slovak 3% Serbian 2% European 2%
- Foreign-born
- 4% · Canada, Jamaica
- Languages at home
- 94% English-only · Spanish 4% Other Indo-European 1%
Political lean MEDSL · Henderson
- 2024 margin
- Solid R (+63.5) · D 18.0% · R 81.4%
- 2008→2024 swing
- -18.8pp toward R · 2008: -44.6pp · 2024: -63.5pp
- All cycles
- 2024: R+63.5 2020: R+60.2 2016: R+60.0 2012: R+54.8 2008: R+44.6
Not yet ingested
- Civics
- —
Market trends
- HPI YoY
- ▼ -216.77%
- Current HPI
- 199.8108
- Rent YoY
- ▼ -5.76%
- Metro
- Athens, TX
- State GDP YoY
- ▲ 3.95%
- F500 in state
- 110
Industry mix (Fortune 500 HQ in TX)
| Industry | F500 HQs | Revenue |
|---|---|---|
| Energy | 16 | $1,198B |
|
||
| Technology | 5 | $198B |
|
||
| Engineering / Construction | 4 | $72B |
|
||
| Energy Services | 3 | $60B |
|
||
| Utilities | 3 | $41B |
|
||
| Healthcare | 2 | $330B |
|
||
Price history
+502.0% since first listed24 events — show timeline
- 2025-05-30 Listed $179,999 HARMLS
- 2025-05-30 Listing Removed — HARMLS
- 2025-05-30 Listed $179,999 HARMLS
- 2025-05-29 Listed $179,999 NTREIS
- 2023-07-24 Price Changed $135,000 NTREIS
- 2023-04-05 Listed $155,000 NTREIS
- 2022-08-30 Sold (MLS) — NTREIS
- 2022-08-26 Pending — NTREIS
- 2022-06-24 Listed $19,000 NTREIS
- 2014-07-29 Sold (Public Records) — Public Records
- 2014-05-23 Sold (Public Records) — Public Records
- 2014-05-23 Sold (MLS) — HCBOR
- 2014-05-23 Sold (MLS) — NTREIS
- 2014-05-13 Contingent — NTREIS
- 2014-04-14 Price Changed $69,495 NTREIS
- 2014-03-13 Price Changed $69,500 NTREIS
- 2014-02-28 Price Changed $69,995 NTREIS
- 2014-02-10 Price Changed $74,900 NTREIS
- 2014-01-04 Price Changed $79,500 NTREIS
- 2014-01-04 Listed $69,495 HCBOR
- 2013-12-24 Listed $79,995 NTREIS
- 2013-07-02 Sold (MLS) — HCBOR
- 2013-04-22 Listed $29,900 HCBOR
- 2010-01-25 Sold (Public Records) — Public Records
Property tax history
+4.3%/yrLatest (2025): $2,042 · +8.8% YoY. Source: county tax records.
Cash-flow waterfall
monthlySold comps — $/sqft
last 12 mo · ≤1 miLoading sold comps…