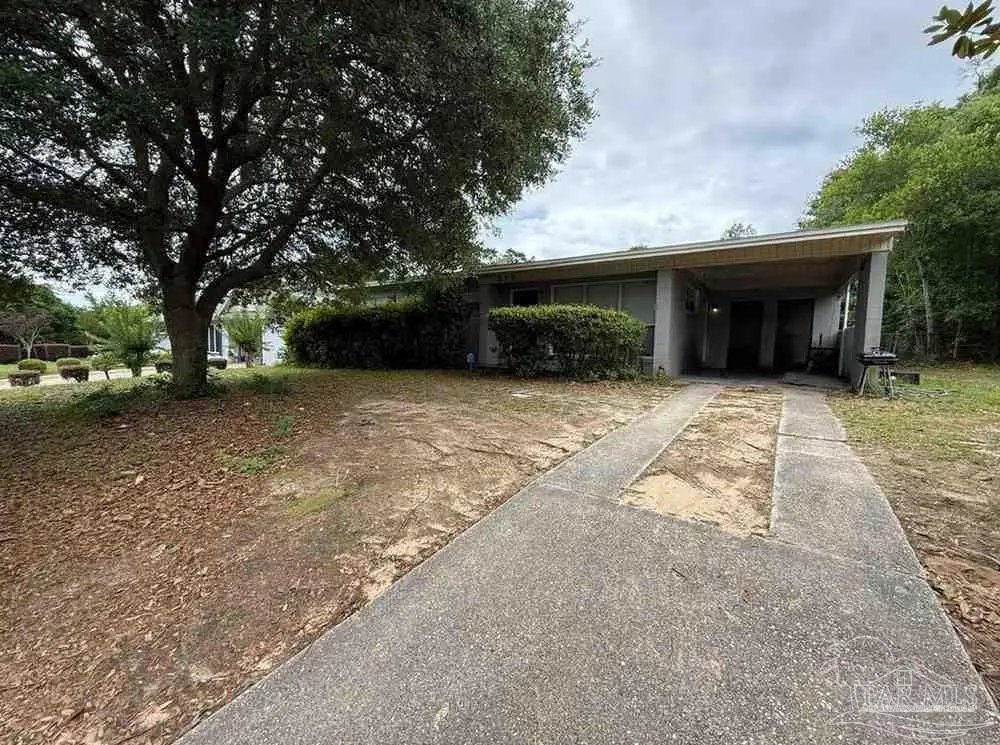
815 Woodland Dr · Pensacola, FL
Flood risk 1/10 · Minimal
- FEMA flood zone
- X (unshaded)
- Chance of flooding over 30 yrs
- 0.0%
- Est. flood insurance / yr
- $507 – $1,088
Fire risk 1/10 · Minimal
- Est. fire insurance / yr
- $947 – $1,759
Heat risk 10/10 · Severe
- Hot days now (above 105°F)
- 7 days/yr
- Hot days in 30 yrs
- 22 days/yr
Wind risk 9/10 · Severe
- Chance of severe wind over 30 yrs
- 99.0%
Air-quality risk 1/10 · Minimal
- Unhealthy air days now
- 0 days/yr
- Unhealthy air days in 30 yrs
- 0 days/yr
Risk factors via First Street. Map © Google.
Why this score? — see what drove the C+ grade
The composite is a weighted blend of 9 inputs, each scored 0–100. Each bar is that input's sub-score; the figure is the points it added to the 100-point composite (weight × sub-score).
- Cash flow +23.9/30.0
- ARV discount +12.8/15.0
- DSCR +7.7/10.0
- 1% rule +5.8/10.0
- Livability +4.2/5.0
- Schools +3.6/10.0
- Rent growth +3.3/5.0
- Condition / age +2.5/5.0
- Appreciation +0.0/10.0
$174,900
🖨 Deal sheet (PDF) 📄 Offer letter ✓ Due diligence
Listing remarks MLS
Spacious 3/2, 1320 SF home w/Formal Living AND a Family Room w/Fireplace that sits in a wonderfully established in-town neighborhood. The Kitchen/Dining area flows beautifully into both living areas, creating an entertainment lover's dream. This home has great bones but does need some TLC, but with a little effort, you'll have a wonderful place to call home! Extras include a covered front porch, inside laundry; and a single car carport and a small storage building. Come tour this wonderful family home today, but be forewarned, you will fall in love. The fireplace has a gas heater insert. Property to be sold "AS-IS, WHERE-IS," with right to inspect.
Key facts
- Slab foundation
- Additional room
- Pensacola location
Tags
Property features AI
Finance
- Other: Lot size approx. 0.23 acres; Building area reported as 1,320 square feet; No new construction
- HOA & community: No association noted
Exterior
- Parking: Carport (covered) providing one parking space
- Utilities: Public water; Public sewer; Electric with circuit breakers
- Home design: Single-story concrete construction; Resale property; Not attached to another property
- Construction: Concrete construction; Built on slab foundation; One level
- Exterior features: Gable roof; Paved road access; No horse privileges
Interior
- Kitchen: Gas water heater noted among appliances
- Bedrooms: Master bedroom on the first floor (approx. 12' x 12'); Two additional first-floor bedrooms (each approx. 10' x 10')
- Flooring: Tile
- Bathrooms: Two full bathrooms
- Heating & cooling: Central heating; Central air; Ceiling fan(s)
- Interior features: Tile flooring; Kitchen/dining combo
Neighborhood map
What this means for you Summary
Snapshot
- This is a 3-bed/2.0-bath single-family listed at $175k.
Deal economics
- At list price, monthly cash flow is $338 ($4k/yr) — positive.
- The deal already cash-flows at list — no discount required.
- Meets the 1% rule at list price ($2k rent vs $175k).
- Cap rate 8.6% vs local median 3.6% in Pensacola — top-decile yield for the area; either an underpriced asset or a hidden risk that comps aren't pricing in. Stress-test before assuming the spread holds.
Location & tenants
- Location reads 83/100 on livability (#53 in FL, #924 nationally) — a professional / high-income tenant draw. Strengths: commute A+, cost of living A+, housing A+.
- Escambia (suburban): math 40% / reading 45% proficiency, ranked #56 of 73 in FL (top 77%) — families likely to look elsewhere, expect single-tenant / working-renter base with shorter leases.
- Zoned schools: O. J. Semmes Elementary School (math 22% / reading 17%, grade F, #2,105 of 2,144 statewide, top 98%, 302 students, 91% FRL); Ferry Pass Middle School (math 34% / reading 33%, grade F, #428 of 571 statewide, top 76%, 1,014 students, 64% FRL); Washington Senior High School (math 25% / reading 40%, grade F, #411 of 667 statewide, top 62%, 1,733 students, 51% FRL).
- Zoned-school proficiency averages 28% at this address vs 42% district-wide (-14 pts) — the specific schools serving this property underperform the Escambia average; the district grade overstates school quality for this exact location.
- Market conditions: Rents rising (+3.4%/yr); 243 active listings in the ZIP; 5 comparable units currently listed for rent nearby; rentals at typical pace (median 26d on market — plan ~3-4 weeks tenant-placement turnaround); 1,479 units permitted in Escambia County in 2024 (0 in 5+ unit buildings).
- This rent runs 32% of the median local income ($71k/yr) — at the standard rent-burdened threshold; future hikes will face affordability resistance.
Forward outlook
- Local home prices are declining (-3.0%/yr); year-one equity from $1k of loan paydown is wiped out by about $5k of value loss. Plan a longer hold.
- Escambia County population projected at +13% by 2050 — modest demand growth; plan on rents tracking national, not racing it.
Negotiation context
- Only 14 days on market — expect competitive offers; lowballing is unlikely to land.
- 3 sale attempts since 14y ago with the ask held roughly flat each time — persistent listings suggest the price (not the market) is what's stuck; bring a comps-based counter.
- Current owner paid $36k; list at $175k implies a 386% gain — meaningful room to come down on a strong offer.
Risks & watch-outs
- Climate carrying-cost: severe wind risk, 99% chance of damaging wind over 30y; extreme-heat days projected 7→22/yr by 2055 (HVAC capex compounding) — expect insurance premiums to compound above CPI over the hold.
Questions for the listing agent
- Built in 1965 — when were the roof, HVAC, electrical panel, plumbing, and water heater last replaced?
- Is there a deadline driving the sale (1031 exchange, divorce, estate, relocation)? That informs how much negotiation room exists.
- What's the average days-on-market for RENTAL listings here right now (not sales)? A rising rental-DOM trend means longer vacancies and softer asking-rent achievability than the comps imply.
- What's the recent tenant-quality profile in this submarket — average credit score on applications, eviction rate, late-payment / NSF rate, and stable-employment percentage? A property-management company in the area should have these aggregated.
- How much new for-sale + rental construction is in the pipeline within 1–3 miles? Heavy new supply typically softens prices + rents 12–24 months out; constrained supply supports both.
Investment metrics
- 1% rule
- 1.08% ✓
- Cap rate
- 8.61%
- Cash-on-cash
- 8.29%
- DSCR
- 1.37
- GRM
- 7.7
CMA / ARV
- ARV (on-the-fly)
- $198,000
- Comps found
- 12
Show comp detail 12 sales within ~0.75 mi
| Address | Dist | Beds/Ba | Sqft | Sold | Price | $/sf | Match |
|---|---|---|---|---|---|---|---|
| 175 Mango St | 0.16mi | 3/1.0 | 1,300 (-2%) | 6mo | $224,500 | $173 | 81 |
| 704 Woodland Dr | 0.28mi | 3/2.0 | 1,357 (+3%) | 5mo | $160,000 | $118 | 78 |
| 181 Mango St | 0.17mi | 3/2.0 | 1,404 (+6%) | 10mo | $210,000 | $150 | 73 |
| 115 Warwick Ave | 0.27mi | 3/2.0 | 1,362 (+3%) | 13mo | $104,000 | $76 | 71 |
| 607 Chadwick St | 0.42mi | 4/2.0 (+1) | 1,336 (+1%) | 8mo | $215,000 | $161 | 67 |
| 778 Ash Dr | 0.30mi | 3/2.0 | 1,450 (+10%) | 5mo | $208,000 | $143 | 65 |
| 812 Ash Dr | 0.27mi | 3/2.0 | 1,480 (+12%) | 8mo | $167,000 | $113 | 61 |
| 207 Hart Dr | 0.27mi | 3/1.0 | 1,213 (-8%) | 12mo | $89,500 | $74 | 60 |
| 702 Boxwood Dr | 0.31mi | 3/2.0 | 1,451 (+10%) | 12mo | $250,000 | $172 | 59 |
| 815 Chadwick St | 0.51mi | 4/2.0 (+1) | 1,376 (+4%) | 13mo | $229,000 | $166 | 54 |
| 196 Highland Dr | 0.38mi | 4/2.0 (+1) | 1,482 (+12%) | 8mo | $200,000 | $135 | 50 |
| 611 Royce St | 0.70mi | 4/3.0 (+1) | 1,400 (+6%) | 16mo | $237,000 | $169 | 36 |
Match score weights: distance 35% · size 25% · config 20% · recency 20%. Top-matched comps best support the ARV.
Projected returns pro-forma
-3.0% appreciation · 3.39% rent growth · sell at horizon
- IRR
- -3.3%
- Equity multiple
- 0.88×
- Total profit
- $-6,062
- Equity at exit
- $26,078
- IRR
- 6.8%
- Equity multiple
- 1.52×
- Total profit
- $25,512
- Equity at exit
- $15,122
Cash invested: $48,972 (down + closing). Projections, not guarantees.
Landlord ↔ Tenant lean methodology
- Overall (STATE)
- 87 Strongly Landlord-Friendly
- State Florida
- 87 Strongly Landlord-Friendly · R+3
- County
- — inherits STATE
- City
- — inherits STATE
ZIP-level market 32503
- Rents YoY
- 3.4%
- Active inventory
- 243
- Price-to-rent
- 7.7×
Monthly cashflow live
- Estimated rent
- $1,888 high interval (Pro) →
- Mortgage (P&I)
- −$917
- Tax from tax record
- −$163 /mo · $1,955/yr
- Insurance
- −$73
- HOA
- −$0
- Lot rent
- −$0
- Vacancy / Maint / Mgmt
- −$396
- Net cashflow
- $338
Break-even live
Sensitivity live
| Price | -10% $437 | -5% $388 | +0% $338 | +5% $289 | +10% $239 |
|---|---|---|---|---|---|
| Rent | -10% $189 | -5% $264 | +0% $338 | +5% $413 | +10% $487 |
| Rate | -1.0pp $426 | -0.5pp $383 | base $338 | +0.5pp $293 | +1.0pp $247 |
UW: 25.0% down · 7.5% · 30yr · 1.5% tax · 5.0% vac · 8.0% maint · 8.0% mgmt
Financing live
Cash to close
- Down payment
- $43,725
- Closing costs
- $5,247
- Reserves months
- —
- Total cash needed
- —
Loan-product check · same deal, 3 products live
Conventional
25% down · 7.5% · 30yr
- Down + closing
- —
- Monthly P&I
- —
- Monthly cashflow
- —
- DSCR
- —
- Eligible?
- —
Personal DTI + credit; lowest rate.
DSCR
20% down · 8.5% · 30yr
- Down + closing
- —
- Monthly P&I
- —
- Monthly cashflow
- —
- DSCR
- —
- Eligible?
- —
No personal income docs; deal must DSCR.
Hard money
10% down · 12.0% · 12mo
- Down + closing
- —
- Monthly P&I
- —
- Monthly cashflow
- —
- DSCR
- —
- Eligible?
- —
Short-term bridge; refi at stabilization.
Rent comps 5 comps
| Address | Beds | Baths | Sqft | Rent | $/sqft | DOM | Units | Dist |
|---|---|---|---|---|---|---|---|---|
| 4400 N 9th Ave Pensacola, FL | 3.0 | 1.5 | 1713 | $2,000 | $1.17 | 26d | 1 | 0.25mi |
| 531 Ditmar St Unit B Pensacola, FL | 2.0 | 1.0 | 1094 | $1,450 | $1.33 | 26d | 1 | 0.54mi |
| 538 Royce St Unit 1A Pensacola, FL | 2.0 | 1.0 | 1000 | $1,425 | $1.43 | 26d | 1 | 0.75mi |
| 3131 N 10th Ave Pensacola, FL | 3.0 | 1.5 | 1085 | $1,700 | $1.57 | 26d | 1 | 0.98mi |
| 3014 Magnolia Ave Pensacola, FL | 3.0 | 2.0 | 1650 | $2,750 | $1.67 | 26d | 1 | 1.32mi |
Listing history 10 events
-
2026-06-23days on market $174,900 Active 14 DOM
-
2026-06-21days on market $174,900 Active 13 DOM
-
2026-06-18days on market $174,900 Active 10 DOM
-
2026-06-17days on market $174,900 Active 9 DOM
-
2026-06-16pricedays on market $174,900 Active 8 DOM
-
2026-06-15days on market $179,900 Active 7 DOM
-
2026-06-14days on market $179,900 Active 5 DOM
-
2026-06-10days on market $179,900 Active 2 DOM
-
2026-06-09remarks 699-char remark
-
2026-06-09$179,900 Active 1 DOM
ⓘ Source: listings_history table (triggers on properties + properties_extension) + one-shot
backfill from property_details.listing_events for pre-trigger history.
Tax reassessment forecast FL · Resets to sale price
- Current annual tax
- $1,955 · $163/mo
- Projected year-2 tax
- $1,955 · $163/mo
- Expected delta
- $0/yr ($0/mo · 0.0%)
ⓘ Screening estimate from a state-policy table — verify with the county assessor before closing.
Climate risk First Street
- Flood 1/10 Low FEMA zone X (unshaded) · 0% chance over 30 yrs
- Wildfire 1/10 Low
- Heat 10/10 Extreme 7 d/yr ≥105°F today · 22 d/yr by 30 yrs out
- Wind 9/10 Extreme 99% chance of damaging wind over 30 yrs
- Air quality 1/10 Low 0 unhealthy d/yr today · 0 by 30 yrs out
Nearby sold comps map
Loading sold comps map…
Walkable amenities ~0.75 mi
Loading nearby amenities…
Taxation est. · year 1
- Rental income
- $22,652
- − Mortgage interest
- −$9,797
- − Property taxes
- −$1,955
- − Insurance
- −$874
- − Repairs & maintenance
- −$1,812
- − Management
- −$1,812
- − Depreciation
- −$5,088
- Taxable income
- $1,313
- Est. tax owed @ 24.0%
- −$315
- After-tax cash flow
- $3,744/yr
For passive investors: Depreciation is non-cash, so a rental often shows a tax loss while cash-flowing — sheltering income. Rental losses are passive: they offset passive income freely, and up to $25,000/yr can offset ordinary (W-2) income if you actively participate and your MAGI is under $100k (phasing out to $0 by $150k); unused losses carry forward. On sale, claimed depreciation is recaptured at up to 25%, and gains may owe capital-gains tax (a 1031 exchange can defer both). Figures are a year-1 estimate at your 24.0% rate — not tax advice; consult a CPA.
Schools (NCES district)
- District
- Escambia
- NCES district ID
- 1200510
- Math proficiency
- 40% ▼ -9.00%
- Reading proficiency
- 45% ▼ -4.00%
- Median HH income
- $44,649
- Composite
- 36.04/100
- National rank
- #4773
- State rank
- #56 of 73 in FL
Livability — Pensacola
- Score
- 83/100
- State rank
- #53
- US rank
- #924
Category grades
Schools grade is shown separately in the Schools card above.
Census & demographics
- Census place
- Pensacola, FL
- County
- Escambia County · 301,722 people
- City population
- 237,636
- Metro
- Pensacola-Ferry Pass-Brent, FL
- Population (ZIP)
- 33,559
- Household income
- $71,411
- Rent vs Own
- Severe rent burden
- 948.0
Population outlook (Escambia County) Hauer SSP2
- Today (2025)
- 334,637 people
- By 2030
- 345,779 · +3.3%
- By 2040
- 364,828 · +9.0%
- By 2050
- 378,514 · +13.1%
- By 2075
- 403,220 · +20.5%
- By 2100
- 386,125 · +15.4%
Race, ethnicity, and origin ACS 2023
- Neighborhood character
- Predominantly White (68%)
- Race & ethnicity
- White 68% Black 20% Two or more races 6% Hispanic / Latino 5% Asian 2%
- Common ancestry
- Lithuanian 3% Italian 2% Romanian 2%
- Foreign-born
- 5% · Canada, China
- Languages at home
- 93% English-only · Spanish 3% Arabic 1% Tagalog/Filipino 1%
Political lean MEDSL · Escambia
- 2024 margin
- R (+19.5) · D 39.7% · R 59.2% · Other 1.1%
- 2008→2024 swing
- -0.2pp no change · 2008: -19.3pp · 2024: -19.5pp
- All cycles
- 2024: R+19.5 2020: R+15.1 2016: R+20.6 2012: R+20.6 2008: R+19.3
Not yet ingested
- Civics
- —
Market trends
- HPI YoY
- ▼ -300.02%
- Current HPI
- 294.4873
- Rent YoY
- ▲ 3.39%
- Metro
- Pensacola-Ferry Pass-Brent, FL
- State GDP YoY
- ▲ 3.28%
- F500 in state
- 36
Industry mix (Fortune 500 HQ in FL)
| Industry | F500 HQs | Revenue |
|---|---|---|
| Industrial Technology | 2 | $29B |
|
||
| Insurance | 2 | $17B |
|
||
| Retail | 1 | $60B |
|
||
| Technology Distribution | 1 | $58B |
|
||
| Homebuilding | 1 | $35B |
|
||
| Technology Manufacturing | 1 | $35B |
|
||
Price history
+501.7% since first listed8 events — show timeline
- 2026-06-08 Listed $179,900 PARMLS
- 2024-08-10 Rental Removed $1,395 PARMLS
- 2024-08-01 Listed for Rent $1,395 PARMLS
- 2012-08-24 Sold (MLS) $36,000 PARMLS
- 2012-02-03 Listed $40,000 PARMLS
- 1981-07-01 Sold (Public Records) $38,900 Public Records
- 1979-01-01 Sold (Public Records) $29,900 Public Records
- 1978-01-01 Sold (Public Records) $29,900 Public Records
Property tax history
+18.9%/yrLatest (2025): $1,955 · +9.8% YoY. Source: county tax records.
Cash-flow waterfall
monthlySold comps — $/sqft
last 12 mo · ≤1 miLoading sold comps…