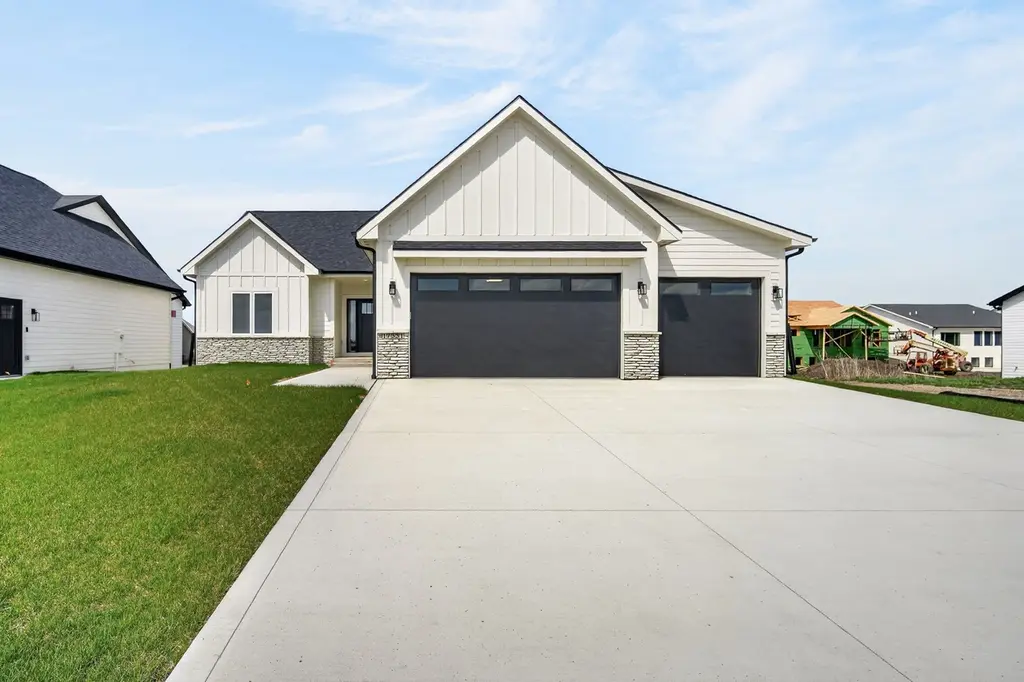
17331 Brookview Dr · Urbandale, IA
Flood risk 1/10 · Minimal
- FEMA flood zone
- X (unshaded)
- Chance of flooding over 30 yrs
- 0.0%
- Est. flood insurance / yr
- $473 – $860
Fire risk 1/10 · Minimal
- Est. fire insurance / yr
- $902 – $1,676
Heat risk 3/10 · Minor
- Hot days now (above 102°F)
- 7 days/yr
- Hot days in 30 yrs
- 15 days/yr
Wind risk 2/10 · Minimal
- Chance of severe wind over 30 yrs
- —
Air-quality risk 1/10 · Minimal
- Unhealthy air days now
- 0 days/yr
- Unhealthy air days in 30 yrs
- 0 days/yr
Risk factors via First Street. Map © Google.
Why this score? — see what drove the D grade
The composite is a weighted blend of 9 inputs, each scored 0–100. Each bar is that input's sub-score; the figure is the points it added to the 100-point composite (weight × sub-score).
- ARV discount +13.7/15.0
- Appreciation +7.4/10.0
- Schools +7.1/10.0
- Livability +4.5/5.0
- Cash flow +2.9/30.0
- Rent growth +2.5/5.0
- Condition / age +2.5/5.0
- 1% rule +0.0/10.0
- DSCR +0.0/10.0
$560,000
🖨 Deal sheet (PDF) 📄 Offer letter ✓ Due diligence
Listing remarks
Welcome to this stunning new construction home in the highly sought-after Bentley Ridge development in Urbandale. Offering over 3,000 square feet of beautifully finished living space, this 5-bedroom, 3-bathroom home blends modern design with exceptional functionality. Step inside to find durable and stylish LVP flooring throughout the main level, creating a seamless, low-maintenance living space. The open-concept layout is perfect for both everyday living and entertaining, featuring spacious living, dining, and kitchen areas filled with natural light from quality casement windows. The finished walkout basement expands your living space with a massive second living area, complete with a larg
Key facts
- 8,640 sq ft lot
- 3 garage spots
- Built 2025
Neighborhood map
What this means for you Summary
Snapshot
- This is a 5-bed/3.0-bath single-family listed at $560k.
Deal economics
- At list price, monthly cash flow is $-2k ($-22k/yr) — negative.
- To cash-flow at today's rent, offer at most $292k (47.9% below list).
- To meet the 1% rule (rent ≥ 1% of price), the offer needs to be $255k (54.4% below list).
- Recommended offer: $255k (54.4% below list) — sets the bar for 1% rule.
Location & tenants
- Location reads 90/100 on livability (#4 in IA, #69 nationally) — a professional / high-income tenant draw. Strengths: crime A+, amenities A+, employment A+; Watch: commute F.
- Waukee Community School District (suburban): math 80% / reading 79% proficiency, ranked #14 of 289 in IA (top 5%) — strong family-tenant draw, lease renewals of 3-5y typical; only 11% free/reduced lunch — higher-income household profile.
- Zoned schools: Walnut Hills Elementary School (math 91% / reading 81%, grade A+, #26 of 616 statewide, top 4%, 625 students, 9% FRL); Waukee Middle School (math 83% / reading 81%, grade A+, #22 of 246 statewide, top 12%, 1,069 students, 12% FRL); Waukee High School (math 74% / reading 82%, grade A-, #53 of 336 statewide, top 16%, 1,268 students, 24% FRL) — zoned schools at 15% FRL track the district average.
- Market conditions: 381 active listings in the ZIP; 2 comparable units currently listed for rent nearby; high-income renter base; 1,503 units permitted in Dallas County in 2024 (630 in 5+ unit buildings).
- This rent is only 17% of the median local income ($176k/yr) — well below the 30% rent-burden line; pricing power to push rent on renewal without tenant pushback.
Forward outlook
- In year one you build about $31k of equity ($4k loan paydown + $27k appreciation (4.8% local appreciation)).
- Dallas County population projected at +74% by 2050 — long-run rental-demand tailwind backs the buy-and-hold thesis.
- By year 2, paydown + projected appreciation supports a ~$49k cash-out refi (75% LTV) — recoverable capital for the next deal without selling this one.
Negotiation context
- Only 0 days on market — expect competitive offers; lowballing is unlikely to land.
- 3 sale attempts with the ask held roughly flat each time — persistent listings suggest the price (not the market) is what's stuck; bring a comps-based counter.
Questions for the listing agent
- What do current leases actually rent for vs. the listed asking? Can we see a recent rent roll and the last 12 months of T-12 income?
- Is there a deadline driving the sale (1031 exchange, divorce, estate, relocation)? That informs how much negotiation room exists.
- Schools are A-rated — typically a magnet for longer-tenancy family renters. What's the average tenant stay here, and is there a school-zone premium baked into asking?
- The area grade is low — what's the realistic commute time and amenity access for the typical tenant pool here? Any planned neighborhood developments (good or bad) we should know about?
- What's the average days-on-market for RENTAL listings here right now (not sales)? A rising rental-DOM trend means longer vacancies and softer asking-rent achievability than the comps imply.
- What's the recent tenant-quality profile in this submarket — average credit score on applications, eviction rate, late-payment / NSF rate, and stable-employment percentage? A property-management company in the area should have these aggregated.
- How much new for-sale + rental construction is in the pipeline within 1–3 miles? Heavy new supply typically softens prices + rents 12–24 months out; constrained supply supports both.
Investment metrics
- 1% rule
- 0.46% ✗
- Cap rate
- 2.32%
- Cash-on-cash
- -14.19%
- DSCR
- 0.37
- GRM
- 18.3
CMA / ARV
- ARV (median comp)
- $649,423
- List price
- $560,000
- Delta
- -11.07%
- Verdict
- UNDERPRICED
- Comps
- 20 within 1.0 mi
Show comp detail 12 sales within ~0.75 mi
| Address | Dist | Beds/Ba | Sqft | Sold | Price | $/sf | Match |
|---|---|---|---|---|---|---|---|
| 16412 N Valley Dr | 0.21mi | 5/3.0 | 1,869 (+7%) | 2mo | $649,900 | $348 | 77 |
| 16333 Springbrook Trl | 0.34mi | 5/3.0 | 1,801 (+3%) | 2mo | $634,500 | $352 | 77 |
| 5348 162nd Ct | 0.43mi | 4/3.0 (-1) | 1,778 (+2%) | 1mo | $488,000 | $274 | 71 |
| 16616 Deerview Dr | 0.42mi | 4/3.0 (-1) | 1,812 (+4%) | 0mo | $639,900 | $353 | 69 |
| 16624 Deerview Dr | 0.40mi | 5/3.0 | 1,895 (+9%) | 0mo | $650,000 | $343 | 67 |
| 4485 NW 167th St | 0.67mi | 4/3.0 (-1) | 1,713 (-2%) | 1mo | $507,500 | $296 | 60 |
| 5103 168th St | 0.37mi | 5/3.0 | 1,498 (-14%) | 2mo | $404,660 | $270 | 58 |
| 17151 Plum Dr | 0.72mi | 4/3.5 (-1) | 1,762 (+1%) | 1mo | $479,500 | $272 | 57 |
| 5124 168th St | 0.44mi | 5/3.0 | 1,498 (-14%) | 1mo | $374,590 | $250 | 55 |
| 5111 168th St | 0.39mi | 4/3.0 (-1) | 1,498 (-14%) | 2mo | $378,790 | $253 | 52 |
| 16223 Tanglewood Dr | 0.72mi | 5/3.0 | 1,904 (+9%) | 2mo | $559,400 | $294 | 49 |
| 16009 Walnut Hills Dr | 0.75mi | 5/3.5 | 1,911 (+10%) | 1mo | $469,500 | $246 | 46 |
Match score weights: distance 35% · size 25% · config 20% · recency 20%. Top-matched comps best support the ARV.
Projected returns pro-forma
4.81% appreciation · 3.0% rent growth · sell at horizon
- IRR
- 0.5%
- Equity multiple
- 1.03×
- Total profit
- $4,911
- Equity at exit
- $310,814
- IRR
- 4.1%
- Equity multiple
- 1.77×
- Total profit
- $120,065
- Equity at exit
- $531,099
Cash invested: $156,800 (down + closing). Projections, not guarantees.
Landlord ↔ Tenant lean methodology
- Overall (STATE)
- 83 Strongly Landlord-Friendly
- State Iowa
- 83 Strongly Landlord-Friendly · R+6
- County
- — inherits STATE
- City
- — inherits STATE
ZIP-level market 50323
- Home prices YoY
- 2.5%
- Active inventory
- 381
- Price-to-rent
- 18.3×
Monthly cashflow live
- Estimated rent
- $2,552 medium interval (Pro) →
- Mortgage (P&I)
- −$2,937
- Tax est. 1.5%
- −$700 /mo · $8,400/yr
- Insurance
- −$233
- HOA
- −$0
- Vacancy / Maint / Mgmt
- −$536
- Net cashflow
- $-1,854
Break-even live
Sensitivity live
| Price | -10% $-1,467 | -5% $-1,660 | +0% $-1,854 | +5% $-2,047 | +10% $-2,241 |
|---|---|---|---|---|---|
| Rent | -10% $-2,055 | -5% $-1,954 | +0% $-1,854 | +5% $-1,753 | +10% $-1,652 |
| Rate | -1.0pp $-1,572 | -0.5pp $-1,711 | base $-1,854 | +0.5pp $-1,999 | +1.0pp $-2,146 |
UW: 25.0% down · 7.5% · 30yr · 1.5% tax · 5.0% vac · 8.0% maint · 8.0% mgmt
Financing live
Cash to close
- Down payment
- $140,000
- Closing costs
- $16,800
- Reserves months
- —
- Total cash needed
- —
Loan-product check · same deal, 3 products live
Conventional
25% down · 7.5% · 30yr
- Down + closing
- —
- Monthly P&I
- —
- Monthly cashflow
- —
- DSCR
- —
- Eligible?
- —
Personal DTI + credit; lowest rate.
DSCR
20% down · 8.5% · 30yr
- Down + closing
- —
- Monthly P&I
- —
- Monthly cashflow
- —
- DSCR
- —
- Eligible?
- —
No personal income docs; deal must DSCR.
Hard money
10% down · 12.0% · 12mo
- Down + closing
- —
- Monthly P&I
- —
- Monthly cashflow
- —
- DSCR
- —
- Eligible?
- —
Short-term bridge; refi at stabilization.
Rent comps 2 comps
| Address | Beds | Baths | Sqft | Rent | $/sqft | DOM | Units | Dist |
|---|---|---|---|---|---|---|---|---|
| 16008 Springbrook Trl Urbandale, IA | 5.0 | 3.0 | 1670 | $2,900 | $1.74 | 45d | 1 | 0.38mi |
| 5437 155th St Urbandale, IA | 3.0–4.0 | 2.5 | 1590 | $2,096 | $1.32 | 16d | 8 | 0.75mi |
Listing history 13 events
-
2026-06-09remarks 699-char remark
-
2026-06-09pricestatusdays on market $560,000 Pending
-
2026-06-03days on market $577,500 Active 49 DOM
-
2026-06-02days on market $577,500 Active 48 DOM
-
2026-06-01days on market $577,500 Active 47 DOM
-
2026-05-31days on market $577,500 Active 46 DOM
-
2026-05-31days on market $577,500 Active 45 DOM
-
2026-04-15$577,500 Active 1319-char remark
-
2026-04-06historical
-
2026-01-29price $589,900
-
2026-01-07price $593,900
-
2025-11-12price $597,900
-
2025-09-09$605,000 Active
ⓘ Source: listings_history table (triggers on properties + properties_extension) + one-shot
backfill from property_details.listing_events for pre-trigger history.
Climate risk First Street
- Flood 1/10 Low FEMA zone X (unshaded) · 0% chance over 30 yrs
- Wildfire 1/10 Low
- Heat 3/10 Moderate 7 d/yr ≥102°F today · 15 d/yr by 30 yrs out
- Wind 2/10 Low
- Air quality 1/10 Low 0 unhealthy d/yr today · 0 by 30 yrs out
Nearby sold comps map
Loading sold comps map…
Walkable amenities ~0.75 mi
Loading nearby amenities…
Taxation est. · year 1
- Rental income
- $30,629
- − Mortgage interest
- −$31,369
- − Property taxes
- −$8,400
- − Insurance
- −$2,800
- − Repairs & maintenance
- −$2,450
- − Management
- −$2,450
- − Depreciation
- −$16,291
- Taxable loss
- −$33,132
- Est. tax savings @ 24.0%
- +$7,952
- After-tax cash flow
- $-14,292/yr
For passive investors: Depreciation is non-cash, so a rental often shows a tax loss while cash-flowing — sheltering income. Rental losses are passive: they offset passive income freely, and up to $25,000/yr can offset ordinary (W-2) income if you actively participate and your MAGI is under $100k (phasing out to $0 by $150k); unused losses carry forward. On sale, claimed depreciation is recaptured at up to 25%, and gains may owe capital-gains tax (a 1031 exchange can defer both). Figures are a year-1 estimate at your 24.0% rate — not tax advice; consult a CPA.
Schools (NCES district)
- District
- Waukee Community School District
- NCES district ID
- 1930510
- Math proficiency
- 80% ▼ -6.00%
- Reading proficiency
- 79% ▼ -5.00%
- Median HH income
- $88,580
- Composite
- 70.94/100
- National rank
- #245
- State rank
- #14 of 289 in IA
Livability — Urbandale
- Score
- 90/100
- State rank
- #4
- US rank
- #69
Category grades
Schools grade is shown separately in the Schools card above.
Census & demographics
- Census place
- Urbandale, IA
- County
- Polk County · 453,298 people
- City population
- 49,196
- Metro
- Des Moines-West Des Moines, IA
- Population (ZIP)
- 17,265
- Household income
- $175,944
- Rent vs Own
- Severe rent burden
- 63.0
Population outlook (Dallas County) Hauer SSP2
- Today (2025)
- 111,904 people
- By 2030
- 127,807 · +14.2%
- By 2040
- 160,576 · +43.5%
- By 2050
- 194,154 · +73.5%
- By 2075
- 271,895 · +143.0%
- By 2100
- 326,525 · +191.8%
Race, ethnicity, and origin ACS 2023
- Neighborhood character
- Predominantly White (86%)
- Race & ethnicity
- White 86% Asian 6% Two or more races 4% Hispanic / Latino 3% Black 2%
- Common ancestry
- Portuguese 6% Iranian 5% Lithuanian 2%
- Foreign-born
- 7% · Canada, China, Philippines
- Languages at home
- 92% English-only · Russian/Polish/Slavic 2% Chinese 1% Spanish 1%
Political lean MEDSL · Dallas
- 2024 margin
- Toss-up / Even · D 46.9% · R 51.7% · Other 1.4%
- 2008→2024 swing
- +0.8pp no change · 2008: -5.5pp · 2024: -4.8pp
- All cycles
- 2024: R+4.8 2020: R+2.0 2016: R+9.6 2012: R+11.8 2008: R+5.5
Not yet ingested
- Civics
- —
Market trends
- HPI YoY
- ▲ 4.81%
- Current HPI
- 199.789
- Rent YoY
- —
- Metro
- Des Moines-West Des Moines, IA
- State GDP YoY
- ▲ 2.48%
- F500 in state
- 4
Industry mix (Fortune 500 HQ in IA)
| Industry | F500 HQs | Revenue |
|---|---|---|
| Financial Services | 1 | $16B |
|
||
| Retail / Convenience | 1 | $15B |
|
||
Price history
-7.4% since first listed9 events — show timeline
- 2026-06-08 Listed $560,000 DMMLS
- 2026-06-08 Listing Removed — DMMLS
- 2026-06-04 Listing Removed — DMMLS
- 2026-04-15 Listed $577,500 DMMLS
- 2026-04-06 Listing Removed — DMMLS
- 2026-01-29 Price Changed $589,900 DMMLS
- 2026-01-07 Price Changed $593,900 DMMLS
- 2025-11-12 Price Changed $597,900 DMMLS
- 2025-09-09 Listed $605,000 DMMLS
Cash-flow waterfall
monthlySold comps — $/sqft
last 12 mo · ≤1 miLoading sold comps…