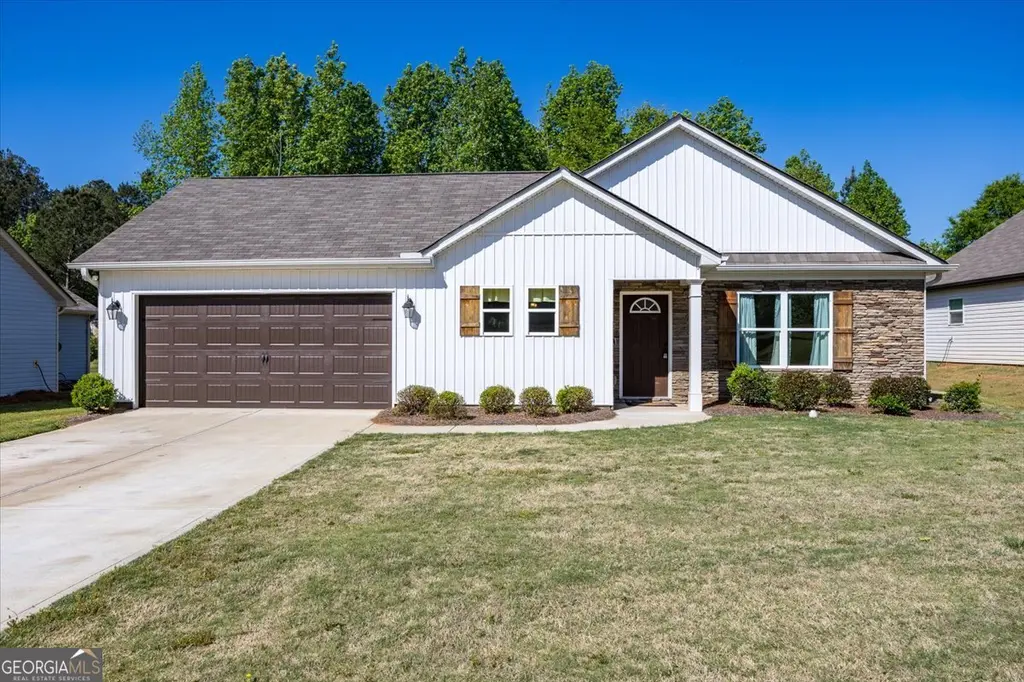
845 Natures Walk · Gray, GA
Flood risk 1/10 · Minimal
- FEMA flood zone
- X (unshaded)
- Chance of flooding over 30 yrs
- 0.0%
- Est. flood insurance / yr
- $507 – $1,088
Fire risk 5/10 · Moderate
- Est. fire insurance / yr
- $963 – $1,789
Heat risk 7/10 · Major
- Hot days now (above 107°F)
- 7 days/yr
- Hot days in 30 yrs
- 17 days/yr
Wind risk 6/10 · Moderate
- Chance of severe wind over 30 yrs
- 63.0%
Air-quality risk 4/10 · Minor
- Unhealthy air days now
- 4 days/yr
- Unhealthy air days in 30 yrs
- 5 days/yr
Risk factors via First Street. Map © Google.
Why this score? — see what drove the D- grade
The composite is a weighted blend of 9 inputs, each scored 0–100. Each bar is that input's sub-score; the figure is the points it added to the 100-point composite (weight × sub-score).
- Cash flow +12.6/30.0
- Appreciation +4.0/10.0
- DSCR +3.8/10.0
- Livability +3.8/5.0
- 1% rule +3.2/10.0
- Schools +2.9/10.0
- ARV discount +2.5/15.0
- Rent growth +2.5/5.0
- Condition / age +2.5/5.0
$250,000
🖨 Deal sheet 📄 Offer letter ✓ Due diligence
Listing remarks MLS
Step into this stunning one-level Craftsman-style home, built in 2022 with low-maintenance living in mind. Featuring 3 bedrooms and 2 baths, this home is filled with modern finishes and thoughtful details, including durable LVP flooring throughout. The spacious backyard is perfect for kids, pets, or your dream garden! Close to shopping and schools!
Key facts
- Close to schools
- Craftsman style home
- Spacious backyard
Tags
Neighborhood map
What this means for you Summary
Snapshot
- This is a 3-bed/2.0-bath single-family listed at $250k.
Deal economics
- At list price, monthly cash flow is $-33 ($-393/yr) — negative.
- To cash-flow at today's rent, offer at most $244k (2.3% below list).
- To meet the 1% rule (rent ≥ 1% of price), the offer needs to be $205k (18.0% below list).
- Recommended offer: $205k (18.0% below list) — sets the bar for 1% rule.
- Cap rate 6.1% vs local median 4.2% in Gray — top-decile yield for the area; either an underpriced asset or a hidden risk that comps aren't pricing in. Stress-test before assuming the spread holds.
Location & tenants
- Location reads 76/100 on livability (#26 in GA, #3,600 nationally) — a middle-class / working-renter tenant base. Strengths: crime A+, cost of living A+, housing A+; Watch: schools D, amenities F, commute F.
- Jones County (rural): math 32% / reading 34% proficiency, ranked #72 of 174 in GA (top 41%) — families likely to look elsewhere, expect single-tenant / working-renter base with shorter leases.
- Market conditions: 94 active listings in the ZIP; 2 comparable units currently listed for rent nearby; 106 units permitted in Jones County in 2024 (6 in 5+ unit buildings).
Forward outlook
- Local home prices are declining (-1.9%/yr); year-one equity from $2k of loan paydown is wiped out by about $5k of value loss. Plan a longer hold.
- Jones County population projected at -11% by 2050 — secular population decline; favor cash flow + early exit over multi-decade hold.
Negotiation context
- It's been on market 43 days — a 3% lower offer ($242k) is reasonable based on typical stale-listing flexibility.
- 3 sale attempts since 4y ago with the ask held roughly flat each time — persistent listings suggest the price (not the market) is what's stuck; bring a comps-based counter.
- Current owner paid $199k; 26% above their basis — modest negotiation headroom, anchor on the comps not their cost.
Risks & watch-outs
- Climate carrying-cost: major wind risk, 63% chance of damaging wind over 30y; moderate wildfire risk; extreme-heat days projected 7→17/yr by 2055 (HVAC capex compounding) — expect insurance premiums to compound above CPI over the hold.
Questions for the listing agent
- What do current leases actually rent for vs. the listed asking? Can we see a recent rent roll and the last 12 months of T-12 income?
- It's been on market 43 days. Have you received any prior offers? Is the seller open to a 18% concession, seller financing, or rate buy-down credit?
- Is there a deadline driving the sale (1031 exchange, divorce, estate, relocation)? That informs how much negotiation room exists.
- Schools are D-rated, which usually means shorter tenancies and higher turnover. Who's the typical renter profile here, and what's been the actual vacancy rate?
- The area grade is low — what's the realistic commute time and amenity access for the typical tenant pool here? Any planned neighborhood developments (good or bad) we should know about?
- What's the average days-on-market for RENTAL listings here right now (not sales)? A rising rental-DOM trend means longer vacancies and softer asking-rent achievability than the comps imply.
- What's the recent tenant-quality profile in this submarket — average credit score on applications, eviction rate, late-payment / NSF rate, and stable-employment percentage? A property-management company in the area should have these aggregated.
- How much new for-sale + rental construction is in the pipeline within 1–3 miles? Heavy new supply typically softens prices + rents 12–24 months out; constrained supply supports both.
Investment metrics
- 1% rule
- 0.82% ✗
- Cap rate
- 6.14%
- Cash-on-cash
- -0.56%
- DSCR
- 0.98
- GRM
- 10.2
CMA / ARV
- ARV (median comp)
- $225,160
- List price
- $250,000
- Delta
- 11.03%
- Verdict
- OVERPRICED
- Comps
- 18 within 1.0 mi
Show comp detail 4 sales within ~0.75 mi
| Address | Dist | Beds/Ba | Sqft | Sold | Price | $/sf | Match |
|---|---|---|---|---|---|---|---|
| 850 Natures Walk | 0.04mi | 3/2.0 | 1,258 (-2%) | 7mo | $247,000 | $196 | 88 |
| 854 Natures Walk | 0.04mi | 3/2.0 | 1,224 (-5%) | 3mo | $250,000 | $204 | 87 |
| 870 Natures Walk | 0.08mi | 3/2.0 | 1,341 (+4%) | 21mo | $225,000 | $168 | 72 |
| 420 Mossy Ln | 0.36mi | 3/2.0 | 1,345 (+4%) | 8mo | $225,000 | $167 | 69 |
Match score weights: distance 35% · size 25% · config 20% · recency 20%. Top-matched comps best support the ARV.
Projected returns pro-forma
-1.92% appreciation · 3.0% rent growth · sell at horizon
- IRR
- -11.2%
- Equity multiple
- 0.56×
- Total profit
- $-31,121
- Equity at exit
- $49,499
- IRR
- -3.5%
- Equity multiple
- 0.72×
- Total profit
- $-19,556
- Equity at exit
- $43,205
Cash invested: $70,000 (down + closing). Projections, not guarantees.
Landlord ↔ Tenant lean methodology
- Overall (STATE)
- 90 Strongly Landlord-Friendly
- State Georgia
- 90 Strongly Landlord-Friendly · R+3
- County
- — inherits STATE
- City
- — inherits STATE
ZIP-level market 31032
- Home prices YoY
- -0.9%
- Active inventory
- 94
- Price-to-rent
- 10.2×
Monthly cashflow live
- Estimated rent
- $2,050 medium interval (Pro) →
- Mortgage (P&I)
- −$1,311
- Tax from tax record
- −$237 /mo · $2,844/yr
- Insurance
- −$104
- HOA
- −$0
- Vacancy / Maint / Mgmt
- −$430
- Net cashflow
- $-33
Break-even live
UW: 25.0% down · 7.5% · 30yr · 1.5% tax · 5.0% vac · 8.0% maint · 8.0% mgmt
Financing live
Cash to close
- Down payment
- $62,500
- Closing costs
- $7,500
- Reserves months
- —
- Total cash needed
- —
Loan-product check · same deal, 3 products live
Conventional
25% down · 7.5% · 30yr
- Down + closing
- —
- Monthly P&I
- —
- Monthly cashflow
- —
- DSCR
- —
- Eligible?
- —
Personal DTI + credit; lowest rate.
DSCR
20% down · 8.5% · 30yr
- Down + closing
- —
- Monthly P&I
- —
- Monthly cashflow
- —
- DSCR
- —
- Eligible?
- —
No personal income docs; deal must DSCR.
Hard money
10% down · 12.0% · 12mo
- Down + closing
- —
- Monthly P&I
- —
- Monthly cashflow
- —
- DSCR
- —
- Eligible?
- —
Short-term bridge; refi at stabilization.
Rent comps 2 comps
| Address | Beds | Baths | Sqft | Rent | $/sqft | DOM | Units | Dist |
|---|---|---|---|---|---|---|---|---|
| 134 Stone Brooke Dr Gray, GA | 3.0 | 2.0 | 1652 | $2,200 | $1.33 | 43d | 1 | 1.22mi |
| 134 Stone Brooke Dr Gray, GA | 3.0 | 2.0 | 1652 | $1,900 | $1.15 | 13d | 1 | 1.22mi |
Listing history 14 events
-
2026-06-03status $250,000 Under Contract 43 DOM
-
2026-06-02days on market $250,000 Active 43 DOM
-
2026-06-01days on market $250,000 Active 42 DOM
-
2026-05-31days on market $250,000 Active 41 DOM
-
2026-05-30days on market $250,000 Active 40 DOM
-
2026-04-20$250,000 New 350-char remark
Show marketing remark (350 chars)
Step into this stunning one-level Craftsman-style home, built in 2022 with low-maintenance living in mind. Featuring 3 bedrooms and 2 baths, this home is filled with modern finishes and thoughtful details, including durable LVP flooring throughout. The spacious backyard is perfect for kids, pets, or your dream garden! Close to shopping and schools!
-
2026-04-19$250,000 Active 350-char remark
Show marketing remark (350 chars)
Step into this stunning one-level Craftsman-style home, built in 2022 with low-maintenance living in mind. Featuring 3 bedrooms and 2 baths, this home is filled with modern finishes and thoughtful details, including durable LVP flooring throughout. The spacious backyard is perfect for kids, pets, or your dream garden! Close to shopping and schools!
-
2023-02-02soldstatus $198,900
-
2023-01-31soldstatus $198,900 Sold
-
2022-10-24status Under Contract
-
2022-10-16$198,900 New
-
2022-05-12soldstatus $59,400
-
2010-09-24soldstatus $7,200
-
2006-08-01soldstatus $180,000
ⓘ Source: listings_history table (triggers on properties + properties_extension) + one-shot
backfill from property_details.listing_events for pre-trigger history.
Tax reassessment forecast GA · Resets to sale price
- Current annual tax
- $2,844 · $237/mo
- Projected year-2 tax
- $2,844 · $237/mo
- Expected delta
- $0/yr ($0/mo · 0.0%)
ⓘ Screening estimate from a state-policy table — verify with the county assessor before closing.
Climate risk First Street
- Flood 1/10 Low FEMA zone X (unshaded) · 0% chance over 30 yrs
- Wildfire 5/10 Major
- Heat 7/10 Severe 7 d/yr ≥107°F today · 17 d/yr by 30 yrs out
- Wind 6/10 Major 63% chance of damaging wind over 30 yrs
- Air quality 4/10 Moderate 4 unhealthy d/yr today · 5 by 30 yrs out
Nearby sold comps map
Loading sold comps map…
Walkable amenities ~0.75 mi
Loading nearby amenities…
Taxation est. · year 1
- Rental income
- $24,600
- − Mortgage interest
- −$14,004
- − Property taxes
- −$2,844
- − Insurance
- −$1,250
- − Repairs & maintenance
- −$1,968
- − Management
- −$1,968
- − Depreciation
- −$7,273
- Taxable loss
- −$4,707
- Est. tax savings @ 24.0%
- +$1,130
- After-tax cash flow
- $737/yr
For passive investors: Depreciation is non-cash, so a rental often shows a tax loss while cash-flowing — sheltering income. Rental losses are passive: they offset passive income freely, and up to $25,000/yr can offset ordinary (W-2) income if you actively participate and your MAGI is under $100k (phasing out to $0 by $150k); unused losses carry forward. On sale, claimed depreciation is recaptured at up to 25%, and gains may owe capital-gains tax (a 1031 exchange can defer both). Figures are a year-1 estimate at your 24.0% rate — not tax advice; consult a CPA.
Schools (NCES district)
- District
- Jones County
- NCES district ID
- 1303150
- Math proficiency
- 32% ▼ -8.00%
- Reading proficiency
- 34% ▼ -8.00%
- Median HH income
- $51,630
- Composite
- 28.84/100
- National rank
- #6649
- State rank
- #72 of 174 in GA
Livability — Gray
- Score
- 76/100
- State rank
- #26
- US rank
- #3600
Category grades
Schools grade is shown separately in the Schools card above.
Census & demographics
- Census place
- Gray, GA
- Population (ZIP)
- 13,755
Population outlook (Jones County) Hauer SSP2
- Today (2025)
- 28,682 people
- By 2030
- 28,394 · -1.0%
- By 2040
- 27,246 · -5.0%
- By 2050
- 25,575 · -10.8%
- By 2075
- 21,857 · -23.8%
- By 2100
- 17,453 · -39.1%
Race, ethnicity, and origin ACS 2023
- Neighborhood character
- Predominantly White (77%)
- Race & ethnicity
- White 77% Black 18% Two or more races 2% Hispanic / Latino 2%
- Common ancestry
- Italian 3% Romanian 2% Slovak 2%
- Foreign-born
- 2% · Canada
- Languages at home
- 97% English-only · Spanish 2%
Political lean MEDSL · Jones
- 2024 margin
- Solid R (+38.0) · D 30.8% · R 68.8%
- 2008→2024 swing
- -12.2pp toward R · 2008: -25.8pp · 2024: -38.0pp
- All cycles
- 2024: R+38.0 2020: R+33.9 2016: R+34.7 2012: R+28.7 2008: R+25.8
Not yet ingested
- Civics
- —
Market trends
- HPI YoY
- ▼ -1.92%
- Current HPI
- 211.7341
- Rent YoY
- —
- Metro
- —
- State GDP YoY
- ▲ 2.66%
- F500 in state
- 28
Industry mix (Fortune 500 HQ in GA)
| Industry | F500 HQs | Revenue |
|---|---|---|
| Paper / Packaging | 2 | $29B |
|
||
| Retail | 1 | $160B |
|
||
| Transportation / Logistics | 1 | $91B |
|
||
| Airlines | 1 | $62B |
|
||
| Consumer Goods | 1 | $47B |
|
||
| Utilities | 1 | $25B |
|
||
Price history
+38.9% since first listed9 events — show timeline
- 2026-04-20 Listed $250,000 GAMLS
- 2026-04-19 Listed $250,000 MGMLS
- 2023-02-02 Sold (Public Records) $198,900 Public Records
- 2023-01-31 Sold (MLS) $198,900 GAMLS
- 2022-10-24 Pending — GAMLS
- 2022-10-16 Listed $198,900 GAMLS
- 2022-05-12 Sold (Public Records) $59,400 Public Records
- 2010-09-24 Sold (Public Records) $7,200 Public Records
- 2006-08-01 Sold (Public Records) $180,000 Public Records
Property tax history
+36.7%/yrLatest (2025): $2,844 · +8.0% YoY. Source: county tax records.
Cash-flow waterfall
monthlySold comps — $/sqft
last 12 mo · ≤1 miLoading sold comps…