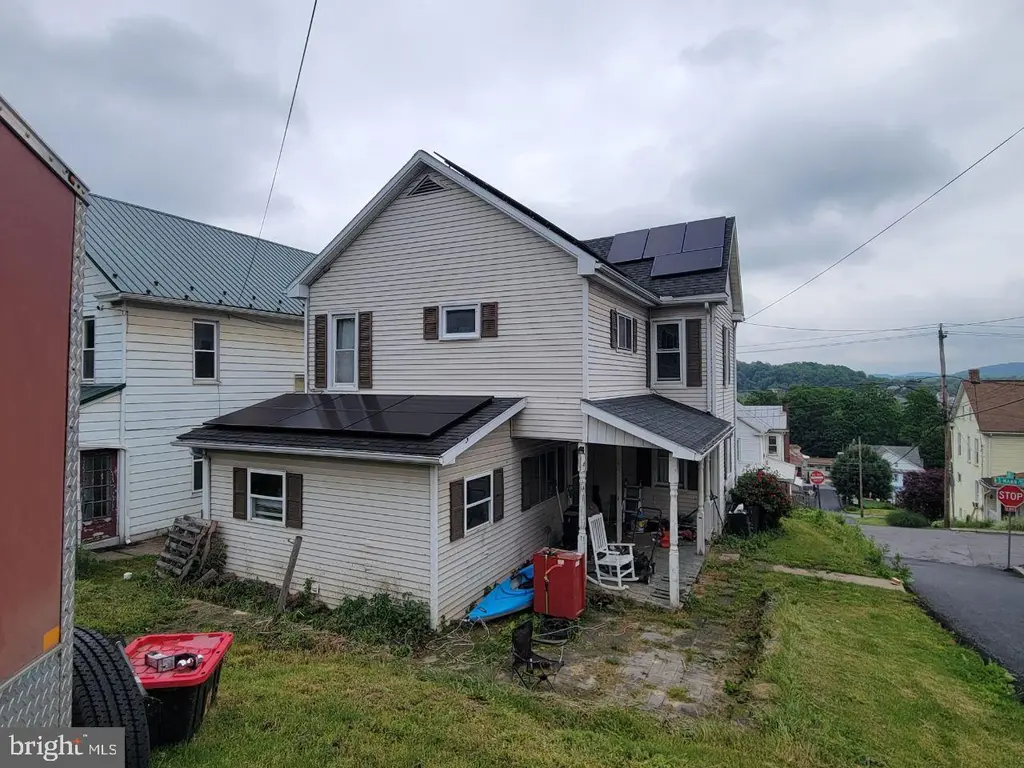
50 S Mann Ave · Derry, PA
Flood risk 1/10 · Minimal
- FEMA flood zone
- X (unshaded)
- Chance of flooding over 30 yrs
- 0.0%
- Est. flood insurance / yr
- $473 – $860
Fire risk 3/10 · Minor
- Est. fire insurance / yr
- $511 – $949
Heat risk 4/10 · Minor
- Hot days now (above 98°F)
- 7 days/yr
- Hot days in 30 yrs
- 17 days/yr
Wind risk 2/10 · Minimal
- Chance of severe wind over 30 yrs
- —
Air-quality risk 2/10 · Minimal
- Unhealthy air days now
- 0 days/yr
- Unhealthy air days in 30 yrs
- 1 days/yr
Risk factors via First Street. Map © Google.
Why this score? — see what drove the B+ grade
The composite is a weighted blend of 9 inputs, each scored 0–100. Each bar is that input's sub-score; the figure is the points it added to the 100-point composite (weight × sub-score).
- Cash flow +30.0/30.0
- DSCR +10.0/10.0
- 1% rule +9.8/10.0
- ARV discount +7.5/15.0
- Appreciation +7.0/10.0
- Livability +3.4/5.0
- Schools +3.2/10.0
- Rent growth +2.5/5.0
- Condition / age +2.5/5.0
$135,000
🖨 Deal sheet 📄 Offer letter ✓ Due diligence
Listing remarks MLS
3 bedroom, 1.5 bath 2 story on corner lot. Freshly renovated with many new finishes, paint, etc. You will love the open kitchen complete with island w/ CeasarStone top, stainless steel range & fan hood, and modern tile back splash. Convenient first floor laundry and half bath. Dining room features built-in corner cupboards and shelving/storage. Almost a complete rewiring of house was recently completed. Many new windows, newer roof and boiler(recently serviced). Second floor has all new flooring. Clean and fresh!
Key facts
- 6,750 sq ft lot
- Built 1900
- Listed 5 days
Property features AI
Exterior
- Parking: On-street parking
- Utilities: Public water; Public sewer; Electric service (standard utility—public)
- Home design: Detached property; Estimated year built
- Construction: Asphalt construction materials; Asphalt roof; Concrete perimeter foundation
- Exterior features: Corner lot; Not in a federal flood zone; Pets allowed on a case-by-case basis
Interior
- Bedrooms: 3 bedrooms on the upper level
- Flooring: Hardwood floors
- Bathrooms: 1 full bathroom (upper level); 1 half bathroom (main level)
- Heating & cooling: Baseboard hot water heating; Oil-fired hot water
- Interior features: Dry wall walls and ceilings; Unfinished basement
Neighborhood map
What this means for you Summary
Snapshot
- This is a 3-bed/1.5-bath other listed at $135k.
Deal economics
- At list price, monthly cash flow is $661 ($8k/yr) — positive.
- The deal already cash-flows at list — no discount required.
- Meets the 1% rule at list price ($2k rent vs $135k).
- Cap rate 12.2% vs local median 3.5% in Derry — top-decile yield for the area; either an underpriced asset or a hidden risk that comps aren't pricing in. Stress-test before assuming the spread holds.
Location & tenants
- Location reads 67/100 on livability (#952 in PA) — a middle-class / working-renter tenant base. Strengths: crime A+, cost of living A+, housing A+; Watch: employment D+, amenities F, commute F.
- Mifflin County SD (town): math 28% / reading 49% proficiency, ranked #380 of 539 in PA (top 70%) — families likely to look elsewhere, expect single-tenant / working-renter base with shorter leases.
- Market conditions: 13 active listings in the ZIP; 1 comparable units currently listed for rent nearby; 58 units permitted in Mifflin County in 2024 (0 in 5+ unit buildings).
Forward outlook
- In year one you build about $6k of equity ($933 loan paydown + $6k appreciation (4.1% local appreciation)).
- Mifflin County population projected at -18% by 2050 — secular population decline; favor cash flow + early exit over multi-decade hold.
- At projected returns (4.1% appreciation + 3.0% rent growth), your $38k cash investment doubles in ~3 years — after that, you're playing with house money.
- By year 6, paydown + projected appreciation supports a ~$34k cash-out refi (75% LTV) — recoverable capital for the next deal without selling this one.
Negotiation context
- Only 5 days on market — expect competitive offers; lowballing is unlikely to land.
- 5 sale attempts since 26y ago with the ask held roughly flat each time — persistent listings suggest the price (not the market) is what's stuck; bring a comps-based counter.
- Current owner paid $90k; list at $135k implies a 50% gain — meaningful room to come down on a strong offer.
Risks & watch-outs
- Watch-outs: built in 1900 — expect roof / HVAC / electrical / plumbing capex.
Questions for the listing agent
- Built in 1900 — when were the roof, HVAC, electrical panel, plumbing, and water heater last replaced?
- Is there a deadline driving the sale (1031 exchange, divorce, estate, relocation)? That informs how much negotiation room exists.
- Schools are B-rated — typically a magnet for longer-tenancy family renters. What's the average tenant stay here, and is there a school-zone premium baked into asking?
- What's the average days-on-market for RENTAL listings here right now (not sales)? A rising rental-DOM trend means longer vacancies and softer asking-rent achievability than the comps imply.
- What's the recent tenant-quality profile in this submarket — average credit score on applications, eviction rate, late-payment / NSF rate, and stable-employment percentage? A property-management company in the area should have these aggregated.
- How much new for-sale + rental construction is in the pipeline within 1–3 miles? Heavy new supply typically softens prices + rents 12–24 months out; constrained supply supports both.
Investment metrics
- 1% rule
- 1.48% ✓
- Cap rate
- 12.16%
- Cash-on-cash
- 20.97%
- DSCR
- 1.93
- GRM
- 5.6
CMA / ARV
No comps found within radius.
Projected returns pro-forma
4.08% appreciation · 3.0% rent growth · sell at horizon
- IRR
- 29.4%
- Equity multiple
- 2.75×
- Total profit
- $66,211
- Equity at exit
- $69,059
- IRR
- 28.9%
- Equity multiple
- 5.43×
- Total profit
- $167,530
- Equity at exit
- $113,441
Cash invested: $37,800 (down + closing). Projections, not guarantees.
Landlord ↔ Tenant lean methodology
- Overall (STATE)
- 62 Landlord-Friendly
- State Pennsylvania
- 62 Landlord-Friendly · EVEN
- County
- — inherits STATE
- City
- — inherits STATE
ZIP-level market 17099
- Home prices YoY
- 1.7%
- Active inventory
- 13
- Price-to-rent
- 5.6×
Monthly cashflow live
- Estimated rent
- $2,000 medium interval (Pro) →
- Mortgage (P&I)
- −$708
- Tax from tax record
- −$155 /mo · $1,863/yr
- Insurance
- −$56
- HOA
- −$0
- Vacancy / Maint / Mgmt
- −$420
- Net cashflow
- $661
Break-even live
UW: 25.0% down · 7.5% · 30yr · 1.5% tax · 5.0% vac · 8.0% maint · 8.0% mgmt
Financing live
Cash to close
- Down payment
- $33,750
- Closing costs
- $4,050
- Reserves months
- —
- Total cash needed
- —
Loan-product check · same deal, 3 products live
Conventional
25% down · 7.5% · 30yr
- Down + closing
- —
- Monthly P&I
- —
- Monthly cashflow
- —
- DSCR
- —
- Eligible?
- —
Personal DTI + credit; lowest rate.
DSCR
20% down · 8.5% · 30yr
- Down + closing
- —
- Monthly P&I
- —
- Monthly cashflow
- —
- DSCR
- —
- Eligible?
- —
No personal income docs; deal must DSCR.
Hard money
10% down · 12.0% · 12mo
- Down + closing
- —
- Monthly P&I
- —
- Monthly cashflow
- —
- DSCR
- —
- Eligible?
- —
Short-term bridge; refi at stabilization.
Rent comps 1 comps
| Address | Beds | Baths | Sqft | Rent | $/sqft | DOM | Units | Dist |
|---|---|---|---|---|---|---|---|---|
| 203 4th Ave Burnham, PA | 3.0 | 2.0 | 1960 | $2,000 | $1.02 | 43d | 1 | 0.59mi |
Listing history 6 events
-
2026-06-18days on market $135,000 Active 5 DOM
-
2026-06-17days on market $135,000 Active 4 DOM
-
2026-06-16days on market $135,000 Active 3 DOM
-
2026-06-15days on market $135,000 Active 2 DOM
-
2026-06-14remarks 699-char remark
-
2026-06-14$135,000 Active 1 DOM
ⓘ Source: listings_history table (triggers on properties + properties_extension) + one-shot
backfill from property_details.listing_events for pre-trigger history.
Tax reassessment forecast PA · Partial reset (capped growth)
- Current annual tax
- $1,863 · $155/mo
- Projected year-2 tax
- $1,998 · $166/mo
- Expected delta
- +$135/yr (+$11/mo · 7.3%)
ⓘ Screening estimate from a state-policy table — verify with the county assessor before closing.
Climate risk First Street
- Flood 1/10 Low FEMA zone X (unshaded) · 0% chance over 30 yrs
- Wildfire 3/10 Moderate
- Heat 4/10 Moderate 7 d/yr ≥98°F today · 17 d/yr by 30 yrs out
- Wind 2/10 Low
- Air quality 2/10 Low 0 unhealthy d/yr today · 1 by 30 yrs out
Nearby sold comps map
Loading sold comps map…
Walkable amenities ~0.75 mi
Loading nearby amenities…
Taxation est. · year 1
- Rental income
- $24,000
- − Mortgage interest
- −$7,562
- − Property taxes
- −$1,863
- − Insurance
- −$675
- − Repairs & maintenance
- −$1,920
- − Management
- −$1,920
- − Depreciation
- −$3,927
- Taxable income
- $6,133
- Est. tax owed @ 24.0%
- −$1,472
- After-tax cash flow
- $6,455/yr
For passive investors: Depreciation is non-cash, so a rental often shows a tax loss while cash-flowing — sheltering income. Rental losses are passive: they offset passive income freely, and up to $25,000/yr can offset ordinary (W-2) income if you actively participate and your MAGI is under $100k (phasing out to $0 by $150k); unused losses carry forward. On sale, claimed depreciation is recaptured at up to 25%, and gains may owe capital-gains tax (a 1031 exchange can defer both). Figures are a year-1 estimate at your 24.0% rate — not tax advice; consult a CPA.
Schools (NCES district)
- District
- Mifflin County SD
- NCES district ID
- 4215290
- Math proficiency
- 28% ▼ -7.00%
- Reading proficiency
- 49% ▼ -9.00%
- Median HH income
- $40,718
- Composite
- 32.28/100
- National rank
- #5755
- State rank
- #380 of 539 in PA
Livability — Derry
- Score
- 67/100
- State rank
- #952
- US rank
- #10435
Category grades
Schools grade is shown separately in the Schools card above.
Census & demographics
- Census place
- Yeagertown, PA
- Population (ZIP)
- 1,122
Population outlook (Mifflin County) Hauer SSP2
- Today (2025)
- 44,611 people
- By 2030
- 43,212 · -3.1%
- By 2040
- 40,197 · -9.9%
- By 2050
- 36,813 · -17.5%
- By 2075
- 28,833 · -35.4%
- By 2100
- 20,296 · -54.5%
Race, ethnicity, and origin ACS 2023
- Neighborhood character
- Predominantly White (100%)
- Race & ethnicity
- White 100%
- Common ancestry
- Portuguese 5% Romanian 2% Iranian 2%
Political lean MEDSL · Mifflin
- 2024 margin
- Solid R (+56.4) · D 21.4% · R 77.9%
- 2008→2024 swing
- -22.8pp toward R · 2008: -33.7pp · 2024: -56.4pp
- All cycles
- 2024: R+56.4 2020: R+56.1 2016: R+57.5 2012: R+46.8 2008: R+33.7
Not yet ingested
- Civics
- —
Market trends
- HPI YoY
- ▲ 4.08%
- Current HPI
- 240.0488
- Rent YoY
- —
- Metro
- —
- State GDP YoY
- ▲ 1.68%
- F500 in state
- 34
Industry mix (Fortune 500 HQ in PA)
| Industry | F500 HQs | Revenue |
|---|---|---|
| Healthcare | 2 | $309B |
|
||
| Insurance | 2 | $27B |
|
||
| Telecommunications / Media | 1 | $124B |
|
||
| Industrial Distribution | 1 | $22B |
|
||
| Financial Services | 1 | $20B |
|
||
| Chemicals / Materials | 1 | $18B |
|
||
Price history
+170.5% since first listed12 events — show timeline
- 2026-06-13 Listed $135,000 BRIGHT MLS
- 2018-04-11 Sold (Public Records) $89,900 Public Records
- 2018-04-09 Sold (MLS) $89,900 BRIGHT MLS
- 2018-01-25 Listed $89,900 BRIGHT MLS
- 2017-11-14 Sold (Public Records) $26,500 Public Records
- 2017-11-13 Sold (MLS) $26,500 BRIGHT MLS
- 2017-09-20 Listed $34,900 BRIGHT MLS
- 2001-11-26 Sold (Public Records) $42,000 Public Records
- 2001-11-26 Sold (MLS) $42,000 BRIGHT MLS
- 2001-09-19 Listed $49,900 BRIGHT MLS
- 2000-08-18 Listing Removed — BRIGHT MLS
- 2000-08-18 Listed $49,900 BRIGHT MLS
Property tax history
+0.6%/yrLatest (2026): $1,863 · +0.8% YoY. Source: county tax records.
Cash-flow waterfall
monthlySold comps — $/sqft
last 12 mo · ≤1 miLoading sold comps…