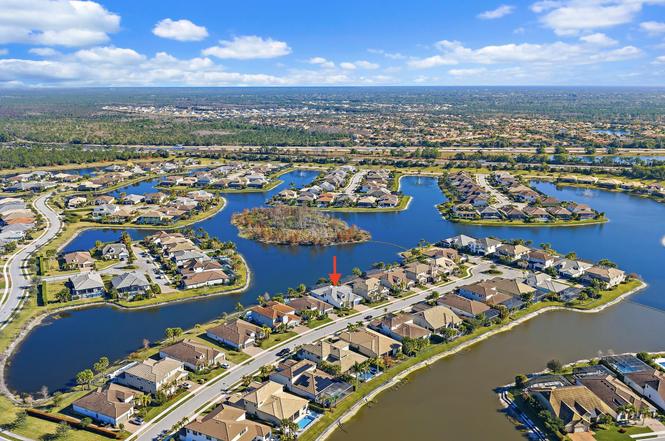
125 Indigo River Pt · Jupiter, FL
Flood risk 1/10 · Minimal
- FEMA flood zone
- X (unshaded)
- Chance of flooding over 30 yrs
- 0.0%
- Est. flood insurance / yr
- $507 – $1,088
Fire risk 3/10 · Minor
- Est. fire insurance / yr
- $947 – $1,759
Heat risk 9/10 · Severe
- Hot days now (above 106°F)
- 7 days/yr
- Hot days in 30 yrs
- 23 days/yr
Wind risk 10/10 · Severe
- Chance of severe wind over 30 yrs
- 99.0%
Air-quality risk 1/10 · Minimal
- Unhealthy air days now
- 0 days/yr
- Unhealthy air days in 30 yrs
- 0 days/yr
Risk factors via First Street. Map © Google.
Why this score? — see what drove the C+ grade
The composite is a weighted blend of 9 inputs, each scored 0–100. Each bar is that input's sub-score; the figure is the points it added to the 100-point composite (weight × sub-score).
- Cash flow +26.2/30.0
- DSCR +8.8/10.0
- ARV discount +7.5/15.0
- 1% rule +7.3/10.0
- Schools +4.3/10.0
- Livability +3.5/5.0
- Rent growth +2.5/5.0
- Condition / age +2.5/5.0
- Appreciation +0.0/10.0
$1,775,000
🖨 Deal sheet 📄 Offer letter ✓ Due diligence
Listing remarks
Enjoy stunning panoramic water views from one of the most coveted lots within the prestigious gated community of Sonoma Isles in Jupiter. Perfectly positioned to maximize its breathtaking waterfront setting, this exceptional residence offers expansive living areas, refined designer finishes, and seamless indoor-outdoor flow--creating the ultimate backdrop for elevated everyday living and unforgettable sunsets. Thoughtfully designed for both privacy and functionality, the home features four spacious bedrooms, each privately situated in its own corner of the home, an oversized loft, a dedicated den/office, and a generous three-car garage--providing ample space to live, work, and entertain in
Key facts
- Gated community
- Designer finishes
- Indoor-outdoor flow
Tags
Neighborhood map
What this means for you Summary
Snapshot
- This is a 4-bed/4.0-bath single-family listed at $1.77M.
Deal economics
- At list price, monthly cash flow is $5k ($54k/yr) — positive.
- The deal already cash-flows at list — no discount required.
- Meets the 1% rule at list price ($22k rent vs $1.77M).
- Recommended offer: $1.75M (1.5% below list) — sets the bar for market timing.
- Cap rate 9.3% vs local median 2.6% in Jupiter — top-decile yield for the area; either an underpriced asset or a hidden risk that comps aren't pricing in. Stress-test before assuming the spread holds.
Location & tenants
- Location reads 70/100 on livability (#415 in FL) — a middle-class / working-renter tenant base. Strengths: crime A+, employment A+, housing A+; Watch: amenities F, commute F, cost of living F.
- Palm Beach (suburban): math 46% / reading 53% proficiency, ranked #34 of 73 in FL (top 47%) — families likely to look elsewhere, expect single-tenant / working-renter base with shorter leases.
- Zoned schools: Jerry Thomas Elementary School (math 60% / reading 67%, grade B, #564 of 2,144 statewide, top 27%, 718 students, 41% FRL); Independence Middle School (math 71% / reading 67%, grade A, #68 of 571 statewide, top 12%, 1,166 students, 25% FRL); Jupiter High School (math 56% / reading 64%, grade C+, #106 of 667 statewide, top 16%, 3,087 students, 28% FRL) — zoned schools average 31% FRL vs 52% district-wide (21 pts lower); this property's tenant base skews higher-income than the district average.
- Zoned-school proficiency averages 64% at this address vs 50% district-wide (+15 pts) — the actual schools serving this property are materially stronger than the Palm Beach average implies; a family-tenant draw the district grade alone would hide.
- Market conditions: 126 active listings in the ZIP; 6 comparable units currently listed for rent nearby; rentals at typical pace (median 24d on market — plan ~3-4 weeks tenant-placement turnaround); 3,974 units permitted in Palm Beach County in 2024 (1,012 in 5+ unit buildings).
Forward outlook
- Local home prices are declining (-3.0%/yr); year-one equity from $12k of loan paydown is wiped out by about $53k of value loss. Plan a longer hold.
- Palm Beach County population projected at +30% by 2050 — long-run rental-demand tailwind backs the buy-and-hold thesis.
- At projected returns (-3.0% appreciation + 3.0% rent growth), your $497k cash investment doubles in ~10 years — after that, you're playing with house money.
Negotiation context
- It's been on market 22 days — a 2% lower offer ($1.75M) is reasonable based on typical stale-listing flexibility.
Risks & watch-outs
- Climate carrying-cost: severe wind risk, 99% chance of damaging wind over 30y; extreme-heat days projected 7→23/yr by 2055 (HVAC capex compounding) — expect insurance premiums to compound above CPI over the hold.
Questions for the listing agent
- What does the HOA fee cover, when was the last increase, and are there any pending special assessments or reserve-fund shortfalls?
- Is there a deadline driving the sale (1031 exchange, divorce, estate, relocation)? That informs how much negotiation room exists.
- Schools are A-rated — typically a magnet for longer-tenancy family renters. What's the average tenant stay here, and is there a school-zone premium baked into asking?
- What's the average days-on-market for RENTAL listings here right now (not sales)? A rising rental-DOM trend means longer vacancies and softer asking-rent achievability than the comps imply.
- What's the recent tenant-quality profile in this submarket — average credit score on applications, eviction rate, late-payment / NSF rate, and stable-employment percentage? A property-management company in the area should have these aggregated.
- How much new for-sale + rental construction is in the pipeline within 1–3 miles? Heavy new supply typically softens prices + rents 12–24 months out; constrained supply supports both.
Investment metrics
- 1% rule
- 1.23% ✓
- Cap rate
- 9.34%
- Cash-on-cash
- 10.89%
- DSCR
- 1.48
- GRM
- 6.8
CMA / ARV
No comps found within radius.
Projected returns pro-forma
-3.0% appreciation · 3.0% rent growth · sell at horizon
- IRR
- 0.0%
- Equity multiple
- 1.00×
- Total profit
- $197
- Equity at exit
- $264,658
- IRR
- 9.7%
- Equity multiple
- 1.75×
- Total profit
- $372,530
- Equity at exit
- $153,470
Cash invested: $497,000 (down + closing). Projections, not guarantees.
Landlord ↔ Tenant lean methodology
- Overall (STATE)
- 87 Strongly Landlord-Friendly
- State Florida
- 87 Strongly Landlord-Friendly · R+3
- County
- — inherits STATE
- City
- — inherits STATE
ZIP-level market 33478
- Active inventory
- 126
- Price-to-rent
- 6.8×
Monthly cashflow live
- Estimated rent
- $21,847 high interval (Pro) →
- Mortgage (P&I)
- −$9,308
- Tax from tax record
- −$2,048 /mo · $24,579/yr
- Insurance
- −$740
- HOA
- −$654
- Vacancy / Maint / Mgmt
- −$4,588
- Net cashflow
- $4,509
Break-even live
UW: 25.0% down · 7.5% · 30yr · 1.5% tax · 5.0% vac · 8.0% maint · 8.0% mgmt
Financing live
Cash to close
- Down payment
- $443,750
- Closing costs
- $53,250
- Reserves months
- —
- Total cash needed
- —
Loan-product check · same deal, 3 products live
Conventional
25% down · 7.5% · 30yr
- Down + closing
- —
- Monthly P&I
- —
- Monthly cashflow
- —
- DSCR
- —
- Eligible?
- —
Personal DTI + credit; lowest rate.
DSCR
20% down · 8.5% · 30yr
- Down + closing
- —
- Monthly P&I
- —
- Monthly cashflow
- —
- DSCR
- —
- Eligible?
- —
No personal income docs; deal must DSCR.
Hard money
10% down · 12.0% · 12mo
- Down + closing
- —
- Monthly P&I
- —
- Monthly cashflow
- —
- DSCR
- —
- Eligible?
- —
Short-term bridge; refi at stabilization.
Rent comps 6 comps
| Address | Beds | Baths | Sqft | Rent | $/sqft | DOM | Units | Dist |
|---|---|---|---|---|---|---|---|---|
| 141 Cinder Dunes Pt Jupiter, FL | 4.0 | 4.0 | 3856 | $20,000 | $5.19 | 24d | 1 | 0.21mi |
| 182 Rosalia Ct Jupiter, FL | 4.0 | 4.5 | 4000 | $25,000 | $6.25 | 24d | 1 | 0.72mi |
| 18363 Island Oak Ave Jupiter, FL | 5.0 | 4.0 | 3833 | $18,000 | $4.70 | 24d | 1 | 0.86mi |
| 179 Carmela Ct Jupiter, FL | 3.0 | 4.5 | 3930 | $30,000 | $7.63 | 18d | 1 | 0.88mi |
| 131 Carmela Ct Jupiter, FL | 5.0 | 5.5 | 4463 | $22,000 | $4.93 | 20d | 1 | 0.90mi |
| 183 Rudder Cay Way Jupiter, FL | 5.0 | 3.0 | 2972 | $6,000 | $2.02 | 5d | 1 | 0.98mi |
HOA detail
- Monthly dues
- $654 · $7,848/yr
- Likely covers
- watersecurity
Listing history 2 events
-
2026-03-12status Pending
-
2026-02-18$1,775,000 Active
ⓘ Source: listings_history table (triggers on properties + properties_extension) + one-shot
backfill from property_details.listing_events for pre-trigger history.
Tax reassessment forecast FL · Resets to sale price
- Current annual tax
- $24,579 · $2,048/mo
- Projected year-2 tax
- $24,579 · $2,048/mo
- Expected delta
- $0/yr ($0/mo · 0.0%)
ⓘ Screening estimate from a state-policy table — verify with the county assessor before closing.
Climate risk First Street
- Flood 1/10 Low FEMA zone X (unshaded) · 0% chance over 30 yrs
- Wildfire 3/10 Moderate
- Heat 9/10 Extreme 7 d/yr ≥106°F today · 23 d/yr by 30 yrs out
- Wind 10/10 Extreme 99% chance of damaging wind over 30 yrs
- Air quality 1/10 Low 0 unhealthy d/yr today · 0 by 30 yrs out
Nearby sold comps map
Loading sold comps map…
Walkable amenities ~0.75 mi
Loading nearby amenities…
Taxation est. · year 1
- Rental income
- $262,168
- − Mortgage interest
- −$99,428
- − Property taxes
- −$24,579
- − Insurance
- −$8,875
- − Repairs & maintenance
- −$20,973
- − Management
- −$20,973
- − HOA
- −$7,848
- − Depreciation
- −$51,636
- Taxable income
- $27,855
- Est. tax owed @ 24.0%
- −$6,685
- After-tax cash flow
- $47,426/yr
For passive investors: Depreciation is non-cash, so a rental often shows a tax loss while cash-flowing — sheltering income. Rental losses are passive: they offset passive income freely, and up to $25,000/yr can offset ordinary (W-2) income if you actively participate and your MAGI is under $100k (phasing out to $0 by $150k); unused losses carry forward. On sale, claimed depreciation is recaptured at up to 25%, and gains may owe capital-gains tax (a 1031 exchange can defer both). Figures are a year-1 estimate at your 24.0% rate — not tax advice; consult a CPA.
Schools (NCES district)
- District
- Palm Beach
- NCES district ID
- 1201500
- Math proficiency
- 46% ▼ -16.00%
- Reading proficiency
- 53% ▼ -4.00%
- Median HH income
- $53,943
- Composite
- 42.72/100
- National rank
- #3160
- State rank
- #34 of 73 in FL
Livability — Jupiter
- Score
- 70/100
- State rank
- #415
- US rank
- #7386
Category grades
Schools grade is shown separately in the Schools card above.
Census & demographics
- Census place
- Jupiter, FL
- City population
- 68,420
- Population (ZIP)
- 15,205
Population outlook (Palm Beach County) Hauer SSP2
- Today (2025)
- 1,637,487 people
- By 2030
- 1,743,255 · +6.5%
- By 2040
- 1,948,712 · +19.0%
- By 2050
- 2,132,979 · +30.3%
- By 2075
- 2,530,027 · +54.5%
- By 2100
- 2,706,979 · +65.3%
Race, ethnicity, and origin ACS 2023
- Neighborhood character
- Predominantly White (80%)
- Race & ethnicity
- White 80% Two or more races 14% Hispanic / Latino 8% Asian 3%
- Hispanic origin (detail)
- Puerto Rican 1% Cuban 1%
- Common ancestry
- Slovak 4% Romanian 4% Italian 3%
- Foreign-born
- 10% · Canada, China, Vietnam
- Languages at home
- 86% English-only · Spanish 5% Other Indo-European 4% Russian/Polish/Slavic 1%
Political lean MEDSL · Palm Beach
- 2024 margin
- Toss-up / Even · D 50.0% · R 49.2%
- 2008→2024 swing
- -22.1pp toward R · 2008: 22.9pp · 2024: 0.8pp
- All cycles
- 2024: D+0.8 2020: D+12.8 2016: D+15.3 2012: D+17.0 2008: D+22.9
Not yet ingested
- Civics
- —
Market trends
- HPI YoY
- ▼ -306.11%
- Current HPI
- 427.5178
- Rent YoY
- —
- Metro
- —
- State GDP YoY
- ▲ 3.28%
- F500 in state
- 36
Industry mix (Fortune 500 HQ in FL)
| Industry | F500 HQs | Revenue |
|---|---|---|
| Industrial Technology | 2 | $29B |
|
||
| Insurance | 2 | $17B |
|
||
| Retail | 1 | $60B |
|
||
| Technology Distribution | 1 | $58B |
|
||
| Homebuilding | 1 | $35B |
|
||
| Technology Manufacturing | 1 | $35B |
|
||
Price history
2 events — show timeline
- 2026-03-12 Pending — Beaches MLS
- 2026-02-18 Listed $1,775,000 Beaches MLS
Property tax history
+29.3%/yrLatest (2025): $24,579 · +4.9% YoY. Source: county tax records.
Cash-flow waterfall
monthlySold comps — $/sqft
last 12 mo · ≤1 miLoading sold comps…