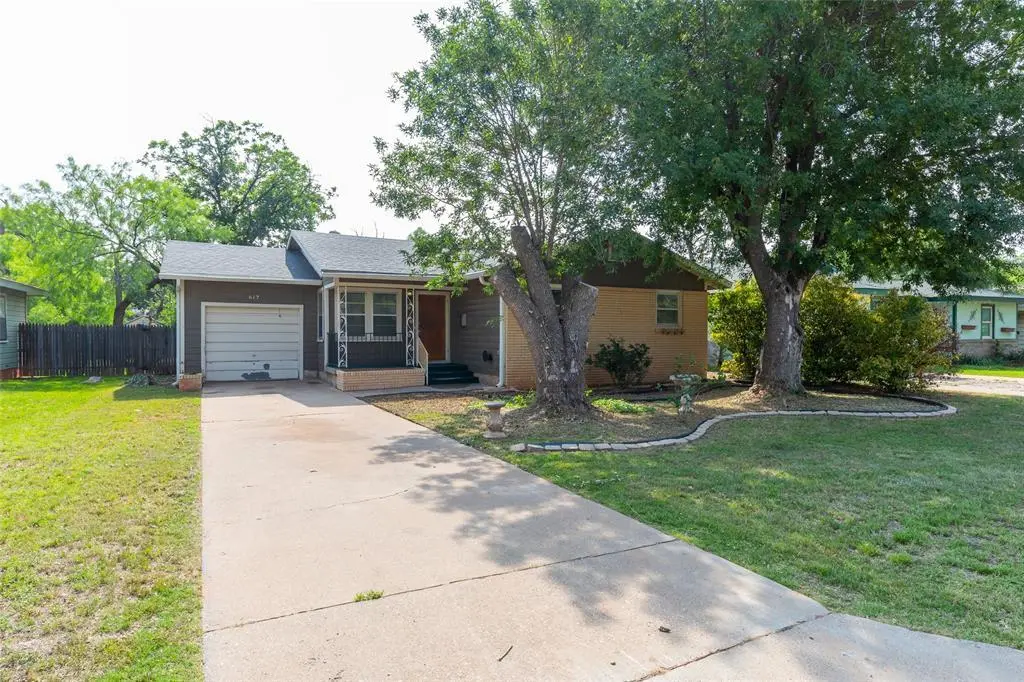
617 Briarwood St · Abilene, TX
Flood risk 1/10 · Minimal
- FEMA flood zone
- X (unshaded)
- Chance of flooding over 30 yrs
- 0.0%
- Est. flood insurance / yr
- $507 – $1,088
Fire risk 3/10 · Minor
- Est. fire insurance / yr
- $1,222 – $2,270
Heat risk 6/10 · Moderate
- Hot days now (above 104°F)
- 7 days/yr
- Hot days in 30 yrs
- 23 days/yr
Wind risk 4/10 · Minor
- Chance of severe wind over 30 yrs
- 10.0%
Air-quality risk 1/10 · Minimal
- Unhealthy air days now
- 0 days/yr
- Unhealthy air days in 30 yrs
- 0 days/yr
Risk factors via First Street. Map © Google.
Why this score? — see what drove the C grade
The composite is a weighted blend of 9 inputs, each scored 0–100. Each bar is that input's sub-score; the figure is the points it added to the 100-point composite (weight × sub-score).
- Cash flow +26.5/30.0
- DSCR +9.0/10.0
- 1% rule +7.1/10.0
- Rent growth +5.0/5.0
- Livability +3.8/5.0
- Schools +2.8/10.0
- Condition / age +2.5/5.0
- ARV discount +2.3/15.0
- Appreciation +0.0/10.0
$170,000
🖨 Deal sheet 📄 Offer letter ✓ Due diligence
Listing remarks MLS
Lovely northside home. Great condition, refrigerator and stove remain. New lines to house, new roof, new hot water heater, new disposal, wood laminate floors. A must see!
Key facts
- Covered deck
- Front porch
- Large yard
Tags
Property features AI
Finance
- Other: Property subtype: Single family residence; Subdivision: Westview Park; Parcel/lot identified in public records
- Financial info: Listing terms include Cash and Conventional
- HOA & community: No association
Exterior
- Parking: Driveway; Covered parking (1 covered space); Attached garage with single 2-car single door configuration (garage faces front)
- Utilities: City water; City sewer; Cable available
- Home design: Single family residence; One story; Residential property
- Construction: Built in 1955; Brick and siding exterior; Composition roof; Pillar/post/pier foundation
- Exterior features: Covered deck; Covered front porch; Fire pit; Gutters; Private yard; Landscaped yard; Large grassy backyard; Wood fencing
Interior
- Kitchen: Electric range
- Bedrooms: 3 bedrooms, all on the main level; Primary bedroom with ensuite bath and walk-in closet; One bedroom with built-in desk
- Flooring: Carpet; Hardwood; Laminate; Tile
- Bathrooms: 1 full bathroom; 1 half bathroom
- Heating & cooling: Central heating (natural gas); Central air; Ceiling fan(s); Electric cooling components
- Interior features: Open floorplan; Decorative lighting; Cable TV available; High-speed internet available; Walk-in closet(s); One living area; One dining area; Room count: 4
- Laundry & utility: Washer hookup; Electric dryer hookup
Neighborhood map
What this means for you Summary
Snapshot
- This is a 3-bed/1.5-bath single-family listed at $170k.
Deal economics
- At list price, monthly cash flow is $449 ($5k/yr) — positive.
- The deal already cash-flows at list — no discount required.
- Meets the 1% rule at list price ($2k rent vs $170k).
- Cap rate 9.5% vs local median 6.7% in Abilene — top-decile yield for the area; either an underpriced asset or a hidden risk that comps aren't pricing in. Stress-test before assuming the spread holds.
Location & tenants
- Location reads 75/100 on livability (#142 in TX, #4,037 nationally) — a middle-class / working-renter tenant base. Strengths: cost of living A+, housing A+, health & safety A+; Watch: schools D+, crime D, commute F.
- Abilene ISD (urban): math 32% / reading 34% proficiency, ranked #575 of 826 in TX (top 70%) — families likely to look elsewhere, expect single-tenant / working-renter base with shorter leases.
- Market conditions: Rents rising fast (+40.2%/yr); 86 active listings in the ZIP; 8 comparable units currently listed for rent nearby; rentals leasing fast (median 13d on market — plan ~1-2 weeks tenant-placement turnaround); 508 units permitted in Taylor County in 2024 (0 in 5+ unit buildings).
- At $2,063/mo this rent would consume 46% of the median local household income ($54k/yr) (locally 662% of renters already pay >50% of income on rent) — very limited rent-growth headroom before tenants either downsize or default.
Forward outlook
- Local home prices are declining (-3.0%/yr); year-one equity from $1k of loan paydown is wiped out by about $5k of value loss. Plan a longer hold.
- Taylor County population projected at +16% by 2050 — long-run rental-demand tailwind backs the buy-and-hold thesis.
- At projected returns (-3.0% appreciation + 8.0% rent growth), your $48k cash investment doubles in ~7 years — after that, you're playing with house money.
Negotiation context
- Only 8 days on market — expect competitive offers; lowballing is unlikely to land.
- 3 sale attempts since 19y ago with the ask held roughly flat each time — persistent listings suggest the price (not the market) is what's stuck; bring a comps-based counter.
Risks & watch-outs
- Watch-outs: built in 1955 — expect roof / HVAC / electrical / plumbing capex.
- Climate carrying-cost: extreme-heat days projected 7→23/yr by 2055 (HVAC capex compounding) — expect insurance premiums to compound above CPI over the hold.
Questions for the listing agent
- Built in 1955 — when were the roof, HVAC, electrical panel, plumbing, and water heater last replaced?
- Is there a deadline driving the sale (1031 exchange, divorce, estate, relocation)? That informs how much negotiation room exists.
- Schools are D-rated, which usually means shorter tenancies and higher turnover. Who's the typical renter profile here, and what's been the actual vacancy rate?
- Crime grade is D in this area — have there been break-ins, vandalism, or insurance claims at this property in the last 3 years? What carrier currently insures it and at what premium?
- What's the average days-on-market for RENTAL listings here right now (not sales)? A rising rental-DOM trend means longer vacancies and softer asking-rent achievability than the comps imply.
- What's the recent tenant-quality profile in this submarket — average credit score on applications, eviction rate, late-payment / NSF rate, and stable-employment percentage? A property-management company in the area should have these aggregated.
- How much new for-sale + rental construction is in the pipeline within 1–3 miles? Heavy new supply typically softens prices + rents 12–24 months out; constrained supply supports both.
Investment metrics
- 1% rule
- 1.21% ✓
- Cap rate
- 9.47%
- Cash-on-cash
- 11.33%
- DSCR
- 1.50
- GRM
- 6.9
CMA / ARV
- ARV (median comp)
- $152,508
- List price
- $170,000
- Delta
- 11.47%
- Verdict
- OVERPRICED
- Comps
- 20 within 1.0 mi
Show comp detail 12 sales within ~0.75 mi
| Address | Dist | Beds/Ba | Sqft | Sold | Price | $/sf | Match |
|---|---|---|---|---|---|---|---|
| 617 Briarwood St | 0.00mi | 3/1.5 | 1,246 (0%) | 0mo | $170,000 | $136 | 100 |
| 650 N Willis St | 0.23mi | 2/1.0 (-1) | 1,157 (-7%) | 3mo | $169,500 | $146 | 68 |
| 3549 N 11th St | 0.59mi | 3/2.0 | 1,236 (-1%) | 3mo | $219,999 | $178 | 67 |
| 1010 Fannin St | 0.42mi | 3/1.0 | 1,344 (+8%) | 0mo | $166,500 | $124 | 65 |
| 849 Green St | 0.41mi | 3/1.0 | 1,134 (-9%) | 1mo | $99,999 | $88 | 63 |
| 3689 N 9th St | 0.61mi | 2/1.5 (-1) | 1,264 (+1%) | 3mo | $156,000 | $123 | 62 |
| 3350 S 4th St | 0.68mi | 3/1.0 | 1,164 (-7%) | 1mo | $80,000 | $69 | 54 |
| 941 Westmoreland St | 0.57mi | 3/2.0 | 1,080 (-13%) | 1mo | $129,900 | $120 | 48 |
| 2241 State St | 0.70mi | 2/2.0 (-1) | 1,162 (-7%) | 2mo | $64,900 | $56 | 47 |
| 3349 S 3rd St | 0.65mi | 2/2.0 (-1) | 1,136 (-9%) | 1mo | $170,500 | $150 | 47 |
| 2116 Parramore St | 0.72mi | 3/1.0 | 1,384 (+11%) | 1mo | $145,000 | $105 | 45 |
| 3109 S 5th St | 0.73mi | 3/2.0 | 1,072 (-14%) | 1mo | $165,000 | $154 | 40 |
Match score weights: distance 35% · size 25% · config 20% · recency 20%. Top-matched comps best support the ARV.
Projected returns pro-forma
-3.0% appreciation · 8.0% rent growth · sell at horizon
- IRR
- 6.1%
- Equity multiple
- 1.25×
- Total profit
- $12,010
- Equity at exit
- $25,348
- IRR
- 19.6%
- Equity multiple
- 3.04×
- Total profit
- $97,065
- Equity at exit
- $14,698
Cash invested: $47,600 (down + closing). Projections, not guarantees.
Landlord ↔ Tenant lean methodology
- Overall (STATE)
- 87 Strongly Landlord-Friendly
- State Texas
- 87 Strongly Landlord-Friendly · R+5
- County
- — inherits STATE
- City
- — inherits STATE
ZIP-level market 79603
- Home prices YoY
- -32.5%
- Rents YoY
- 40.2%
- Active inventory
- 86
- Price-to-rent
- 6.9×
Monthly cashflow live
- Estimated rent
- $2,063 high interval (Pro) →
- Mortgage (P&I)
- −$891
- Tax from tax record
- −$218 /mo · $2,613/yr
- Insurance
- −$71
- HOA
- −$0
- Vacancy / Maint / Mgmt
- −$433
- Net cashflow
- $449
Break-even live
UW: 25.0% down · 7.5% · 30yr · 1.5% tax · 5.0% vac · 8.0% maint · 8.0% mgmt
Financing live
Cash to close
- Down payment
- $42,500
- Closing costs
- $5,100
- Reserves months
- —
- Total cash needed
- —
Loan-product check · same deal, 3 products live
Conventional
25% down · 7.5% · 30yr
- Down + closing
- —
- Monthly P&I
- —
- Monthly cashflow
- —
- DSCR
- —
- Eligible?
- —
Personal DTI + credit; lowest rate.
DSCR
20% down · 8.5% · 30yr
- Down + closing
- —
- Monthly P&I
- —
- Monthly cashflow
- —
- DSCR
- —
- Eligible?
- —
No personal income docs; deal must DSCR.
Hard money
10% down · 12.0% · 12mo
- Down + closing
- —
- Monthly P&I
- —
- Monthly cashflow
- —
- DSCR
- —
- Eligible?
- —
Short-term bridge; refi at stabilization.
Rent comps 8 comps
| Address | Beds | Baths | Sqft | Rent | $/sqft | DOM | Units | Dist |
|---|---|---|---|---|---|---|---|---|
| 234 Clyde St Abilene, TX | 3.0 | 1.0 | 998 | $1,995 | $2.00 | 13d | 1 | 0.61mi |
| 2850 S 5th St Abilene, TX | 4.0 | 2.0 | 1175 | $1,995 | $1.70 | 13d | 1 | 0.71mi |
| 1481 Burger St Abilene, TX | 3.0 | 2.0 | 1330 | $2,400 | $1.80 | 21d | 1 | 0.80mi |
| 1685 N Willis St Abilene, TX | 3.0 | 2.0 | 1349 | $1,800 | $1.33 | 21d | 1 | 0.97mi |
| 417 Meander St Abilene, TX | 3.0 | 2.0 | 872 | $1,814 | $2.08 | 13d | 1 | 1.16mi |
| 889 Ross Ave Abilene, TX | 2.0 | 1.0 | 1223 | $1,700 | $1.39 | 21d | 1 | 1.22mi |
| 3296 Sandefer St Abilene, TX | 4.0 | 1.0 | 1360 | $1,950 | $1.43 | 13d | 1 | 1.35mi |
| 1638 Merchant St Abilene, TX | 3.0 | 2.0 | 1328 | $2,895 | $2.18 | 13d | 1 | 1.36mi |
Listing history 10 events
-
2026-05-08status Pending 838-char remark
-
2026-04-29$170,000 Active 838-char remark
-
2012-06-26soldstatus
-
2012-06-19soldstatus 170-char remark
Show marketing remark (170 chars)
Lovely northside home. Great condition, refrigerator and stove remain. New lines to house, new roof, new hot water heater, new disposal, wood laminate floors. A must see!
-
2012-05-10historical 170-char remark
Show marketing remark (170 chars)
Lovely northside home. Great condition, refrigerator and stove remain. New lines to house, new roof, new hot water heater, new disposal, wood laminate floors. A must see!
-
2012-02-28$79,900 170-char remark
Show marketing remark (170 chars)
Lovely northside home. Great condition, refrigerator and stove remain. New lines to house, new roof, new hot water heater, new disposal, wood laminate floors. A must see!
-
2007-08-08soldstatus
-
2007-08-06soldstatus
Show marketing remark (118 chars)
THIS HOUSE IS IMMACULATE & READY FOR MOVE-IN ALL ELECTRICAL WIRING & PLUMBING UPDATE $2000 PAINT ALLOWANCE
-
2007-07-09historical
Show marketing remark (118 chars)
THIS HOUSE IS IMMACULATE & READY FOR MOVE-IN ALL ELECTRICAL WIRING & PLUMBING UPDATE $2000 PAINT ALLOWANCE
-
2007-03-19$81,000
Show marketing remark (118 chars)
THIS HOUSE IS IMMACULATE & READY FOR MOVE-IN ALL ELECTRICAL WIRING & PLUMBING UPDATE $2000 PAINT ALLOWANCE
ⓘ Source: listings_history table (triggers on properties + properties_extension) + one-shot
backfill from property_details.listing_events for pre-trigger history.
Tax reassessment forecast TX · Resets to sale price
- Current annual tax
- $2,613 · $218/mo
- Projected year-2 tax
- $3,111 · $259/mo
- Expected delta
- +$498/yr (+$42/mo · 19.1%)
ⓘ Screening estimate from a state-policy table — verify with the county assessor before closing.
Climate risk First Street
- Flood 1/10 Low FEMA zone X (unshaded) · 0% chance over 30 yrs
- Wildfire 3/10 Moderate
- Heat 6/10 Major 7 d/yr ≥104°F today · 23 d/yr by 30 yrs out
- Wind 4/10 Moderate 10% chance of damaging wind over 30 yrs
- Air quality 1/10 Low 0 unhealthy d/yr today · 0 by 30 yrs out
Nearby sold comps map
Loading sold comps map…
Walkable amenities ~0.75 mi
Loading nearby amenities…
Taxation est. · year 1
- Rental income
- $24,751
- − Mortgage interest
- −$9,523
- − Property taxes
- −$2,613
- − Insurance
- −$850
- − Repairs & maintenance
- −$1,980
- − Management
- −$1,980
- − Depreciation
- −$4,945
- Taxable income
- $2,860
- Est. tax owed @ 24.0%
- −$686
- After-tax cash flow
- $4,706/yr
For passive investors: Depreciation is non-cash, so a rental often shows a tax loss while cash-flowing — sheltering income. Rental losses are passive: they offset passive income freely, and up to $25,000/yr can offset ordinary (W-2) income if you actively participate and your MAGI is under $100k (phasing out to $0 by $150k); unused losses carry forward. On sale, claimed depreciation is recaptured at up to 25%, and gains may owe capital-gains tax (a 1031 exchange can defer both). Figures are a year-1 estimate at your 24.0% rate — not tax advice; consult a CPA.
Schools (NCES district)
- District
- Abilene ISD
- NCES district ID
- 4807440
- Math proficiency
- 32% ▼ -11.00%
- Reading proficiency
- 34% ▼ -5.00%
- Median HH income
- $39,782
- Composite
- 27.71/100
- National rank
- #6909
- State rank
- #575 of 826 in TX
Livability — Abilene
- Score
- 75/100
- State rank
- #142
- US rank
- #4037
Category grades
Schools grade is shown separately in the Schools card above.
Census & demographics
- Census place
- Abilene, TX
- County
- Taylor County · 136,672 people
- City population
- 136,672
- Metro
- Abilene, TX
- Population (ZIP)
- 23,548
- Household income
- $53,513
- Rent vs Own
- Severe rent burden
- 662.0
Population outlook (Taylor County) Hauer SSP2
- Today (2025)
- 145,270 people
- By 2030
- 150,050 · +3.3%
- By 2040
- 159,417 · +9.7%
- By 2050
- 168,883 · +16.3%
- By 2075
- 194,436 · +33.8%
- By 2100
- 203,163 · +39.9%
Race, ethnicity, and origin ACS 2023
- Neighborhood character
- Diverse neighborhood (Simpson 0.60)
- Race & ethnicity
- Hispanic / Latino 48% White 40% Two or more races 24% Black 8%
- Hispanic origin (detail)
- Mexican 44%
- Common ancestry
- Italian 2% Slovak 2% Portuguese 1%
- Foreign-born
- 9% · Canada
- Languages at home
- 73% English-only · Spanish 25%
Political lean MEDSL · Taylor
- 2024 margin
- Solid R (+49.8) · D 24.6% · R 74.4% · Other 1.0%
- 2008→2024 swing
- -4.2pp toward R · 2008: -45.6pp · 2024: -49.8pp
- All cycles
- 2024: R+49.8 2020: R+45.3 2016: R+51.1 2012: R+53.6 2008: R+45.6
Not yet ingested
- Civics
- —
Market trends
- HPI YoY
- ▼ -88.84%
- Current HPI
- 184.8875
- Rent YoY
- ▲ 40.19%
- Metro
- Abilene, TX
- State GDP YoY
- ▲ 3.95%
- F500 in state
- 110
Industry mix (Fortune 500 HQ in TX)
| Industry | F500 HQs | Revenue |
|---|---|---|
| Energy | 16 | $1,198B |
|
||
| Technology | 5 | $198B |
|
||
| Engineering / Construction | 4 | $72B |
|
||
| Energy Services | 3 | $60B |
|
||
| Utilities | 3 | $41B |
|
||
| Healthcare | 2 | $330B |
|
||
Price history
+109.9% since first listed11 events — show timeline
- 2026-06-08 Sold (MLS) — NTREIS
- 2026-05-08 Pending — NTREIS
- 2026-04-29 Listed $170,000 NTREIS
- 2012-06-26 Sold (Public Records) — Public Records
- 2012-06-19 Sold (MLS) — NTREIS
- 2012-05-10 Listing Removed — NTREIS
- 2012-02-28 Listed $79,900 NTREIS
- 2007-08-08 Sold (Public Records) — Public Records
- 2007-08-06 Sold (MLS) — NTREIS
- 2007-07-09 Listing Removed — NTREIS
- 2007-03-19 Listed $81,000 NTREIS
Property tax history
+3.1%/yrLatest (2025): $2,613 · +8.3% YoY. Source: county tax records.
Cash-flow waterfall
monthlySold comps — $/sqft
last 12 mo · ≤1 miLoading sold comps…