 🏷️ Likely Rental
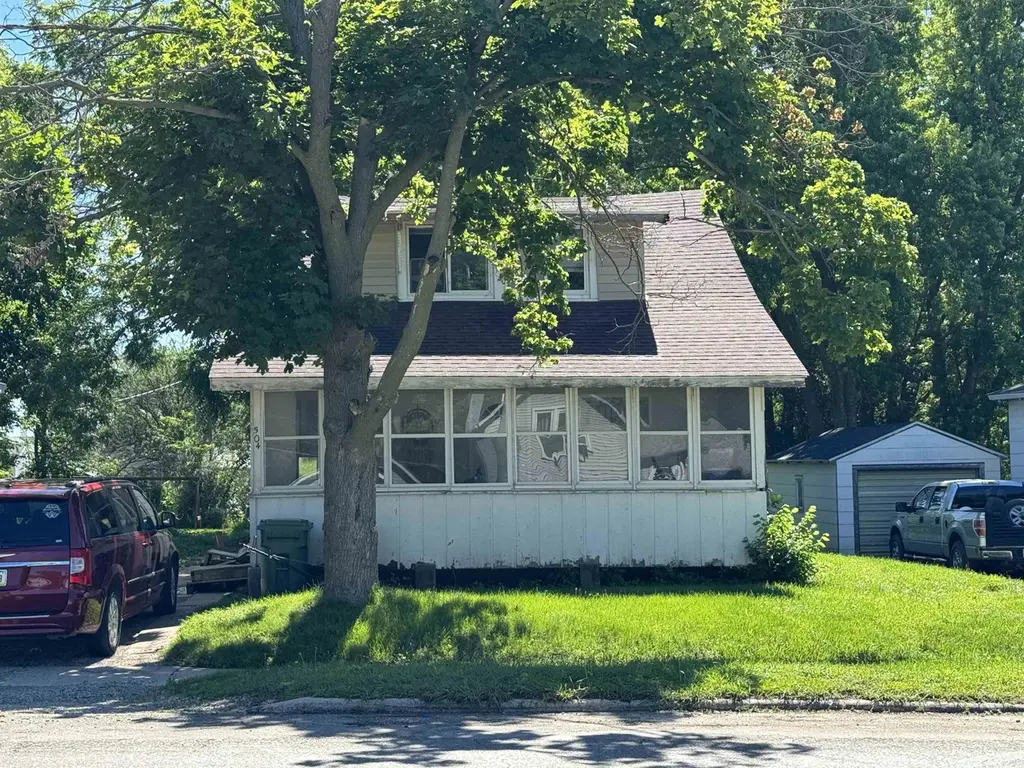
504 S Main St · Charles City, IA
Flood risk 1/10 · Minimal
- FEMA flood zone
- X (unshaded)
- Chance of flooding over 30 yrs
- 0.0%
- Est. flood insurance / yr
- $473 – $860
Fire risk 3/10 · Minor
- Est. fire insurance / yr
- $902 – $1,676
Heat risk 2/10 · Minimal
- Hot days now (above 103°F)
- 7 days/yr
- Hot days in 30 yrs
- 16 days/yr
Wind risk 2/10 · Minimal
- Chance of severe wind over 30 yrs
- —
Air-quality risk 1/10 · Minimal
- Unhealthy air days now
- 0 days/yr
- Unhealthy air days in 30 yrs
- 0 days/yr
Risk factors via First Street. Map © Google.
Why this score? — see what drove the B grade
The composite is a weighted blend of 9 inputs, each scored 0–100. Each bar is that input's sub-score; the figure is the points it added to the 100-point composite (weight × sub-score).
- Cash flow +30.0/30.0
- 1% rule +10.0/10.0
- DSCR +10.0/10.0
- ARV discount +7.5/15.0
- Schools +4.7/10.0
- Livability +3.9/5.0
- Rent growth +2.5/5.0
- Condition / age +2.5/5.0
- Appreciation +0.0/10.0
$59,000
🖨 Deal sheet 📄 Offer letter ✓ Due diligence
Listing remarks MLS
This 2 story, 4 bedroom, 2 bathroom home has a main floor laundry, large living room and dining room. The renter pays $970 per month and the tenant pays all of the utilities. Annual taxes: $602.
Key facts
- 8,850 sq ft lot
- Built 1920
- Listed 206 days
Neighborhood map
What this means for you Summary
Snapshot
- This is a 4-bed/2.0-bath single-family listed at $59k.
Deal economics
- At list price, monthly cash flow is $769 ($9k/yr) — positive.
- The deal already cash-flows at list — no discount required.
- Meets the 1% rule at list price ($1k rent vs $59k).
- Recommended offer: $52k (12.0% below list) — sets the bar for market timing.
- Cap rate 21.9% vs local median 6.5% in Charles City — top-decile yield for the area; either an underpriced asset or a hidden risk that comps aren't pricing in. Stress-test before assuming the spread holds.
Location & tenants
- Location reads 77/100 on livability (#161 in IA, #2,944 nationally) — a middle-class / working-renter tenant base. Strengths: cost of living A+, health & safety A+, housing A; Watch: amenities F, commute F, employment F.
- Charles City Community School District (town): math 52% / reading 61% proficiency, ranked #262 of 289 in IA (top 91%) — acceptable for families but not a draw, mixed tenant base, ~2y average lease.
- Market conditions: 70 active listings in the ZIP; 2 comparable units currently listed for rent nearby; 38 units permitted in Floyd County in 2024 (0 in 5+ unit buildings).
Forward outlook
- Local home prices are declining (-3.0%/yr); year-one equity from $408 of loan paydown is wiped out by about $2k of value loss. Plan a longer hold.
- Floyd County population projected to shrink 6% by 2050 — rents likely to lag national; underwrite the cash flow, not the appreciation.
- At projected returns (-3.0% appreciation + 3.0% rent growth), your $17k cash investment doubles in ~3 years — after that, you're playing with house money.
Negotiation context
- It's been on market 206 days — a 12% lower offer ($52k) is reasonable based on typical stale-listing flexibility.
Risks & watch-outs
- Watch-outs: built in 1920 — expect roof / HVAC / electrical / plumbing capex.
Questions for the listing agent
- It's been on market 206 days. Have you received any prior offers? Is the seller open to a 12% concession, seller financing, or rate buy-down credit?
- Built in 1920 — when were the roof, HVAC, electrical panel, plumbing, and water heater last replaced?
- Why hasn't it sold? Are there any deal-killer items the seller is aware of (foundation, flood, title, zoning, code violations)?
- Is there a deadline driving the sale (1031 exchange, divorce, estate, relocation)? That informs how much negotiation room exists.
- What's the average days-on-market for RENTAL listings here right now (not sales)? A rising rental-DOM trend means longer vacancies and softer asking-rent achievability than the comps imply.
- What's the recent tenant-quality profile in this submarket — average credit score on applications, eviction rate, late-payment / NSF rate, and stable-employment percentage? A property-management company in the area should have these aggregated.
- How much new for-sale + rental construction is in the pipeline within 1–3 miles? Heavy new supply typically softens prices + rents 12–24 months out; constrained supply supports both.
Investment metrics
- 1% rule
- 2.47% ✓
- Cap rate
- 21.93%
- Cash-on-cash
- 55.84%
- DSCR
- 3.48
- GRM
- 3.4
CMA / ARV
- ARV (median comp)
- $129,138
- List price
- $59,000
- Delta
- -54.31%
- Verdict
- UNDERPRICED
- Comps
- 20 within 1.0 mi
Show comp detail 12 sales within ~0.75 mi
| Address | Dist | Beds/Ba | Sqft | Sold | Price | $/sf | Match |
|---|---|---|---|---|---|---|---|
| 510 S Jackson St | 0.07mi | 3/1.5 (-1) | 1,334 (-4%) | 6mo | $155,000 | $116 | 78 |
| 812 8th St | 0.39mi | 3/2.0 (-1) | 1,391 (+0%) | 8mo | $140,000 | $101 | 70 |
| 600 Freeman St | 0.31mi | 3/2.0 (-1) | 1,540 (+11%) | 8mo | $142,500 | $93 | 56 |
| 1007 Cedar St | 0.36mi | 3/1.5 (-1) | 1,508 (+9%) | 8mo | $129,000 | $86 | 56 |
| 800 8th Street St | 0.37mi | 3/2.0 (-1) | 1,302 (-6%) | 14mo | $125,000 | $96 | 55 |
| 1107 Hildreth St | 0.45mi | 3/3.0 (-1) | 1,322 (-5%) | 10mo | $122,500 | $93 | 54 |
| 301 S Joslin St | 0.32mi | 3/2.0 (-1) | 1,456 (+5%) | 22mo | $165,000 | $113 | 54 |
| 1204 Grove St | 0.34mi | 3/2.0 (-1) | 1,456 (+5%) | 22mo | $130,000 | $89 | 53 |
| 903 S Johnson St | 0.29mi | 3/1.0 (-1) | 1,536 (+11%) | 11mo | $107,500 | $70 | 50 |
| 1207 Gilbert St | 0.39mi | 5/1.0 (+1) | 1,576 (+14%) | 9mo | $63,450 | $40 | 43 |
| 1000 S Main St | 0.31mi | 3/1.0 (-1) | 1,192 (-14%) | 21mo | $75,000 | $63 | 35 |
| 109 Hillside Drive Dr | 0.66mi | 3/2.0 (-1) | 1,592 (+15%) | 20mo | $141,625 | $89 | 23 |
Match score weights: distance 35% · size 25% · config 20% · recency 20%. Top-matched comps best support the ARV.
Projected returns pro-forma
-3.0% appreciation · 3.0% rent growth · sell at horizon
- IRR
- 54.2%
- Equity multiple
- 3.39×
- Total profit
- $39,405
- Equity at exit
- $8,797
- IRR
- 59.3%
- Equity multiple
- 6.89×
- Total profit
- $97,384
- Equity at exit
- $5,101
Cash invested: $16,520 (down + closing). Projections, not guarantees.
Landlord ↔ Tenant lean methodology
- Overall (STATE)
- 83 Strongly Landlord-Friendly
- State Iowa
- 83 Strongly Landlord-Friendly · R+6
- County
- — inherits STATE
- City
- — inherits STATE
ZIP-level market 50616
- Home prices YoY
- -19.7%
- Active inventory
- 70
- Price-to-rent
- 3.4×
Monthly cashflow live
- Estimated rent
- $1,459 medium interval (Pro) →
- Mortgage (P&I)
- −$309
- Tax from tax record
- −$50 /mo · $602/yr
- Insurance
- −$25
- HOA
- −$0
- Vacancy / Maint / Mgmt
- −$306
- Net cashflow
- $769
Break-even live
UW: 25.0% down · 7.5% · 30yr · 1.5% tax · 5.0% vac · 8.0% maint · 8.0% mgmt
Financing live
Cash to close
- Down payment
- $14,750
- Closing costs
- $1,770
- Reserves months
- —
- Total cash needed
- —
Loan-product check · same deal, 3 products live
Conventional
25% down · 7.5% · 30yr
- Down + closing
- —
- Monthly P&I
- —
- Monthly cashflow
- —
- DSCR
- —
- Eligible?
- —
Personal DTI + credit; lowest rate.
DSCR
20% down · 8.5% · 30yr
- Down + closing
- —
- Monthly P&I
- —
- Monthly cashflow
- —
- DSCR
- —
- Eligible?
- —
No personal income docs; deal must DSCR.
Hard money
10% down · 12.0% · 12mo
- Down + closing
- —
- Monthly P&I
- —
- Monthly cashflow
- —
- DSCR
- —
- Eligible?
- —
Short-term bridge; refi at stabilization.
Rent comps 2 comps
| Address | Beds | Baths | Sqft | Rent | $/sqft | DOM | Units | Dist |
|---|---|---|---|---|---|---|---|---|
| 1030 13th Ave Charles City, IA | 1.0–3.0 | 1.0–2.0 | 926 | $1,927 | $2.08 | 44d | 28 | 1.35mi |
| 1004 20th Ave Charles City, IA | 3.0 | 2.0 | 960 | $975 | $1.02 | 23d | 1 | 1.44mi |
Listing history 16 events
-
2026-06-18days on market $59,000 Active 206 DOM
-
2026-06-17days on market $59,000 Active 205 DOM
-
2026-06-16days on market $59,000 Active 204 DOM
-
2026-06-15days on market $59,000 Active 203 DOM
-
2026-06-13days on market $59,000 Active 201 DOM
-
2026-06-12days on market $59,000 Active 200 DOM
-
2026-06-09days on market $59,000 Active 197 DOM
-
2026-06-08days on market $59,000 Active 196 DOM
-
2026-06-07days on market $59,000 Active 195 DOM
-
2026-06-07days on market $59,000 Active 194 DOM
-
2026-06-04days on market $59,000 Active 191 DOM
-
2026-06-02days on market $59,000 Active 190 DOM
-
2026-06-01days on market $59,000 Active 189 DOM
-
2026-05-31days on market $59,000 Active 188 DOM
-
2026-05-31days on market $59,000 Active 187 DOM
-
2025-11-22$59,000 Active 194-char remark
Show marketing remark (194 chars)
This 2 story, 4 bedroom, 2 bathroom home has a main floor laundry, large living room and dining room. The renter pays $970 per month and the tenant pays all of the utilities. Annual taxes: $602.
ⓘ Source: listings_history table (triggers on properties + properties_extension) + one-shot
backfill from property_details.listing_events for pre-trigger history.
Tax reassessment forecast IA · Partial reset (capped growth)
- Current annual tax
- $602 · $50/mo
- Projected year-2 tax
- $764 · $64/mo
- Expected delta
- +$162/yr (+$14/mo · 26.9%)
ⓘ Screening estimate from a state-policy table — verify with the county assessor before closing.
Climate risk First Street
- Flood 1/10 Low FEMA zone X (unshaded) · 0% chance over 30 yrs
- Wildfire 3/10 Moderate
- Heat 2/10 Low 7 d/yr ≥103°F today · 16 d/yr by 30 yrs out
- Wind 2/10 Low
- Air quality 1/10 Low 0 unhealthy d/yr today · 0 by 30 yrs out
Nearby sold comps map
Loading sold comps map…
Walkable amenities ~0.75 mi
Loading nearby amenities…
Taxation est. · year 1
- Rental income
- $17,511
- − Mortgage interest
- −$3,305
- − Property taxes
- −$602
- − Insurance
- −$295
- − Repairs & maintenance
- −$1,401
- − Management
- −$1,401
- − Depreciation
- −$1,716
- Taxable income
- $8,791
- Est. tax owed @ 24.0%
- −$2,110
- After-tax cash flow
- $7,114/yr
For passive investors: Depreciation is non-cash, so a rental often shows a tax loss while cash-flowing — sheltering income. Rental losses are passive: they offset passive income freely, and up to $25,000/yr can offset ordinary (W-2) income if you actively participate and your MAGI is under $100k (phasing out to $0 by $150k); unused losses carry forward. On sale, claimed depreciation is recaptured at up to 25%, and gains may owe capital-gains tax (a 1031 exchange can defer both). Figures are a year-1 estimate at your 24.0% rate — not tax advice; consult a CPA.
Schools (NCES district)
- District
- Charles City Community School District
- NCES district ID
- 1907080
- Math proficiency
- 52% ▼ -3.00%
- Reading proficiency
- 61% ▲ 9.00%
- Median HH income
- $41,414
- Composite
- 47.32/100
- National rank
- #2299
- State rank
- #262 of 289 in IA
Livability — Charles City
- Score
- 77/100
- State rank
- #161
- US rank
- #2944
Category grades
Schools grade is shown separately in the Schools card above.
Census & demographics
- Census place
- Charles City, IA
- City population
- 9,419
- Population (ZIP)
- 9,419
Population outlook (Floyd County) Hauer SSP2
- Today (2025)
- 15,524 people
- By 2030
- 15,254 · -1.7%
- By 2040
- 14,830 · -4.5%
- By 2050
- 14,660 · -5.6%
- By 2075
- 15,548 · +0.2%
- By 2100
- 17,406 · +12.1%
Race, ethnicity, and origin ACS 2023
- Neighborhood character
- Predominantly White (87%)
- Race & ethnicity
- White 87% Two or more races 6% Hispanic / Latino 5% Asian 2% Black 2%
- Hispanic origin (detail)
- Mexican 4%
- Common ancestry
- Portuguese 6% Scandinavian 2% Lithuanian 2%
- Foreign-born
- 5% · Canada
- Languages at home
- 94% English-only · Spanish 2% Other Asian/Pacific 1% Tagalog/Filipino 1%
Political lean MEDSL · Floyd
- 2024 margin
- Strong R (+25.7) · D 36.5% · R 62.2% · Other 1.3%
- 2008→2024 swing
- -47.6pp toward R · 2008: 21.9pp · 2024: -25.7pp
- All cycles
- 2024: R+25.7 2020: R+19.4 2016: R+14.9 2012: D+14.7 2008: D+21.9
Not yet ingested
- Civics
- —
Market trends
- HPI YoY
- ▼ -46.03%
- Current HPI
- 187.4742
- Rent YoY
- —
- Metro
- —
- State GDP YoY
- ▲ 2.48%
- F500 in state
- 4
Industry mix (Fortune 500 HQ in IA)
| Industry | F500 HQs | Revenue |
|---|---|---|
| Financial Services | 1 | $16B |
|
||
| Retail / Convenience | 1 | $15B |
|
||
Price history
1 event — show timeline
- 2025-11-22 Listed $59,000 NEIRBR as distributed by MLS GRID
Property tax history
+6.5%/yrLatest (2025): $602 · +0.3% YoY. Source: county tax records.
Cash-flow waterfall
monthlySold comps — $/sqft
last 12 mo · ≤1 miLoading sold comps…