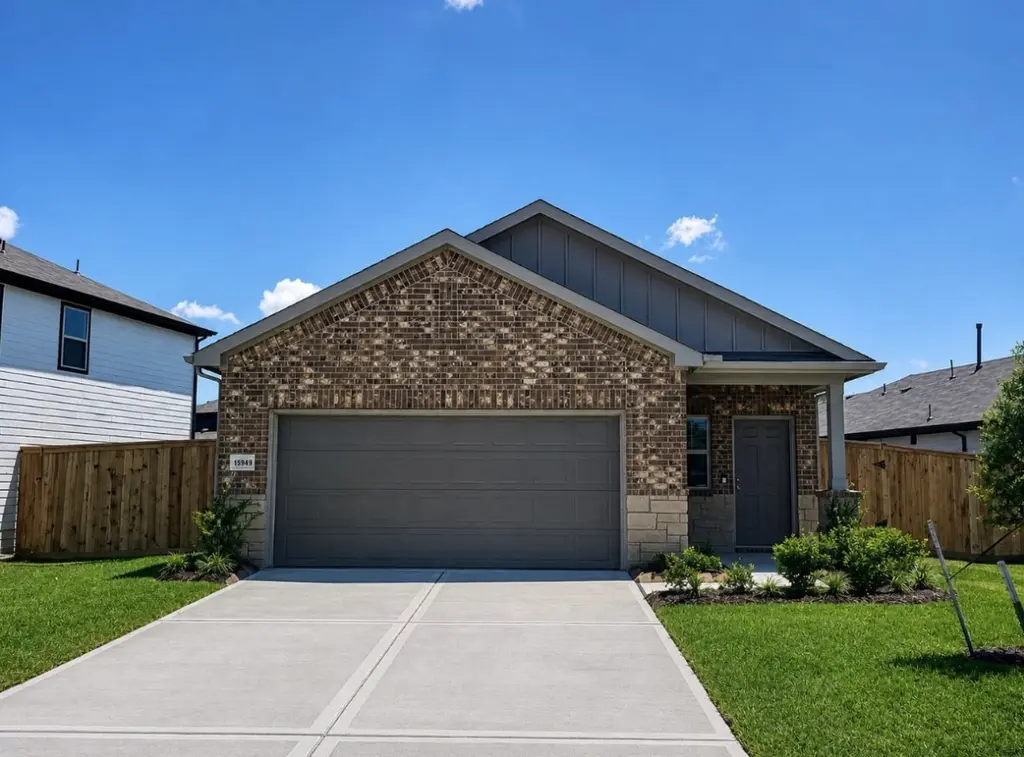
15949 Blass Valley Dr · Grangerland, TX
Flood risk No data
- FEMA flood zone
- —
- Chance of flooding over 30 yrs
- —
- Est. flood insurance / yr
- —
Fire risk No data
- Est. fire insurance / yr
- —
Heat risk No data
- Hot days now (above threshold)
- —
- Hot days in 30 yrs
- —
Wind risk No data
- Chance of severe wind over 30 yrs
- —
Air-quality risk No data
- Unhealthy air days now
- —
- Unhealthy air days in 30 yrs
- —
Risk factors via First Street. Map © Google.
Why this score? — see what drove the C+ grade
The composite is a weighted blend of 9 inputs, each scored 0–100. Each bar is that input's sub-score; the figure is the points it added to the 100-point composite (weight × sub-score).
- Cash flow +20.1/30.0
- ARV discount +13.0/15.0
- DSCR +6.4/10.0
- 1% rule +5.7/10.0
- Schools +5.1/10.0
- Condition / age +4.0/5.0
- Rent growth +3.3/5.0
- Livability +2.5/5.0
- Appreciation +0.0/10.0
$254,587
🖨 Deal sheet 📄 Offer letter ✓ Due diligence
Listing remarks MLS
Contact Sales for Details
Key facts
- Spacious great room
- Granite countertops
- Open kitchen
Tags
Neighborhood map
What this means for you Summary
Snapshot
- This is a 4-bed/2.0-bath single-family listed at $255k. Condition is rated good.
Deal economics
- At list price, monthly cash flow is $319 ($4k/yr) — positive.
- The deal already cash-flows at list — no discount required.
- Meets the 1% rule at list price ($3k rent vs $255k).
- Recommended offer: $239k (6.0% below list) — sets the bar for market timing.
- Cap rate 7.8% vs local median 5.1% in Grangerland — top-decile yield for the area; either an underpriced asset or a hidden risk that comps aren't pricing in. Stress-test before assuming the spread holds.
Location & tenants
- Location reads: area grade C — affects rentability + tenant quality, not the cash-flow math above.
- Conroe ISD (other): math 57% / reading 57% proficiency, ranked #69 of 826 in TX (top 8%) — acceptable for families but not a draw, mixed tenant base, ~2y average lease.
- Market conditions: Rents rising (+3.3%/yr); 1111 active listings in the ZIP; 3 comparable units currently listed for rent nearby; rentals lingering (median 44d on market — plan ~5-8 weeks vacancy on turnover, expect pricing pressure); 67% of comp listings sitting > 30 days — soft ceiling on asking rent; solid renter incomes; 13,259 units permitted in Montgomery County in 2024 (1,402 in 5+ unit buildings).
- This rent runs 39% of the median local income ($85k/yr) — at the standard rent-burdened threshold; future hikes will face affordability resistance.
Forward outlook
- Local home prices are declining (-3.0%/yr); year-one equity from $2k of loan paydown is wiped out by about $8k of value loss. Plan a longer hold.
- Montgomery County population projected at +65% by 2050 — long-run rental-demand tailwind backs the buy-and-hold thesis.
Negotiation context
- It's been on market 69 days — a 6% lower offer ($239k) is reasonable based on typical stale-listing flexibility.
- 2 sale attempts; this cycle's ask has dropped $29k (10%) from the opening price — seller is motivated, your offer sets the floor, not the list.
Questions for the listing agent
- It's been on market 69 days. Have you received any prior offers? Is the seller open to a 6% concession, seller financing, or rate buy-down credit?
- What does the HOA fee cover, when was the last increase, and are there any pending special assessments or reserve-fund shortfalls?
- Why hasn't it sold? Are there any deal-killer items the seller is aware of (foundation, flood, title, zoning, code violations)?
- Is there a deadline driving the sale (1031 exchange, divorce, estate, relocation)? That informs how much negotiation room exists.
- What's the average days-on-market for RENTAL listings here right now (not sales)? A rising rental-DOM trend means longer vacancies and softer asking-rent achievability than the comps imply.
- What's the recent tenant-quality profile in this submarket — average credit score on applications, eviction rate, late-payment / NSF rate, and stable-employment percentage? A property-management company in the area should have these aggregated.
- How much new for-sale + rental construction is in the pipeline within 1–3 miles? Heavy new supply typically softens prices + rents 12–24 months out; constrained supply supports both.
Investment metrics
- 1% rule
- 1.07% ✓
- Cap rate
- 7.80%
- Cash-on-cash
- 5.37%
- DSCR
- 1.24
- GRM
- 7.8
CMA / ARV
- ARV (median comp)
- $290,209
- List price
- $254,587
- Delta
- -12.27%
- Verdict
- UNDERPRICED
- Comps
- 20 within 1.0 mi
Show comp detail 12 sales within ~0.75 mi
| Address | Dist | Beds/Ba | Sqft | Sold | Price | $/sf | Match |
|---|---|---|---|---|---|---|---|
| 15980 Blass Valley Dr | 0.10mi | 4/2.0 | 1,777 (0%) | 2mo | $274,790 | $155 | 94 |
| 15985 Blass Valley Dr | 0.03mi | 4/2.5 | 1,850 (+4%) | 1mo | $287,320 | $155 | 88 |
| 15018 English Rose Rd | 0.03mi | 4/2.5 | 1,850 (+4%) | 2mo | $276,730 | $150 | 88 |
| 15385 Dapple Bluff Ln | 0.14mi | 4/2.0 | 1,937 (+9%) | 1mo | $294,910 | $152 | 77 |
| 14985 Rustic Moon Rd | 0.34mi | 4/2.0 | 1,689 (-5%) | 1mo | $264,050 | $156 | 75 |
| 15019 Rustic Moon Rd | 0.32mi | 4/2.0 | 1,924 (+8%) | 1mo | $314,860 | $164 | 71 |
| 15969 Blass Valley Dr | 0.03mi | 4/3.0 | 2,036 (+15%) | 0mo | $279,540 | $137 | 70 |
| 15187 Wild Gully Way | 0.05mi | 4/3.0 | 2,028 (+14%) | 2mo | $355,880 | $175 | 69 |
| 14973 Rustic Moon Rd | 0.36mi | 4/2.0 | 1,924 (+8%) | 2mo | $289,648 | $151 | 68 |
| 15965 Blass Valley Dr | 0.05mi | 3/2.0 (-1) | 1,512 (-15%) | 2mo | $273,480 | $181 | 66 |
| 16280 Sun View Ln | 0.38mi | 4/2.0 | 1,550 (-13%) | 2mo | $200,000 | $129 | 59 |
| 15632 Boulder Lake Ln | 0.49mi | 4/3.0 | 2,028 (+14%) | 2mo | $338,180 | $167 | 48 |
Match score weights: distance 35% · size 25% · config 20% · recency 20%. Top-matched comps best support the ARV.
Projected returns pro-forma
-3.0% appreciation · 3.3% rent growth · sell at horizon
- IRR
- -7.6%
- Equity multiple
- 0.72×
- Total profit
- $-20,028
- Equity at exit
- $37,960
- IRR
- 2.4%
- Equity multiple
- 1.18×
- Total profit
- $12,492
- Equity at exit
- $22,012
Cash invested: $71,284 (down + closing). Projections, not guarantees.
Landlord ↔ Tenant lean methodology
- Overall (STATE)
- 87 Strongly Landlord-Friendly
- State Texas
- 87 Strongly Landlord-Friendly · R+5
- County
- — inherits STATE
- City
- — inherits STATE
ZIP-level market 77302
- Rents YoY
- 3.3%
- Active inventory
- 1111
- Price-to-rent
- 7.8×
Monthly cashflow live
- Estimated rent
- $2,732 medium interval (Pro) →
- Mortgage (P&I)
- −$1,335
- Tax est. 1.5%
- −$318 /mo · $3,819/yr
- Insurance
- −$106
- HOA
- −$80
- Vacancy / Maint / Mgmt
- −$574
- Net cashflow
- $319
Break-even live
UW: 25.0% down · 7.5% · 30yr · 1.5% tax · 5.0% vac · 8.0% maint · 8.0% mgmt
Financing live
Cash to close
- Down payment
- $63,647
- Closing costs
- $7,638
- Reserves months
- —
- Total cash needed
- —
Loan-product check · same deal, 3 products live
Conventional
25% down · 7.5% · 30yr
- Down + closing
- —
- Monthly P&I
- —
- Monthly cashflow
- —
- DSCR
- —
- Eligible?
- —
Personal DTI + credit; lowest rate.
DSCR
20% down · 8.5% · 30yr
- Down + closing
- —
- Monthly P&I
- —
- Monthly cashflow
- —
- DSCR
- —
- Eligible?
- —
No personal income docs; deal must DSCR.
Hard money
10% down · 12.0% · 12mo
- Down + closing
- —
- Monthly P&I
- —
- Monthly cashflow
- —
- DSCR
- —
- Eligible?
- —
Short-term bridge; refi at stabilization.
Rent comps 3 comps
| Address | Beds | Baths | Sqft | Rent | $/sqft | DOM | Units | Dist |
|---|---|---|---|---|---|---|---|---|
| 15447 Dapple Bluff Ln Conroe, TX | 4.0 | 2.5 | 2265 | $2,900 | $1.28 | 44d | 1 | 0.09mi |
| 16393 Many Trees Ln Conroe, TX | 3.0 | 2.0 | 1540 | $1,795 | $1.17 | 44d | 1 | 0.49mi |
| 16350 Many Trees Ln Conroe, TX | 3.0 | 2.0 | 1550 | $1,500 | $0.97 | 24d | 1 | 0.53mi |
HOA detail
- Monthly dues
- $80 · $960/yr
Listing history 20 events
-
2026-06-18days on market $254,587 Active 69 DOM
-
2026-06-17days on market $254,587 Active 68 DOM
-
2026-06-16days on market $254,587 Active 67 DOM
-
2026-06-15days on market $254,587 Active 66 DOM
-
2026-06-13days on market $254,587 Active 64 DOM
-
2026-06-10price $254,587 Active 60 DOM
-
2026-06-09days on market $259,587 Active 60 DOM
-
2026-06-08days on market $259,587 Active 59 DOM
-
2026-06-07days on market $259,587 Active 58 DOM
-
2026-06-04days on market $259,587 Active 55 DOM
-
2026-06-03days on market $259,587 Active 54 DOM
-
2026-06-02days on market $259,587 Active 53 DOM
-
2026-06-01days on market $259,587 Active 52 DOM
-
2026-05-31days on market $259,587 Active 51 DOM
-
2026-05-08price $269,587 25-char remark
Show marketing remark (25 chars)
Contact Sales for Details
-
2026-05-07price $259,587 25-char remark
Show marketing remark (25 chars)
Contact Sales for Details
-
2026-05-06price $269,587 428-char remark
Show marketing remark (25 chars)
Contact Sales for Details
-
2026-05-06$283,577 Active 25-char remark
Show marketing remark (25 chars)
Contact Sales for Details
-
2026-04-29price $274,464 428-char remark
Show marketing remark (428 chars)
READY NOW. The Afton floor plan by Centex is ideal for families, featuring a thoughtfully designed layout with an open kitchen that flows seamlessly into the spacious great room. All four bedrooms are conveniently located, offering both comfort and functionality. This home showcases beautiful upgrades, including granite countertops, stainless steel appliances, and luxury vinyl plank flooring throughout the main living areas.
-
2026-04-10$292,367 Active 428-char remark
Show marketing remark (428 chars)
READY NOW. The Afton floor plan by Centex is ideal for families, featuring a thoughtfully designed layout with an open kitchen that flows seamlessly into the spacious great room. All four bedrooms are conveniently located, offering both comfort and functionality. This home showcases beautiful upgrades, including granite countertops, stainless steel appliances, and luxury vinyl plank flooring throughout the main living areas.
ⓘ Source: listings_history table (triggers on properties + properties_extension) + one-shot
backfill from property_details.listing_events for pre-trigger history.
Nearby sold comps map
Loading sold comps map…
Walkable amenities ~0.75 mi
Loading nearby amenities…
Taxation est. · year 1
- Rental income
- $32,784
- − Mortgage interest
- −$14,261
- − Property taxes
- −$3,819
- − Insurance
- −$1,273
- − Repairs & maintenance
- −$2,623
- − Management
- −$2,623
- − HOA
- −$960
- − Depreciation
- −$7,406
- Taxable loss
- −$180
- Est. tax savings @ 24.0%
- +$43
- After-tax cash flow
- $3,870/yr
For passive investors: Depreciation is non-cash, so a rental often shows a tax loss while cash-flowing — sheltering income. Rental losses are passive: they offset passive income freely, and up to $25,000/yr can offset ordinary (W-2) income if you actively participate and your MAGI is under $100k (phasing out to $0 by $150k); unused losses carry forward. On sale, claimed depreciation is recaptured at up to 25%, and gains may owe capital-gains tax (a 1031 exchange can defer both). Figures are a year-1 estimate at your 24.0% rate — not tax advice; consult a CPA.
Condition & rehab AI · 6 photos
This home is in excellent condition with a good curb appeal and a well-maintained exterior. It is ready to move in and can be enhanced with some exterior painting and landscaping improvements to further increase its value.
Value-add opportunities
- Both Painting the exterior — Enhances curb appeal and can increase both resale and rental value.
- Both Landscaping improvements — Enhances curb appeal and can increase both resale and rental value.
- Both Interior touch-ups — Enhances the home's appearance and can increase both resale and rental value.
Renovation cost estimate screening
Value-add ROI direction
- Both Painting the exterior — Enhances curb appeal and can increase both resale and rental value. ↑
- Both Landscaping improvements — Enhances curb appeal and can increase both resale and rental value. ↑
- Both Interior touch-ups — Enhances the home's appearance and can increase both resale and rental value. ↑
ⓘ Cost ranges are severity-bucket heuristics (US national rule-of-thumb). Get contractor quotes + a written scope before underwriting a rehab budget.
Schools (NCES district)
- District
- Conroe ISD
- NCES district ID
- 4815000
- Math proficiency
- 57% ▼ -6.00%
- Reading proficiency
- 57% ▼ -1.00%
- Median HH income
- $71,541
- Composite
- 50.65/100
- National rank
- #1833
- State rank
- #69 of 826 in TX
Livability — Grangerland
No livability data for this city. (Only ~50 U.S. cities are tracked.)
Census & demographics
- County
- Montgomery County · 663,713 people
- Metro
- Houston-The Woodlands-Sugar Land, TX
- Population (ZIP)
- 21,546
- Household income
- $84,673
- Rent vs Own
- Severe rent burden
- 205.0
Population outlook (Montgomery County) Hauer SSP2
- Today (2025)
- 713,896 people
- By 2030
- 805,263 · +12.8%
- By 2040
- 992,708 · +39.1%
- By 2050
- 1,179,590 · +65.2%
- By 2075
- 1,628,084 · +128.1%
- By 2100
- 1,937,880 · +171.5%
Race, ethnicity, and origin ACS 2023
- Neighborhood character
- Majority White (63%)
- Race & ethnicity
- White 63% Hispanic / Latino 29% Two or more races 19% Black 3% Asian 1%
- Hispanic origin (detail)
- Mexican 26% Puerto Rican 1%
- Common ancestry
- Lithuanian 3% Italian 2% Slovak 2%
- Foreign-born
- 13% · Canada, Vietnam, China
- Languages at home
- 78% English-only · Spanish 20% Russian/Polish/Slavic 1% Other Indo-European 0%
Political lean MEDSL · Montgomery
- 2024 margin
- Solid R (+45.5) · D 26.8% · R 72.3%
- 2008→2024 swing
- +7.2pp toward D · 2008: -52.7pp · 2024: -45.5pp
- All cycles
- 2024: R+45.5 2020: R+43.8 2016: R+51.4 2012: R+60.7 2008: R+52.7
Not yet ingested
- Civics
- —
Market trends
- HPI YoY
- ▼ -187.56%
- Current HPI
- 262.1879
- Rent YoY
- ▲ 3.30%
- Metro
- Houston-The Woodlands-Sugar Land, TX
- State GDP YoY
- ▲ 3.95%
- F500 in state
- 110
Industry mix (Fortune 500 HQ in TX)
| Industry | F500 HQs | Revenue |
|---|---|---|
| Energy | 16 | $1,198B |
|
||
| Technology | 5 | $198B |
|
||
| Engineering / Construction | 4 | $72B |
|
||
| Energy Services | 3 | $60B |
|
||
| Utilities | 3 | $41B |
|
||
| Healthcare | 2 | $330B |
|
||
Price history
-7.8% since first listed6 events — show timeline
- 2026-05-08 Price Changed $269,587 Zillow
- 2026-05-07 Price Changed $259,587 Zillow
- 2026-05-06 Price Changed $269,587 HARMLS
- 2026-05-06 Listed $283,577 Zillow
- 2026-04-29 Price Changed $274,464 HARMLS
- 2026-04-10 Listed $292,367 HARMLS
Cash-flow waterfall
monthlySold comps — $/sqft
last 12 mo · ≤1 miLoading sold comps…