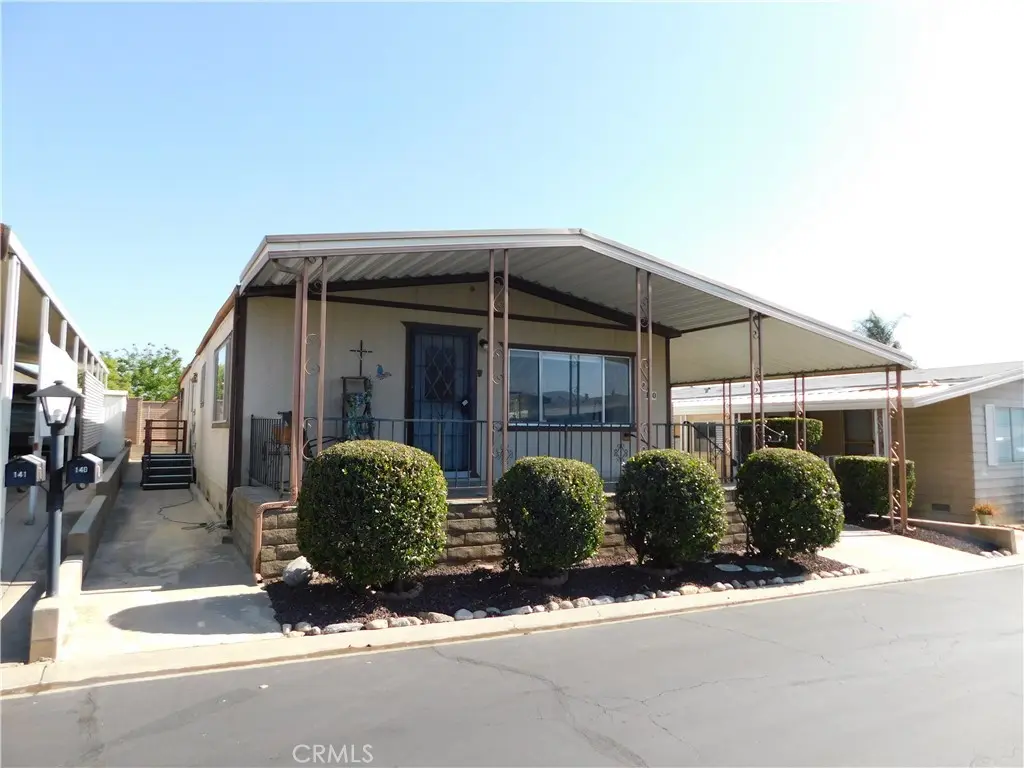
10622 BRYANT #140 · Yucaipa, CA
Flood risk 1/10 · Minimal
- FEMA flood zone
- X (unshaded)
- Chance of flooding over 30 yrs
- 0.0%
- Est. flood insurance / yr
- $507 – $1,088
Fire risk 10/10 · Severe
- Est. fire insurance / yr
- $659 – $1,223
Heat risk 6/10 · Moderate
- Hot days now (above 98°F)
- 8 days/yr
- Hot days in 30 yrs
- 22 days/yr
Wind risk 1/10 · Minimal
- Chance of severe wind over 30 yrs
- —
Air-quality risk 10/10 · Severe
- Unhealthy air days now
- 37 days/yr
- Unhealthy air days in 30 yrs
- 43 days/yr
Risk factors via First Street. Map © Google.
Why this score? — see what drove the C- grade
The composite is a weighted blend of 9 inputs, each scored 0–100. Each bar is that input's sub-score; the figure is the points it added to the 100-point composite (weight × sub-score).
- Cash flow +26.1/30.0
- DSCR +8.8/10.0
- 1% rule +6.9/10.0
- Schools +3.8/10.0
- Livability +3.3/5.0
- Condition / age +2.5/5.0
- Rent growth +2.2/5.0
- ARV discount +0.0/15.0
- Appreciation +0.0/10.0
$189,900
🖨 Deal sheet 📄 Offer letter ✓ Due diligence
Listing remarks
~BEAUTIFUL 3 BEDROOM HOME SITUATED ALONG THE PERIMETER WITH AN INVITING CONCRETE FRONT PORCH WITH SPECTACULAR MOUNTAIN VIEWS!~LOCATED IN EXECUTIVE MOBILE ESTATES YUCAIPAS HIGHLY REQUESTED ALL-AGE COMMUNITY . .. LOW SPACE RENT ONLY $460~UPGRADES INCLUDE NEW COMP SHINGLE ROOF IN 2021 AND NEW HEATING & AIR IN 2018~HUGE BRIGHT LIVING ROOM WITH NEW FLOORING IN 2023.. .BRAND NEW TV WITH SWIVEL MOUNT INCLUDED~FULL SIZE DINING ROOM WITH BUILT-IN HUTCH~SPACIOUS HORSESHOE KITCHEN WITH NEW DISHWASHER & DISPOSAL IN APRIL 2026, NEW FRIDGE IN 2024, CABINETS AND COUNTER SPACE GALORE PLUS BREAKFAST BAR~EAT-IN KITCHEN AREA OR PERFECT SPACE UP FOR A COFFEE BAR~PRIMARY BEDROOM IS KING SIZE WITH SE
Key facts
- Concrete front porch
- New flooring
- Built-in hutch
Tags
Property features AI
Finance
- Other: Manager approval required; Pets allowed
- Financial info: Monthly land lease of $439 (seller-provided)
- HOA & community: Land lease community (Executive park); Suburban community
Exterior
- Parking: Detached carport (2 spaces)
- Utilities: Public sewer; District/public water
- Home design: Single-story property; Entry level: 1
- Construction: Year built per assessor; Mobile home (24 ft x 60 ft)
- Exterior features: Front porch with concrete surface; Community pool; Park nearby; Has view; One shed on property; Mobile home remains (24' x 60')
Interior
- Kitchen: Garbage disposal; Dishwasher
- Bathrooms: 2 full bathrooms
- Heating & cooling: Central cooling; Central furnace heating
- Interior features: Beamed ceilings; Front door entry; One-level home; Community spa
- Laundry & utility: Dedicated laundry room
Neighborhood map
What this means for you Summary
Snapshot
- This is a 3-bed/2.0-bath manufactured listed at $190k.
Deal economics
- At list price, monthly cash flow is $476 ($6k/yr) — positive.
- The deal already cash-flows at list — no discount required.
- Meets the 1% rule at list price ($2k rent vs $190k).
- Cap rate 9.3% vs local median 2.7% in Yucaipa — top-decile yield for the area; either an underpriced asset or a hidden risk that comps aren't pricing in. Stress-test before assuming the spread holds.
Location & tenants
- Location reads 66/100 on livability (#334 in CA) — a middle-class / working-renter tenant base. Strengths: housing A+, employment B+; Watch: schools D, health & safety D, amenities F.
- Yucaipa-Calimesa Joint Unified (suburban): math 32% / reading 55% proficiency, ranked #195 of 517 in CA (top 38%) — families likely to look elsewhere, expect single-tenant / working-renter base with shorter leases.
- Market conditions: Rents soft (-1.3%/yr); 205 active listings in the ZIP; solid renter incomes; 5,458 units permitted in San Bernardino County in 2024 (1,500 in 5+ unit buildings).
Forward outlook
- Local home prices are declining (-3.0%/yr); year-one equity from $1k of loan paydown is wiped out by about $6k of value loss. Plan a longer hold.
- San Bernardino County population projected at +15% by 2050 — modest demand growth; plan on rents tracking national, not racing it.
Negotiation context
- Only 7 days on market — expect competitive offers; lowballing is unlikely to land.
- 3 sale attempts since 17y ago with the ask held roughly flat each time — persistent listings suggest the price (not the market) is what's stuck; bring a comps-based counter.
Risks & watch-outs
- Climate carrying-cost: severe wildfire risk; extreme-heat days projected 8→22/yr by 2055 (HVAC capex compounding) — expect insurance premiums to compound above CPI over the hold.
Questions for the listing agent
- Built in 1978 — when were the roof, HVAC, electrical panel, plumbing, and water heater last replaced?
- Is there a deadline driving the sale (1031 exchange, divorce, estate, relocation)? That informs how much negotiation room exists.
- Schools are D-rated, which usually means shorter tenancies and higher turnover. Who's the typical renter profile here, and what's been the actual vacancy rate?
- What's the average days-on-market for RENTAL listings here right now (not sales)? A rising rental-DOM trend means longer vacancies and softer asking-rent achievability than the comps imply.
- What's the recent tenant-quality profile in this submarket — average credit score on applications, eviction rate, late-payment / NSF rate, and stable-employment percentage? A property-management company in the area should have these aggregated.
- How much new for-sale + rental construction is in the pipeline within 1–3 miles? Heavy new supply typically softens prices + rents 12–24 months out; constrained supply supports both.
Investment metrics
- 1% rule
- 1.19% ✓
- Cap rate
- 9.30%
- Cash-on-cash
- 10.75%
- DSCR
- 1.48
- GRM
- 7.0
CMA / ARV
- ARV (on-the-fly)
- $136,800
- Comps found
- 12
Show comp detail 12 sales within ~0.75 mi
| Address | Dist | Beds/Ba | Sqft | Sold | Price | $/sf | Match |
|---|---|---|---|---|---|---|---|
| 35218 Fir #120 | 0.31mi | 3/2.0 | 1,448 (+1%) | 0mo | $80,000 | $55 | 84 |
| 10622 Bryant St #44 | 0.07mi | 2/2.0 (-1) | 1,344 (-7%) | 1mo | $210,000 | $156 | 80 |
| 10622 BRYANT St #54 | 0.00mi | 2/2.0 (-1) | 1,344 (-7%) | 6mo | $183,900 | $137 | 79 |
| 35218 Fir Ave #183 | 0.31mi | 2/2.0 (-1) | 1,440 (0%) | 3mo | $169,900 | $118 | 78 |
| 35218 Fir Ave #182 | 0.35mi | 2/2.0 (-1) | 1,440 (0%) | 1mo | $110,000 | $76 | 78 |
| 10675 BRYANT St #112 | 0.30mi | 2/2.0 (-1) | 1,440 (0%) | 5mo | $110,000 | $76 | 77 |
| 35218 Fir Ave #110 | 0.39mi | 2/2.0 (-1) | 1,440 (0%) | 0mo | $137,500 | $95 | 76 |
| 35218 Fir Ave #30 | 0.39mi | 2/2.0 (-1) | 1,440 (0%) | 6mo | $130,000 | $90 | 72 |
| 35218 Fir Ave #179 | 0.35mi | 2/2.0 (-1) | 1,344 (-7%) | 1mo | $115,000 | $86 | 66 |
| 35218 FIR Ave #15 | 0.39mi | 2/2.0 (-1) | 1,344 (-7%) | 7mo | $120,000 | $89 | 60 |
| 11050 Bryant St #128 | 0.64mi | 2/1.5 (-1) | 1,344 (-7%) | 3mo | $133,500 | $99 | 50 |
| 11050 Bryant #271 | 0.64mi | 2/2.0 (-1) | 1,296 (-10%) | 2mo | $143,000 | $110 | 47 |
Match score weights: distance 35% · size 25% · config 20% · recency 20%. Top-matched comps best support the ARV.
Projected returns pro-forma
-3.0% appreciation · 0.0% rent growth · sell at horizon
- IRR
- -3.6%
- Equity multiple
- 0.87×
- Total profit
- $-7,028
- Equity at exit
- $28,315
- IRR
- 2.3%
- Equity multiple
- 1.14×
- Total profit
- $7,449
- Equity at exit
- $16,419
Cash invested: $53,172 (down + closing). Projections, not guarantees.
Landlord ↔ Tenant lean methodology
- Overall (STATE)
- 18 Strongly Tenant-Friendly
- State California
- 18 Strongly Tenant-Friendly · D+13
- County
- — inherits STATE
- City
- — inherits STATE
ZIP-level market 92399
- Rents YoY
- -1.3%
- Active inventory
- 205
- Price-to-rent
- 7.0×
Monthly cashflow live
- Estimated rent
- $2,264 medium interval (Pro) →
- Mortgage (P&I)
- −$996
- Tax est. 1.5%
- −$237 /mo · $2,848/yr
- Insurance
- −$79
- HOA
- −$0
- Vacancy / Maint / Mgmt
- −$476
- Net cashflow
- $476
Break-even live
UW: 25.0% down · 7.5% · 30yr · 1.5% tax · 5.0% vac · 8.0% maint · 8.0% mgmt
Financing live
Cash to close
- Down payment
- $47,475
- Closing costs
- $5,697
- Reserves months
- —
- Total cash needed
- —
Loan-product check · same deal, 3 products live
Conventional
25% down · 7.5% · 30yr
- Down + closing
- —
- Monthly P&I
- —
- Monthly cashflow
- —
- DSCR
- —
- Eligible?
- —
Personal DTI + credit; lowest rate.
DSCR
20% down · 8.5% · 30yr
- Down + closing
- —
- Monthly P&I
- —
- Monthly cashflow
- —
- DSCR
- —
- Eligible?
- —
No personal income docs; deal must DSCR.
Hard money
10% down · 12.0% · 12mo
- Down + closing
- —
- Monthly P&I
- —
- Monthly cashflow
- —
- DSCR
- —
- Eligible?
- —
Short-term bridge; refi at stabilization.
Listing history 7 events
-
2026-06-18days on market $189,900 Active 7 DOM
-
2026-06-17days on market $189,900 Active 6 DOM
-
2026-06-16days on market $189,900 Active 5 DOM
-
2026-06-15days on market $189,900 Active 4 DOM
-
2026-06-13days on market $189,900 Active 2 DOM
-
2026-06-13remarks 691-char remark
-
2026-06-13$189,900 Active 1 DOM
ⓘ Source: listings_history table (triggers on properties + properties_extension) + one-shot
backfill from property_details.listing_events for pre-trigger history.
Climate risk First Street
- Flood 1/10 Low FEMA zone X (unshaded) · 0% chance over 30 yrs
- Wildfire 10/10 Extreme
- Heat 6/10 Major 8 d/yr ≥98°F today · 22 d/yr by 30 yrs out
- Wind 1/10 Low
- Air quality 10/10 Extreme 37 unhealthy d/yr today · 43 by 30 yrs out
Nearby sold comps map
Loading sold comps map…
Walkable amenities ~0.75 mi
Loading nearby amenities…
Taxation est. · year 1
- Rental income
- $27,172
- − Mortgage interest
- −$10,637
- − Property taxes
- −$2,848
- − Insurance
- −$950
- − Repairs & maintenance
- −$2,174
- − Management
- −$2,174
- − Depreciation
- −$5,524
- Taxable income
- $2,865
- Est. tax owed @ 24.0%
- −$688
- After-tax cash flow
- $5,030/yr
For passive investors: Depreciation is non-cash, so a rental often shows a tax loss while cash-flowing — sheltering income. Rental losses are passive: they offset passive income freely, and up to $25,000/yr can offset ordinary (W-2) income if you actively participate and your MAGI is under $100k (phasing out to $0 by $150k); unused losses carry forward. On sale, claimed depreciation is recaptured at up to 25%, and gains may owe capital-gains tax (a 1031 exchange can defer both). Figures are a year-1 estimate at your 24.0% rate — not tax advice; consult a CPA.
Schools (NCES district)
- District
- Yucaipa-Calimesa Joint Unified
- NCES district ID
- 0643560
- Math proficiency
- 32% ▼ -4.00%
- Reading proficiency
- 55% ▲ 6.00%
- Median HH income
- $58,243
- Composite
- 38.09/100
- National rank
- #4277
- State rank
- #195 of 517 in CA
Livability — Yucaipa
- Score
- 66/100
- State rank
- #334
- US rank
- #11542
Category grades
Schools grade is shown separately in the Schools card above.
Census & demographics
- Census place
- Yucaipa, CA
- County
- San Bernardino County · 2,030,291 people
- City population
- 55,366
- Metro
- Riverside-San Bernardino-Ontario, CA
- Population (ZIP)
- 55,366
- Household income
- $92,440
- Rent vs Own
- Severe rent burden
- 1110.0
Population outlook (San Bernardino County) Hauer SSP2
- Today (2025)
- 2,300,329 people
- By 2030
- 2,378,907 · +3.4%
- By 2040
- 2,523,137 · +9.7%
- By 2050
- 2,642,388 · +14.9%
- By 2075
- 2,880,769 · +25.2%
- By 2100
- 2,909,436 · +26.5%
Race, ethnicity, and origin ACS 2023
- Neighborhood character
- Diverse neighborhood (Simpson 0.57)
- Race & ethnicity
- White 55% Hispanic / Latino 36% Two or more races 15% Asian 3% Black 2%
- Hispanic origin (detail)
- Mexican 31%
- Common ancestry
- Italian 4% Iranian 2% Lithuanian 2%
- Foreign-born
- 10% · Canada
- Languages at home
- 77% English-only · Spanish 19% Other Indo-European 1% Other Asian/Pacific 1%
Political lean MEDSL · San Bernardino
- 2024 margin
- Toss-up / Even · D 47.5% · R 49.7% · Other 2.8%
- 2008→2024 swing
- -8.5pp toward R · 2008: 6.3pp · 2024: -2.1pp
- All cycles
- 2024: R+2.1 2020: D+10.7 2016: D+9.8 2012: D+5.4 2008: D+6.3
Not yet ingested
- Civics
- —
Market trends
- HPI YoY
- ▼ -632.71%
- Current HPI
- 353.4762
- Rent YoY
- ▼ -1.27%
- Metro
- Riverside-San Bernardino-Ontario, CA
- State GDP YoY
- ▲ 3.21%
- F500 in state
- 116
Industry mix (Fortune 500 HQ in CA)
| Industry | F500 HQs | Revenue |
|---|---|---|
| Technology | 27 | $1,492B |
|
||
| Financial Services | 3 | $174B |
|
||
| Retail | 3 | $44B |
|
||
| Insurance | 3 | $26B |
|
||
| Media / Entertainment | 2 | $115B |
|
||
| Pharmaceuticals / Biotech | 2 | $62B |
|
||
Price history
+217.0% since first listed5 events — show timeline
- 2026-06-11 Listed $189,900 CRMLS
- 2010-10-17 Listing Removed — CRMLS
- 2010-06-18 Listed $52,000 CRMLS
- 2010-05-11 Listing Removed — CRMLS
- 2009-12-14 Listed $59,900 CRMLS
Property tax history
+0.2%/yrLatest (2025): $205 · +1.2% YoY. Source: county tax records.
Cash-flow waterfall
monthlySold comps — $/sqft
last 12 mo · ≤1 miLoading sold comps…