212 S Tryon St · Woodstock, IL
Flood risk 1/10 · Minimal
- FEMA flood zone
- X (unshaded)
- Chance of flooding over 30 yrs
- 0.0%
- Est. flood insurance / yr
- $507 – $1,088
Fire risk 1/10 · Minimal
- Est. fire insurance / yr
- $804 – $1,492
Heat risk 2/10 · Minimal
- Hot days now (above 101°F)
- 7 days/yr
- Hot days in 30 yrs
- 14 days/yr
Wind risk 2/10 · Minimal
- Chance of severe wind over 30 yrs
- —
Air-quality risk 1/10 · Minimal
- Unhealthy air days now
- 0 days/yr
- Unhealthy air days in 30 yrs
- 0 days/yr
Risk factors via First Street. Map © Google.
Why this score? — see what drove the B- grade
The composite is a weighted blend of 9 inputs, each scored 0–100. Each bar is that input's sub-score; the figure is the points it added to the 100-point composite (weight × sub-score).
- Cash flow +30.0/30.0
- 1% rule +10.0/10.0
- DSCR +10.0/10.0
- ARV discount +7.5/15.0
- Livability +4.1/5.0
- Schools +2.8/10.0
- Rent growth +2.5/5.0
- Condition / age +1.0/5.0
- Appreciation +0.0/10.0
$69,900
🖨 Deal sheet 📄 Offer letter ✓ Due diligence
Listing remarks MLS
Excellent re-development opportunity just blocks from the Historic Woodstock Square. Victorian home on the property which needs some TLC but has great potential. Alternatively, raze the existing structure and the current zoning allows for a duplex. Property is two blocks from the Historic Woodstock Square and only three blocks from the Metra Station. Great opportunity for a small builder or an enthusiast of older Victorian homes as rehab project. Property is being sold "As-Is".
Key facts
- 0.52 acre lot
- Garage
- Built 1986
Property features AI
Finance
- Other: Property assessed living area source: assessor; Parcel number on file
- HOA & community: No master association fees required
Exterior
- Parking: Detached garage (1 garage space; 1 total parking space)
- Utilities: Public water; Public sewer
- Home design: Detached single-family home; 2-story layout; Fee simple ownership
- Construction: Vinyl siding exterior; 31–40 years old; Not rebuilt or rehabilitated since original construction
- Exterior features: Lot approximately 0.50–0.99 acre; Lot dimensions listed
Interior
- Kitchen: Main-level kitchen (about 17 x 9); Second-level kitchen (about 10 x 12); Second-level breakfast/eating areas
- Bedrooms: 6 bedrooms (Master bedroom on main level; additional bedrooms on main and second levels); Two bedrooms on the second level measure approximately 10 x 10; One bedroom on the main level measures approximately 10 x 10
- Bathrooms: 5 full bathrooms
- Heating & cooling: Natural gas heating
- Interior features: 17 total rooms; Unfinished full basement
- Laundry & utility: Laundry room in the basement (about 8 x 10); Utility room in the basement (about 12 x 10); Work room in the basement (about 10 x 10)
Neighborhood map
What this means for you Summary
Snapshot
- This is a 6-bed/5.0-bath other listed at $70k. Condition is rated poor.
Deal economics
- At list price, monthly cash flow is $1k ($16k/yr) — positive.
- The deal already cash-flows at list — no discount required.
- Meets the 1% rule at list price ($2k rent vs $70k).
- Cap rate 29.4% vs local median 2.6% in Woodstock — top-decile yield for the area; either an underpriced asset or a hidden risk that comps aren't pricing in. Stress-test before assuming the spread holds.
Location & tenants
- Location reads 82/100 on livability (#66 in IL, #1,114 nationally) — a professional / high-income tenant draw. Strengths: crime A+, cost of living A+, housing A+; Watch: schools D-.
- Woodstock CUSD 200 (town): math 24% / reading 38% proficiency, ranked #220 of 620 in IL (top 36%) — families likely to look elsewhere, expect single-tenant / working-renter base with shorter leases.
- Market conditions: 141 active listings in the ZIP; solid renter incomes; 1,595 units permitted in McHenry County in 2024 (485 in 5+ unit buildings).
- This rent runs 30% of the median local income ($91k/yr) — at the standard rent-burdened threshold; future hikes will face affordability resistance.
Forward outlook
- Local home prices are declining (-3.0%/yr); year-one equity from $483 of loan paydown is wiped out by about $2k of value loss. Plan a longer hold.
- McHenry County population projected at -12% by 2050 — secular population decline; favor cash flow + early exit over multi-decade hold.
- At projected returns (-3.0% appreciation + 3.0% rent growth), your $20k cash investment doubles in ~2 years — after that, you're playing with house money.
Negotiation context
- Only 2 days on market — expect competitive offers; lowballing is unlikely to land.
- 5 sale attempts since 10y ago with the ask held roughly flat each time — persistent listings suggest the price (not the market) is what's stuck; bring a comps-based counter.
- Current owner paid $35k; list at $70k implies a 100% gain — meaningful room to come down on a strong offer.
Questions for the listing agent
- Have any recent inspections been done? Can we get a copy of the seller's disclosures and any deferred-maintenance estimates?
- Is there a deadline driving the sale (1031 exchange, divorce, estate, relocation)? That informs how much negotiation room exists.
- Schools are D-rated, which usually means shorter tenancies and higher turnover. Who's the typical renter profile here, and what's been the actual vacancy rate?
- What's the average days-on-market for RENTAL listings here right now (not sales)? A rising rental-DOM trend means longer vacancies and softer asking-rent achievability than the comps imply.
- What's the recent tenant-quality profile in this submarket — average credit score on applications, eviction rate, late-payment / NSF rate, and stable-employment percentage? A property-management company in the area should have these aggregated.
- How much new for-sale + rental construction is in the pipeline within 1–3 miles? Heavy new supply typically softens prices + rents 12–24 months out; constrained supply supports both.
Investment metrics
- 1% rule
- 3.31% ✓
- Cap rate
- 29.35%
- Cash-on-cash
- 82.36%
- DSCR
- 4.66
- GRM
- 2.5
CMA / ARV
- ARV (median comp)
- $322,469
- List price
- $69,900
- Delta
- -76.77%
- Verdict
- UNDERPRICED
- Comps
- 10 within 1.0 mi
Projected returns pro-forma
-3.0% appreciation · 3.0% rent growth · sell at horizon
- IRR
- 82.7%
- Equity multiple
- 4.79×
- Total profit
- $74,263
- Equity at exit
- $10,422
- IRR
- 86.0%
- Equity multiple
- 9.94×
- Total profit
- $174,974
- Equity at exit
- $6,044
Cash invested: $19,572 (down + closing). Projections, not guarantees.
Landlord ↔ Tenant lean methodology
- Overall (STATE)
- 43 Moderately Tenant-Leaning
- State Illinois
- 43 Moderately Tenant-Leaning · D+7
- County
- — inherits STATE
- City
- — inherits STATE
ZIP-level market 60098
- Home prices YoY
- -30.0%
- Active inventory
- 141
- Price-to-rent
- 2.5×
Monthly cashflow live
- Estimated rent
- $2,312 medium interval (Pro) →
- Mortgage (P&I)
- −$367
- Tax est. 1.5%
- −$87 /mo · $1,048/yr
- Insurance
- −$29
- HOA
- −$0
- Vacancy / Maint / Mgmt
- −$485
- Net cashflow
- $1,343
Break-even live
UW: 25.0% down · 7.5% · 30yr · 1.5% tax · 5.0% vac · 8.0% maint · 8.0% mgmt
Financing live
Cash to close
- Down payment
- $17,475
- Closing costs
- $2,097
- Reserves months
- —
- Total cash needed
- —
Loan-product check · same deal, 3 products live
Conventional
25% down · 7.5% · 30yr
- Down + closing
- —
- Monthly P&I
- —
- Monthly cashflow
- —
- DSCR
- —
- Eligible?
- —
Personal DTI + credit; lowest rate.
DSCR
20% down · 8.5% · 30yr
- Down + closing
- —
- Monthly P&I
- —
- Monthly cashflow
- —
- DSCR
- —
- Eligible?
- —
No personal income docs; deal must DSCR.
Hard money
10% down · 12.0% · 12mo
- Down + closing
- —
- Monthly P&I
- —
- Monthly cashflow
- —
- DSCR
- —
- Eligible?
- —
Short-term bridge; refi at stabilization.
Listing history 22 events
-
2026-06-18days on market $69,900 Active 2 DOM
-
2026-06-17pricedays on market $69,900 Active 1 DOM
-
2026-06-16days on market $74,900 Active 88 DOM
-
2026-06-15days on market $74,900 Active 87 DOM
-
2026-06-13days on market $74,900 Active 85 DOM
-
2026-06-09days on market $74,900 Active 81 DOM
-
2026-06-08days on market $74,900 Active 80 DOM
-
2026-06-08days on market $74,900 Active 79 DOM
-
2026-06-04days on market $74,900 Active 76 DOM
-
2026-06-03days on market $74,900 Active 75 DOM
-
2026-06-02days on market $74,900 Active 74 DOM
-
2026-06-01days on market $74,900 Active 73 DOM
-
2026-05-31days on market $74,900 Active 72 DOM
-
2026-03-20$74,900 Active 888-char remark
-
2020-03-10soldstatus $35,000
-
2020-02-10soldstatus $35,000 Closed Sale 492-char remark
Show marketing remark (492 chars)
Excellent re-development opportunity just blocks from the Historic Woodstock Square. Victorian home on the property which needs some TLC but has great potential. Alternatively, raze the existing structure and the current zoning allows for a duplex. Property is two blocks from the Historic Woodstock Square and only three blocks from the Metra Station. Great opportunity for a small builder or an enthusiast of older Victorian homes as rehab project. Property is being sold "As-Is".
-
2019-12-24historical Contingent 492-char remark
Show marketing remark (492 chars)
Excellent re-development opportunity just blocks from the Historic Woodstock Square. Victorian home on the property which needs some TLC but has great potential. Alternatively, raze the existing structure and the current zoning allows for a duplex. Property is two blocks from the Historic Woodstock Square and only three blocks from the Metra Station. Great opportunity for a small builder or an enthusiast of older Victorian homes as rehab project. Property is being sold "As-Is".
-
2019-11-25status Reactivated 492-char remark
Show marketing remark (492 chars)
Excellent re-development opportunity just blocks from the Historic Woodstock Square. Victorian home on the property which needs some TLC but has great potential. Alternatively, raze the existing structure and the current zoning allows for a duplex. Property is two blocks from the Historic Woodstock Square and only three blocks from the Metra Station. Great opportunity for a small builder or an enthusiast of older Victorian homes as rehab project. Property is being sold "As-Is".
-
2019-10-28status Pending 492-char remark
Show marketing remark (492 chars)
Excellent re-development opportunity just blocks from the Historic Woodstock Square. Victorian home on the property which needs some TLC but has great potential. Alternatively, raze the existing structure and the current zoning allows for a duplex. Property is two blocks from the Historic Woodstock Square and only three blocks from the Metra Station. Great opportunity for a small builder or an enthusiast of older Victorian homes as rehab project. Property is being sold "As-Is".
-
2019-10-21$49,900 New 492-char remark
Show marketing remark (492 chars)
Excellent re-development opportunity just blocks from the Historic Woodstock Square. Victorian home on the property which needs some TLC but has great potential. Alternatively, raze the existing structure and the current zoning allows for a duplex. Property is two blocks from the Historic Woodstock Square and only three blocks from the Metra Station. Great opportunity for a small builder or an enthusiast of older Victorian homes as rehab project. Property is being sold "As-Is".
-
2016-06-09historical
-
2016-04-15New
ⓘ Source: listings_history table (triggers on properties + properties_extension) + one-shot
backfill from property_details.listing_events for pre-trigger history.
Climate risk First Street
- Flood 1/10 Low FEMA zone X (unshaded) · 0% chance over 30 yrs
- Wildfire 1/10 Low
- Heat 2/10 Low 7 d/yr ≥101°F today · 14 d/yr by 30 yrs out
- Wind 2/10 Low
- Air quality 1/10 Low 0 unhealthy d/yr today · 0 by 30 yrs out
Nearby sold comps map
Loading sold comps map…
Walkable amenities ~0.75 mi
Loading nearby amenities…
Taxation est. · year 1
- Rental income
- $27,742
- − Mortgage interest
- −$3,915
- − Property taxes
- −$1,048
- − Insurance
- −$350
- − Repairs & maintenance
- −$2,219
- − Management
- −$2,219
- − Depreciation
- −$2,033
- Taxable income
- $15,956
- Est. tax owed @ 24.0%
- −$3,830
- After-tax cash flow
- $12,290/yr
For passive investors: Depreciation is non-cash, so a rental often shows a tax loss while cash-flowing — sheltering income. Rental losses are passive: they offset passive income freely, and up to $25,000/yr can offset ordinary (W-2) income if you actively participate and your MAGI is under $100k (phasing out to $0 by $150k); unused losses carry forward. On sale, claimed depreciation is recaptured at up to 25%, and gains may owe capital-gains tax (a 1031 exchange can defer both). Figures are a year-1 estimate at your 24.0% rate — not tax advice; consult a CPA.
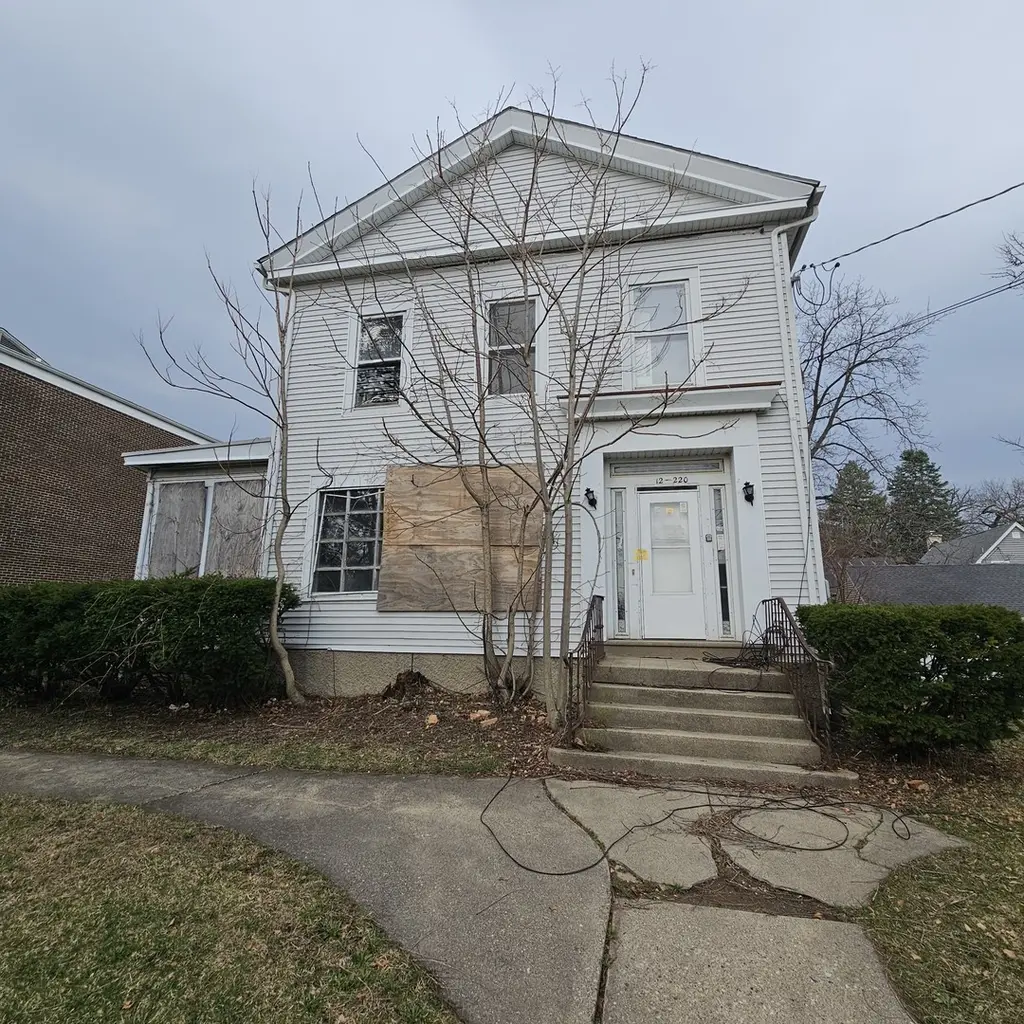
Condition & rehab AI · 3 photos
This property requires extensive repairs and maintenance, including major work on the exterior siding, roof, and foundation. Significant value can be added through these improvements, enhancing both resale and rental potential.
Repairs flagged
- Major Exterior siding — Severe damage and peeling
- Major Roof — Appears old and possibly leaking
- Major Foundation — Signs of settling
- Major Landscaping — Overgrown and unkempt
Value-add opportunities
- Both Repair exterior siding and roof — Both improve aesthetics and structural integrity
- Both Paint exterior walls — Enhances curb appeal and value
- Both Landscaping and curb appeal — Improves first impression and value
- Both Foundation repair — Stabilizes structure and prevents further damage
Renovation cost estimate screening
| Repair item | Severity | Est. cost |
|---|---|---|
| Exterior siding · Severe damage and peeling | Major | $15,000–50,000 |
| Roof · Appears old and possibly leaking | Major | $15,000–50,000 |
| Foundation · Signs of settling | Major | $15,000–50,000 |
| Landscaping · Overgrown and unkempt | Major | $15,000–50,000 |
| Total estimated repair cost · 4 items | $60,000–200,000 |
Value-add ROI direction
- Both Repair exterior siding and roof — Both improve aesthetics and structural integrity ↑
- Both Paint exterior walls — Enhances curb appeal and value ↑
- Both Landscaping and curb appeal — Improves first impression and value ↑
- Both Foundation repair — Stabilizes structure and prevents further damage ↑
ⓘ Cost ranges are severity-bucket heuristics (US national rule-of-thumb). Get contractor quotes + a written scope before underwriting a rehab budget.
Schools (NCES district)
- District
- Woodstock CUSD 200
- NCES district ID
- 1743330
- Math proficiency
- 24% ▼ -8.00%
- Reading proficiency
- 38% ▼ -8.00%
- Median HH income
- $64,309
- Composite
- 28.35/100
- National rank
- #6773
- State rank
- #220 of 620 in IL
Livability — Woodstock
- Score
- 82/100
- State rank
- #66
- US rank
- #1114
Category grades
Schools grade is shown separately in the Schools card above.
Census & demographics
- Census place
- Woodstock, IL
- County
- McHenry County · 204,279 people
- City population
- 33,130
- Metro
- Chicago-Naperville-Elgin, IL-IN-WI
- Population (ZIP)
- 33,130
- Household income
- $91,062
- Rent vs Own
- Severe rent burden
- 759.0
Population outlook (McHenry County) Hauer SSP2
- Today (2025)
- 305,342 people
- By 2030
- 301,491 · -1.3%
- By 2040
- 288,211 · -5.6%
- By 2050
- 268,430 · -12.1%
- By 2075
- 226,209 · -25.9%
- By 2100
- 181,247 · -40.6%
Race, ethnicity, and origin ACS 2023
- Neighborhood character
- Predominantly White (73%)
- Race & ethnicity
- White 73% Hispanic / Latino 20% Two or more races 14% Asian 2% Black 2%
- Hispanic origin (detail)
- Mexican 17% Puerto Rican 1%
- Common ancestry
- Romanian 9% Lithuanian 2% Portuguese 2%
- Foreign-born
- 12% · Canada
- Languages at home
- 79% English-only · Spanish 16% Russian/Polish/Slavic 2% Tagalog/Filipino 1%
Political lean MEDSL · McHenry
- 2024 margin
- Lean R (+5.3) · D 46.6% · R 51.9% · Other 1.5%
- 2008→2024 swing
- -10.6pp toward R · 2008: 5.3pp · 2024: -5.3pp
- All cycles
- 2024: R+5.3 2020: R+2.5 2016: R+8.1 2012: R+8.8 2008: D+5.3
Not yet ingested
- Civics
- —
Market trends
- HPI YoY
- ▼ -88.07%
- Current HPI
- 205.5664
- Rent YoY
- —
- Metro
- Chicago-Naperville-Elgin, IL-IN-WI
- State GDP YoY
- ▲ 1.59%
- F500 in state
- 60
Industry mix (Fortune 500 HQ in IL)
| Industry | F500 HQs | Revenue |
|---|---|---|
| Insurance | 4 | $201B |
|
||
| Consumer Goods | 4 | $87B |
|
||
| Industrial Machinery | 3 | $64B |
|
||
| Healthcare | 2 | $55B |
|
||
| Retail / Pharmacy | 1 | $148B |
|
||
| Agriculture / Food | 1 | $86B |
|
||
Price history
+40.1% since first listed11 events — show timeline
- 2026-06-16 Listing Removed — MRED as Distributed by MLS Grid
- 2026-06-16 Listed $69,900 MRED as Distributed by MLS Grid
- 2026-03-20 Listed — MRED as Distributed by MLS Grid
- 2020-03-10 Sold (Public Records) $35,000 Public Records
- 2020-02-10 Sold (MLS) $35,000 MRED as Distributed by MLS Grid
- 2019-12-24 Contingent — MRED as Distributed by MLS Grid
- 2019-11-25 Relisted — MRED as Distributed by MLS Grid
- 2019-10-28 Pending — MRED as Distributed by MLS Grid
- 2019-10-21 Listed $49,900 MRED as Distributed by MLS Grid
- 2016-06-09 Listing Removed — MRED as Distributed by MLS Grid
- 2016-04-15 Listed — MRED as Distributed by MLS Grid
Property tax history
-14.0%/yrLatest (2025): $4,389 · +3.3% YoY. Source: county tax records.
Cash-flow waterfall
monthlySold comps — $/sqft
last 12 mo · ≤1 miLoading sold comps…