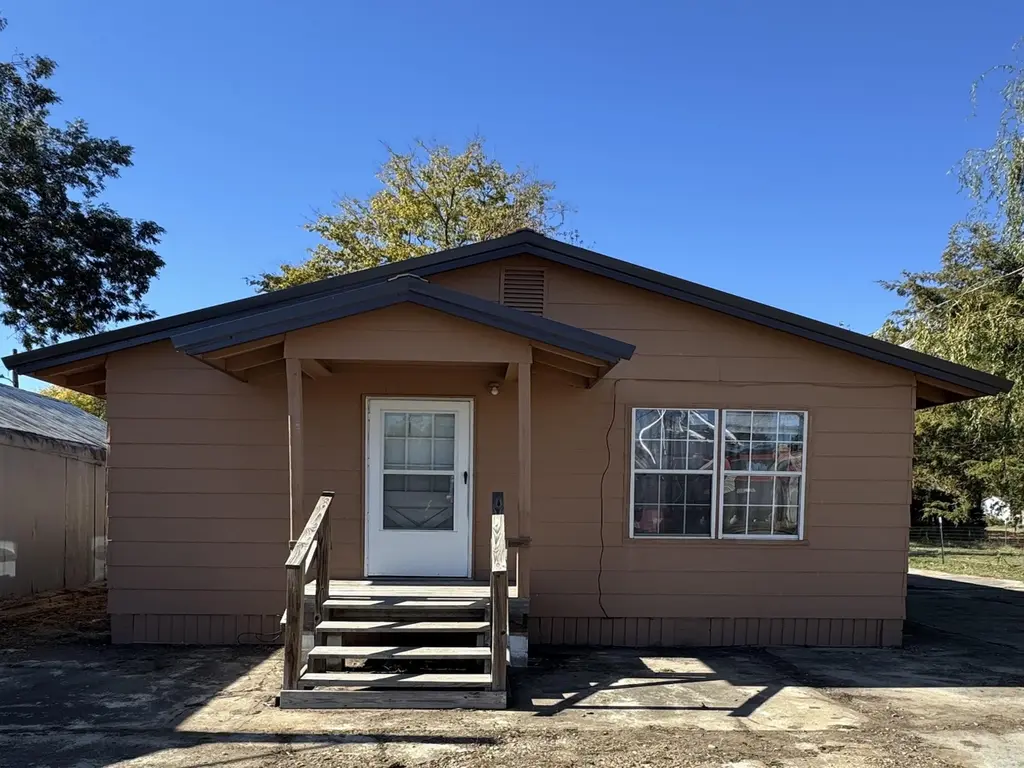
155 Highway 1b · Cherry Valley, AR
Flood risk 1/10 · Minimal
- FEMA flood zone
- X
- Chance of flooding over 30 yrs
- 0.0%
- Est. flood insurance / yr
- $507 – $1,088
Fire risk 1/10 · Minimal
- Est. fire insurance / yr
- $1,499 – $2,785
Heat risk 6/10 · Moderate
- Hot days now (above 109°F)
- 7 days/yr
- Hot days in 30 yrs
- 20 days/yr
Wind risk 4/10 · Minor
- Chance of severe wind over 30 yrs
- 10.0%
Air-quality risk 1/10 · Minimal
- Unhealthy air days now
- 0 days/yr
- Unhealthy air days in 30 yrs
- 0 days/yr
Risk factors via First Street. Map © Google.
Why this score? — see what drove the A- grade
The composite is a weighted blend of 9 inputs, each scored 0–100. Each bar is that input's sub-score; the figure is the points it added to the 100-point composite (weight × sub-score).
- Cash flow +30.0/30.0
- ARV discount +15.0/15.0
- 1% rule +10.0/10.0
- DSCR +10.0/10.0
- Appreciation +5.0/10.0
- Schools +4.1/10.0
- Livability +2.8/5.0
- Rent growth +2.5/5.0
- Condition / age +2.5/5.0
$49,999
🖨 Deal sheet 📄 Offer letter ✓ Due diligence
Listing remarks
Welcome to the market this nice cozy 2BR/1B home settled right in the heart of Cherry Valley, AR. Conveniently located just walking distance from the local restaurant, library, city hall, and bank! Roughly one hour from Memphis, TN and less than 45 minutes from Jonesboro, AR. This home comes with an open floor plan that makes it east to entertain guest. A convenient breakfast bar provides the perfect spot to enjoy a warm cup of coffee in the morning. A freshly remodeled bathroom with a standup shower for easy access. Rest easy at night knowing you have a storm cellar just a few yards away from your back door to keep you safe during the stormy months! Brand new metal roof and exterior siding
Key facts
- Open floor plan
- Standup shower
- Metal roof
Tags
Neighborhood map
What this means for you Summary
Snapshot
- This is a 2-bed/1.0-bath single-family listed at $50k.
Deal economics
- At list price, monthly cash flow is $369 ($4k/yr) — positive.
- The deal already cash-flows at list — no discount required.
- Meets the 1% rule at list price ($850 rent vs $50k).
- Recommended offer: $49k (1.5% below list) — sets the bar for market timing.
Location & tenants
- Location reads 55/100 on livability (#411 in AR) — a working-class tenant base; expect higher turnover. Strengths: cost of living A+, crime A, health & safety A; Watch: housing C-, schools D, amenities F.
- Cross County School District (rural): math 46% / reading 52% proficiency, ranked #24 of 238 in AR (top 10%) — families likely to look elsewhere, expect single-tenant / working-renter base with shorter leases; 74% free/reduced lunch — lower-income household profile, screen leases tightly.
- Market conditions: 12 active listings in the ZIP; 17 units permitted in Cross County in 2024 (0 in 5+ unit buildings).
Forward outlook
- In year one you build about $2k of equity ($345 loan paydown + $2k appreciation (3.0% local appreciation)).
- Cross County population projected at -20% by 2050 — secular population decline; favor cash flow + early exit over multi-decade hold.
- At projected returns (3.0% appreciation + 3.0% rent growth), your $14k cash investment doubles in ~3 years — after that, you're playing with house money.
Negotiation context
- It's been on market 17 days — a 2% lower offer ($49k) is reasonable based on typical stale-listing flexibility.
- 2 sale attempts; this cycle's ask has dropped $15k (23%) from the opening price — seller is motivated, your offer sets the floor, not the list.
- Current owner paid $18k; list at $50k implies a 178% gain — meaningful room to come down on a strong offer.
Risks & watch-outs
- Climate carrying-cost: extreme-heat days projected 7→20/yr by 2055 (HVAC capex compounding) — expect insurance premiums to compound above CPI over the hold.
Questions for the listing agent
- Built in 1977 — when were the roof, HVAC, electrical panel, plumbing, and water heater last replaced?
- Is there a deadline driving the sale (1031 exchange, divorce, estate, relocation)? That informs how much negotiation room exists.
- Schools are D-rated, which usually means shorter tenancies and higher turnover. Who's the typical renter profile here, and what's been the actual vacancy rate?
- What's the average days-on-market for RENTAL listings here right now (not sales)? A rising rental-DOM trend means longer vacancies and softer asking-rent achievability than the comps imply.
- What's the recent tenant-quality profile in this submarket — average credit score on applications, eviction rate, late-payment / NSF rate, and stable-employment percentage? A property-management company in the area should have these aggregated.
- How much new for-sale + rental construction is in the pipeline within 1–3 miles? Heavy new supply typically softens prices + rents 12–24 months out; constrained supply supports both.
Investment metrics
- 1% rule
- 1.70% ✓
- Cap rate
- 15.16%
- Cash-on-cash
- 31.65%
- DSCR
- 2.41
- GRM
- 4.9
CMA / ARV
- ARV (median comp)
- $61,713
- List price
- $49,999
- Delta
- -2.78%
- Verdict
- FAIR
- Comps
- 1 within 2.0 mi
Projected returns pro-forma
3.0% appreciation · 3.0% rent growth · sell at horizon
- IRR
- 37.4%
- Equity multiple
- 3.11×
- Total profit
- $29,530
- Equity at exit
- $22,482
- IRR
- 37.5%
- Equity multiple
- 6.15×
- Total profit
- $72,149
- Equity at exit
- $34,647
Cash invested: $14,000 (down + closing). Projections, not guarantees.
Landlord ↔ Tenant lean methodology
- Overall (STATE)
- 92 Strongly Landlord-Friendly
- State Arkansas
- 92 Strongly Landlord-Friendly · R+14
- County
- — inherits STATE
- City
- — inherits STATE
ZIP-level market 72324
- Active inventory
- 12
- Price-to-rent
- 4.9×
Monthly cashflow live
- Estimated rent
- $850 medium interval (Pro) →
- Mortgage (P&I)
- −$262
- Tax from tax record
- −$19 /mo · $231/yr
- Insurance
- −$21
- HOA
- −$0
- Vacancy / Maint / Mgmt
- −$179
- Net cashflow
- $369
Break-even live
UW: 25.0% down · 7.5% · 30yr · 1.5% tax · 5.0% vac · 8.0% maint · 8.0% mgmt
Financing live
Cash to close
- Down payment
- $12,500
- Closing costs
- $1,500
- Reserves months
- —
- Total cash needed
- —
Loan-product check · same deal, 3 products live
Conventional
25% down · 7.5% · 30yr
- Down + closing
- —
- Monthly P&I
- —
- Monthly cashflow
- —
- DSCR
- —
- Eligible?
- —
Personal DTI + credit; lowest rate.
DSCR
20% down · 8.5% · 30yr
- Down + closing
- —
- Monthly P&I
- —
- Monthly cashflow
- —
- DSCR
- —
- Eligible?
- —
No personal income docs; deal must DSCR.
Hard money
10% down · 12.0% · 12mo
- Down + closing
- —
- Monthly P&I
- —
- Monthly cashflow
- —
- DSCR
- —
- Eligible?
- —
Short-term bridge; refi at stabilization.
Listing history 18 events
-
2026-06-19days on market $49,999 Active 17 DOM
-
2026-06-18days on market $49,999 Active 16 DOM
-
2026-06-17days on market $49,999 Active 15 DOM
-
2026-06-16days on market $49,999 Active 14 DOM
-
2026-06-15days on market $49,999 Active 13 DOM
-
2026-06-14days on market $49,999 Active 11 DOM
-
2026-06-12days on market $49,999 Active 10 DOM
-
2026-06-09statusdays on market $49,999 Active 7 DOM
-
2026-06-08days on market $49,999 New Listing 6 DOM
-
2026-06-07days on market $49,999 New Listing 5 DOM
-
2026-06-05days on market $49,999 New Listing 3 DOM
-
2026-06-03pricestatusdays on market $49,999 New Listing 1 DOM
-
2026-05-19historical
-
2026-01-17price $59,999
-
2026-01-16price $59,999
-
2025-11-18$64,999 Active
-
2025-11-18$64,999 New Listing
-
1995-01-10soldstatus $18,000
ⓘ Source: listings_history table (triggers on properties + properties_extension) + one-shot
backfill from property_details.listing_events for pre-trigger history.
Tax reassessment forecast AR · Resets to sale price
- Current annual tax
- $231 · $19/mo
- Projected year-2 tax
- $320 · $27/mo
- Expected delta
- +$89/yr (+$7/mo · 38.4%)
ⓘ Screening estimate from a state-policy table — verify with the county assessor before closing.
Climate risk First Street
- Flood 1/10 Low FEMA zone X · 0% chance over 30 yrs
- Wildfire 1/10 Low
- Heat 6/10 Major 7 d/yr ≥109°F today · 20 d/yr by 30 yrs out
- Wind 4/10 Moderate 10% chance of damaging wind over 30 yrs
- Air quality 1/10 Low 0 unhealthy d/yr today · 0 by 30 yrs out
Nearby sold comps map
Loading sold comps map…
Walkable amenities ~0.75 mi
Loading nearby amenities…
Taxation est. · year 1
- Rental income
- $10,201
- − Mortgage interest
- −$2,801
- − Property taxes
- −$231
- − Insurance
- −$250
- − Repairs & maintenance
- −$816
- − Management
- −$816
- − Depreciation
- −$1,455
- Taxable income
- $3,833
- Est. tax owed @ 24.0%
- −$920
- After-tax cash flow
- $3,512/yr
For passive investors: Depreciation is non-cash, so a rental often shows a tax loss while cash-flowing — sheltering income. Rental losses are passive: they offset passive income freely, and up to $25,000/yr can offset ordinary (W-2) income if you actively participate and your MAGI is under $100k (phasing out to $0 by $150k); unused losses carry forward. On sale, claimed depreciation is recaptured at up to 25%, and gains may owe capital-gains tax (a 1031 exchange can defer both). Figures are a year-1 estimate at your 24.0% rate — not tax advice; consult a CPA.
Schools (NCES district)
- District
- Cross County School District
- NCES district ID
- 0507740
- Math proficiency
- 46% ▼ -8.00%
- Reading proficiency
- 52% ▬ 0.00%
- Median HH income
- $35,252
- Composite
- 40.53/100
- National rank
- #3703
- State rank
- #24 of 238 in AR
Livability — Cherry Valley
- Score
- 55/100
- State rank
- #411
- US rank
- #23573
Category grades
Schools grade is shown separately in the Schools card above.
Census & demographics
- Census place
- Cherry Valley, AR
- Population (ZIP)
- 1,951
Population outlook (Cross County) Hauer SSP2
- Today (2025)
- 16,293 people
- By 2030
- 15,636 · -4.0%
- By 2040
- 14,312 · -12.2%
- By 2050
- 13,050 · -19.9%
- By 2075
- 10,362 · -36.4%
- By 2100
- 7,873 · -51.7%
Race, ethnicity, and origin ACS 2023
- Neighborhood character
- Predominantly White (89%)
- Race & ethnicity
- White 89% Two or more races 6% Black 2% Native American 1% Hispanic / Latino 1%
- Common ancestry
- Iranian 2% Lithuanian 1%
- Foreign-born
- 0% · China
Political lean MEDSL · Cross
- 2024 margin
- Solid R (+47.6) · D 25.1% · R 72.7% · Other 2.1%
- 2008→2024 swing
- -22.2pp toward R · 2008: -25.4pp · 2024: -47.6pp
- All cycles
- 2024: R+47.6 2020: R+45.7 2016: R+37.8 2012: R+29.8 2008: R+25.4
Not yet ingested
- Civics
- —
Market trends
- HPI YoY
- —
- Current HPI
- —
- Rent YoY
- —
- Metro
- —
- State GDP YoY
- ▲ 3.80%
- F500 in state
- 10
Industry mix (Fortune 500 HQ in AR)
| Industry | F500 HQs | Revenue |
|---|---|---|
| Retail | 1 | $681B |
|
||
| Food / Agriculture | 1 | $53B |
|
||
| Retail / Energy | 1 | $22B |
|
||
| Transportation / Logistics | 1 | $12B |
|
||
| Energy | 1 | $4B |
|
||
Price history
+233.3% since first listed6 events — show timeline
- 2026-05-19 Listing Removed — CARMLS
- 2026-01-17 Price Changed $59,999 CARMLS
- 2026-01-16 Price Changed $59,999 NEABOR MLS
- 2025-11-18 Listed $64,999 CARMLS
- 2025-11-18 Listed $64,999 NEABOR MLS
- 1995-01-10 Sold (Public Records) $18,000 Public Records
Property tax history
+4.5%/yrLatest (2025): $231 · +9.4% YoY. Source: county tax records.
Cash-flow waterfall
monthlySold comps — $/sqft
last 12 mo · ≤1 miLoading sold comps…