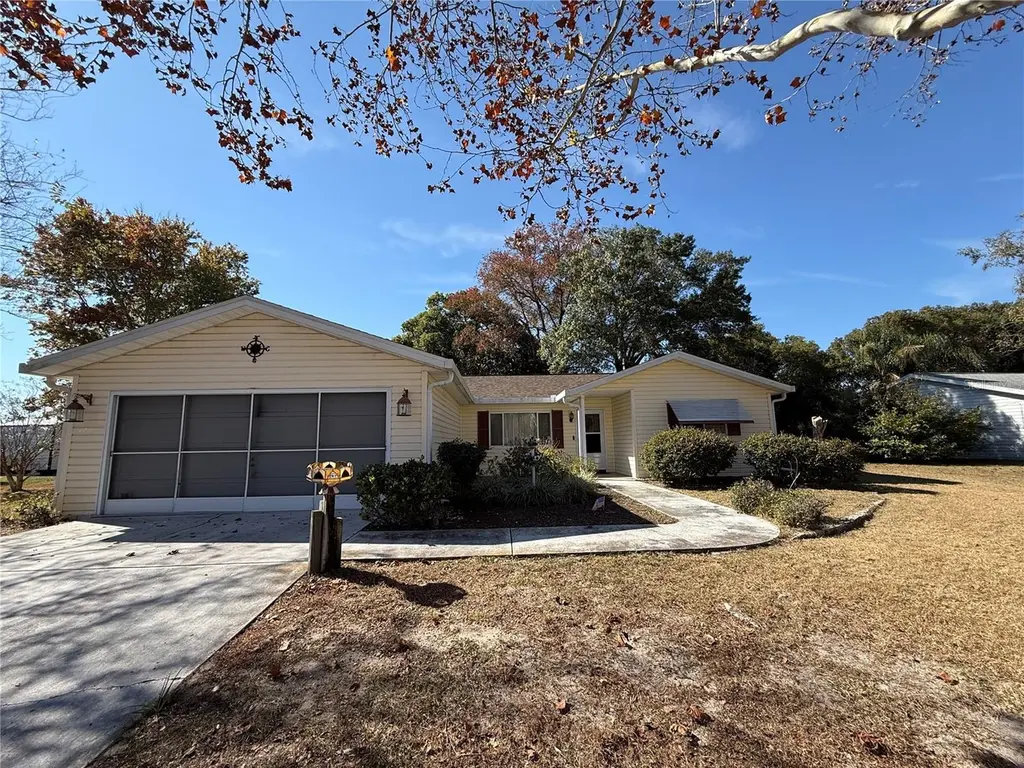
10800 SW 62nd Ave · Liberty Triangle, FL
Flood risk 1/10 · Minimal
- FEMA flood zone
- X (unshaded)
- Chance of flooding over 30 yrs
- 0.0%
- Est. flood insurance / yr
- $507 – $1,088
Fire risk 4/10 · Minor
- Est. fire insurance / yr
- $947 – $1,759
Heat risk 8/10 · Major
- Hot days now (above 108°F)
- 7 days/yr
- Hot days in 30 yrs
- 22 days/yr
Wind risk 9/10 · Severe
- Chance of severe wind over 30 yrs
- 99.0%
Air-quality risk 2/10 · Minimal
- Unhealthy air days now
- 2 days/yr
- Unhealthy air days in 30 yrs
- 2 days/yr
Risk factors via First Street. Map © Google.
Why this score? — see what drove the D grade
The composite is a weighted blend of 9 inputs, each scored 0–100. Each bar is that input's sub-score; the figure is the points it added to the 100-point composite (weight × sub-score).
- Cash flow +14.9/30.0
- ARV discount +6.1/15.0
- 1% rule +4.7/10.0
- DSCR +4.6/10.0
- Schools +3.6/10.0
- Livability +2.5/5.0
- Condition / age +2.5/5.0
- Rent growth +1.9/5.0
- Appreciation +0.0/10.0
$204,900
🖨 Deal sheet 📄 Offer letter ✓ Due diligence
Listing remarks MLS
LOCATION!!! LOCATION!!!Beautiful and well kept Home in a 55+ Community. Located in one of Ocala’s most peaceful and exclusive areas, this charming 3-bedroom, 2-bath residence offers the perfect balance of comfort, style, and tranquility. Enjoy a screened lanai, two-car garage, and access to community amenities including a relaxing pool and lounge areas — ideal for those who value a calm and enjoyable lifestyle. Live stress-free in a community designed for your comfort, featuring a low HOA fee and a serene environment. Don’t miss this wonderful opportunity to live the life you deserve!
Key facts
- Lounge areas
- Community amenities
- Serene environment
Tags
Neighborhood map
What this means for you Summary
Snapshot
- This is a 3-bed/2.0-bath single-family listed at $205k.
Deal economics
- At list price, monthly cash flow is $59 ($711/yr) — positive.
- The deal already cash-flows at list — no discount required.
- To meet the 1% rule (rent ≥ 1% of price), the offer needs to be $198k (3.1% below list).
- Recommended offer: $198k (3.1% below list) — sets the bar for 1% rule.
- Cap rate 6.6% vs local median 4.5% in Liberty Triangle — top-decile yield for the area; either an underpriced asset or a hidden risk that comps aren't pricing in. Stress-test before assuming the spread holds.
Location & tenants
- Location reads: area grade D — affects rentability + tenant quality, not the cash-flow math above.
- Marion (rural): math 42% / reading 43% proficiency, ranked #61 of 73 in FL (top 84%) — families likely to look elsewhere, expect single-tenant / working-renter base with shorter leases; 61% free/reduced lunch — lower-income household profile, screen leases tightly.
- Market conditions: Rents soft (-2.6%/yr); 852 active listings in the ZIP; 8 comparable units currently listed for rent nearby; rentals at typical pace (median 21d on market — plan ~3-4 weeks tenant-placement turnaround); 7,071 units permitted in Marion County in 2024 (534 in 5+ unit buildings).
- This rent runs 36% of the median local income ($66k/yr) — at the standard rent-burdened threshold; future hikes will face affordability resistance.
Forward outlook
- Local home prices are declining (-3.0%/yr); year-one equity from $1k of loan paydown is wiped out by about $6k of value loss. Plan a longer hold.
- Marion County population projected at +13% by 2050 — modest demand growth; plan on rents tracking national, not racing it.
Negotiation context
- Only 13 days on market — expect competitive offers; lowballing is unlikely to land.
- 6 sale attempts since 21y ago; this cycle's ask has dropped $20k (9%) from the opening price — seller is motivated, your offer sets the floor, not the list.
Risks & watch-outs
- Climate carrying-cost: severe wind risk, 99% chance of damaging wind over 30y; extreme-heat days projected 7→22/yr by 2055 (HVAC capex compounding) — expect insurance premiums to compound above CPI over the hold.
Questions for the listing agent
- What does the HOA fee cover, when was the last increase, and are there any pending special assessments or reserve-fund shortfalls?
- Is there a deadline driving the sale (1031 exchange, divorce, estate, relocation)? That informs how much negotiation room exists.
- The area grade is low — what's the realistic commute time and amenity access for the typical tenant pool here? Any planned neighborhood developments (good or bad) we should know about?
- What's the average days-on-market for RENTAL listings here right now (not sales)? A rising rental-DOM trend means longer vacancies and softer asking-rent achievability than the comps imply.
- What's the recent tenant-quality profile in this submarket — average credit score on applications, eviction rate, late-payment / NSF rate, and stable-employment percentage? A property-management company in the area should have these aggregated.
- How much new for-sale + rental construction is in the pipeline within 1–3 miles? Heavy new supply typically softens prices + rents 12–24 months out; constrained supply supports both.
Investment metrics
- 1% rule
- 0.97% ✗
- Cap rate
- 6.64%
- Cash-on-cash
- 1.24%
- DSCR
- 1.06
- GRM
- 8.6
CMA / ARV
- ARV (median comp)
- $198,766
- List price
- $204,900
- Delta
- 7.11%
- Verdict
- FAIR
- Comps
- 20 within 1.0 mi
Show comp detail 12 sales within ~0.75 mi
| Address | Dist | Beds/Ba | Sqft | Sold | Price | $/sf | Match |
|---|---|---|---|---|---|---|---|
| 6002 SW 107th St | 0.20mi | 3/2.0 | 1,478 (-3%) | 2mo | $280,000 | $189 | 84 |
| 5900 SW 111th Place Rd | 0.44mi | 3/2.0 | 1,526 (0%) | 2mo | $235,000 | $154 | 78 |
| 5920 SW 102nd St | 0.64mi | 3/2.0 | 1,495 (-2%) | 2mo | $235,000 | $157 | 65 |
| 10987 SW 69th Cir | 0.53mi | 2/2.0 (-1) | 1,578 (+3%) | 1mo | $257,000 | $163 | 64 |
| 10501 SW 60th Ter | 0.34mi | 3/2.0 | 1,699 (+11%) | 4mo | $224,900 | $132 | 62 |
| 6166 SW 100th Loop | 0.70mi | 3/2.0 | 1,535 (+1%) | 7mo | $174,000 | $113 | 60 |
| 6679 SW 112th St | 0.62mi | 2/2.0 (-1) | 1,596 (+5%) | 6mo | $264,900 | $166 | 53 |
| 13632 SW 61st Cir | 0.51mi | 3/2.0 | 1,445 (-5%) | 19mo | $310,000 | $215 | 52 |
| 6533 SW 107th Pl | 0.38mi | 2/2.0 (-1) | 1,304 (-14%) | 3mo | $172,500 | $132 | 51 |
| 9619 SW 62nd Ct | 0.72mi | 3/2.0 | 1,615 (+6%) | 11mo | $255,490 | $158 | 48 |
| 10151 SW 62nd Terrace Rd | 0.66mi | 3/2.0 | 1,469 (-4%) | 19mo | $237,000 | $161 | 48 |
| 5930 SW 103rd St | 0.54mi | 2/2.0 (-1) | 1,366 (-10%) | 17mo | $220,000 | $161 | 38 |
Match score weights: distance 35% · size 25% · config 20% · recency 20%. Top-matched comps best support the ARV.
Projected returns pro-forma
-3.0% appreciation · 0.0% rent growth · sell at horizon
- IRR
- -17.9%
- Equity multiple
- 0.39×
- Total profit
- $-35,159
- Equity at exit
- $30,551
- IRR
- -17.9%
- Equity multiple
- 0.17×
- Total profit
- $-47,882
- Equity at exit
- $17,716
Cash invested: $57,372 (down + closing). Projections, not guarantees.
Landlord ↔ Tenant lean methodology
- Overall (STATE)
- 87 Strongly Landlord-Friendly
- State Florida
- 87 Strongly Landlord-Friendly · R+3
- County
- — inherits STATE
- City
- — inherits STATE
ZIP-level market 34476
- Rents YoY
- -2.6%
- Active inventory
- 852
- Price-to-rent
- 8.6×
Monthly cashflow live
- Estimated rent
- $1,985 high interval (Pro) →
- Mortgage (P&I)
- −$1,075
- Tax from tax record
- −$231 /mo · $2,770/yr
- Insurance
- −$85
- HOA
- −$118
- Vacancy / Maint / Mgmt
- −$417
- Net cashflow
- $59
Break-even live
UW: 25.0% down · 7.5% · 30yr · 1.5% tax · 5.0% vac · 8.0% maint · 8.0% mgmt
Financing live
Cash to close
- Down payment
- $51,225
- Closing costs
- $6,147
- Reserves months
- —
- Total cash needed
- —
Loan-product check · same deal, 3 products live
Conventional
25% down · 7.5% · 30yr
- Down + closing
- —
- Monthly P&I
- —
- Monthly cashflow
- —
- DSCR
- —
- Eligible?
- —
Personal DTI + credit; lowest rate.
DSCR
20% down · 8.5% · 30yr
- Down + closing
- —
- Monthly P&I
- —
- Monthly cashflow
- —
- DSCR
- —
- Eligible?
- —
No personal income docs; deal must DSCR.
Hard money
10% down · 12.0% · 12mo
- Down + closing
- —
- Monthly P&I
- —
- Monthly cashflow
- —
- DSCR
- —
- Eligible?
- —
Short-term bridge; refi at stabilization.
Rent comps 8 comps
| Address | Beds | Baths | Sqft | Rent | $/sqft | DOM | Units | Dist |
|---|---|---|---|---|---|---|---|---|
| 14173 SW 60th Ter Unit 2 Ocala, FL | 2.0 | 2.0 | 1127 | $1,450 | $1.29 | 21d | 1 | 0.20mi |
| 10912 SW 69th Cir Ocala, FL | 2.0 | 2.0 | 1169 | $1,600 | $1.37 | 21d | 1 | 0.48mi |
| 11302 SW 62nd Cir Ocala, FL | 3.0 | 2.0 | 1526 | $2,095 | $1.37 | 21d | 1 | 0.57mi |
| 6367 SW 117th Street Rd Ocala, FL | 3.0 | 2.0 | 1602 | $2,650 | $1.65 | 21d | 1 | 0.80mi |
| 15062 SW 63rd Ct Ocala, FL | 4.0 | 2.5 | 1560 | $1,850 | $1.19 | 21d | 1 | 0.84mi |
| 6035 SW 98th Street Rd Ocala, FL | 2.0 | 2.0 | 1494 | $1,650 | $1.10 | 13d | 1 | 0.93mi |
| 10417 SW 52nd Ct Ocala, FL | 3.0 | 2.0 | 1577 | $1,995 | $1.27 | 13d | 1 | 1.01mi |
| 10061 SW 74th Ter Ocala, FL | 3.0 | 2.0 | 1894 | $1,995 | $1.05 | 13d | 1 | 1.49mi |
HOA detail
- Monthly dues
- $118 · $1,416/yr
- Likely covers
- pool
Listing history 36 events
-
2026-06-18days on market $204,900 Active 13 DOM
-
2026-06-17days on market $204,900 Active 12 DOM
-
2026-06-16days on market $204,900 Active 11 DOM
-
2026-06-15days on market $204,900 Active 10 DOM
-
2026-06-14days on market $204,900 Active 8 DOM
-
2026-06-13pricedays on market $204,900 Active 7 DOM
-
2026-06-10days on market $212,900 Active 5 DOM
-
2026-06-09days on market $212,900 Active 4 DOM
-
2026-06-08days on market $212,900 Active 3 DOM
-
2026-06-07days on market $212,900 Active 2 DOM
-
2026-06-03days on market $212,900 Active 229 DOM
-
2026-06-02days on market $212,900 Active 228 DOM
-
2026-05-31days on market $212,900 Active 226 DOM
-
2026-05-30days on market $212,900 Active 225 DOM
-
2026-04-24price $212,900 609-char remark
Show marketing remark (609 chars)
LOCATION!!! LOCATION!!!Beautiful and well kept Home in a 55+ Community. Located in one of Ocala’s most peaceful and exclusive areas, this charming 3-bedroom, 2-bath residence offers the perfect balance of comfort, style, and tranquility. Enjoy a screened lanai, two-car garage, and access to community amenities including a relaxing pool and lounge areas — ideal for those who value a calm and enjoyable lifestyle. Live stress-free in a community designed for your comfort, featuring a low HOA fee and a serene environment. Don’t miss this wonderful opportunity to live the life you deserve!
-
2025-11-22price $217,000 609-char remark
Show marketing remark (609 chars)
LOCATION!!! LOCATION!!!Beautiful and well kept Home in a 55+ Community. Located in one of Ocala’s most peaceful and exclusive areas, this charming 3-bedroom, 2-bath residence offers the perfect balance of comfort, style, and tranquility. Enjoy a screened lanai, two-car garage, and access to community amenities including a relaxing pool and lounge areas — ideal for those who value a calm and enjoyable lifestyle. Live stress-free in a community designed for your comfort, featuring a low HOA fee and a serene environment. Don’t miss this wonderful opportunity to live the life you deserve!
-
2025-10-18$225,000 Active 609-char remark
Show marketing remark (609 chars)
LOCATION!!! LOCATION!!!Beautiful and well kept Home in a 55+ Community. Located in one of Ocala’s most peaceful and exclusive areas, this charming 3-bedroom, 2-bath residence offers the perfect balance of comfort, style, and tranquility. Enjoy a screened lanai, two-car garage, and access to community amenities including a relaxing pool and lounge areas — ideal for those who value a calm and enjoyable lifestyle. Live stress-free in a community designed for your comfort, featuring a low HOA fee and a serene environment. Don’t miss this wonderful opportunity to live the life you deserve!
-
2025-09-16historical
-
2025-06-27price $215,000
-
2025-05-08price $225,000
-
2025-01-21historical
-
2025-01-16$229,999 Active
-
2025-01-16$229,999 Active
-
2024-03-11soldstatus $192,000
-
2024-03-08soldstatus $192,000 Closed
-
2024-02-19status Pending
-
2024-01-22price $199,000
-
2024-01-22$19,900 Active
-
2023-12-08price $210,000
-
2023-11-20$215,000 Active
-
2005-05-24soldstatus $128,000
-
2005-05-16soldstatus $128,000
-
2005-01-30$128,000
-
2002-04-15soldstatus $80,000
-
1997-05-15soldstatus $67,000
-
1990-09-01soldstatus $66,300
ⓘ Source: listings_history table (triggers on properties + properties_extension) + one-shot
backfill from property_details.listing_events for pre-trigger history.
Tax reassessment forecast FL · Resets to sale price
- Current annual tax
- $2,770 · $231/mo
- Projected year-2 tax
- $2,770 · $231/mo
- Expected delta
- $0/yr ($0/mo · 0.0%)
ⓘ Screening estimate from a state-policy table — verify with the county assessor before closing.
Climate risk First Street
- Flood 1/10 Low FEMA zone X (unshaded) · 0% chance over 30 yrs
- Wildfire 4/10 Moderate
- Heat 8/10 Severe 7 d/yr ≥108°F today · 22 d/yr by 30 yrs out
- Wind 9/10 Extreme 99% chance of damaging wind over 30 yrs
- Air quality 2/10 Low 2 unhealthy d/yr today · 2 by 30 yrs out
Nearby sold comps map
Loading sold comps map…
Walkable amenities ~0.75 mi
Loading nearby amenities…
Taxation est. · year 1
- Rental income
- $23,817
- − Mortgage interest
- −$11,478
- − Property taxes
- −$2,770
- − Insurance
- −$1,024
- − Repairs & maintenance
- −$1,905
- − Management
- −$1,905
- − HOA
- −$1,416
- − Depreciation
- −$5,961
- Taxable loss
- −$2,642
- Est. tax savings @ 24.0%
- +$634
- After-tax cash flow
- $1,345/yr
For passive investors: Depreciation is non-cash, so a rental often shows a tax loss while cash-flowing — sheltering income. Rental losses are passive: they offset passive income freely, and up to $25,000/yr can offset ordinary (W-2) income if you actively participate and your MAGI is under $100k (phasing out to $0 by $150k); unused losses carry forward. On sale, claimed depreciation is recaptured at up to 25%, and gains may owe capital-gains tax (a 1031 exchange can defer both). Figures are a year-1 estimate at your 24.0% rate — not tax advice; consult a CPA.
Schools (NCES district)
- District
- Marion
- NCES district ID
- 1201260
- Math proficiency
- 42% ▼ -7.00%
- Reading proficiency
- 43% ▼ -4.00%
- Median HH income
- $40,015
- Composite
- 35.61/100
- National rank
- #4890
- State rank
- #61 of 73 in FL
Livability — Liberty Triangle
No livability data for this city. (Only ~50 U.S. cities are tracked.)
Census & demographics
- Census place
- Liberty Triangle, FL
- County
- Marion County · 315,796 people
- City population
- 25,668
- Metro
- Ocala, FL
- Population (ZIP)
- 28,997
- Household income
- $65,860
- Rent vs Own
- Severe rent burden
- 204.0
Population outlook (Marion County) Hauer SSP2
- Today (2025)
- 365,905 people
- By 2030
- 376,768 · +3.0%
- By 2040
- 396,555 · +8.4%
- By 2050
- 412,723 · +12.8%
- By 2075
- 446,090 · +21.9%
- By 2100
- 436,193 · +19.2%
Race, ethnicity, and origin ACS 2023
- Neighborhood character
- Diverse neighborhood (Simpson 0.55)
- Race & ethnicity
- White 63% Hispanic / Latino 18% Black 13% Two or more races 10% Asian 1%
- Hispanic origin (detail)
- Mexican 3% Puerto Rican 8% Cuban 3%
- Common ancestry
- Romanian 3% Slovak 3% Lithuanian 3%
- Foreign-born
- 15% · Canada, Jamaica, Dominican Republic
- Languages at home
- 83% English-only · Spanish 14% Other Indo-European 1% German/W. Germanic 1%
Political lean MEDSL · Marion
- 2024 margin
- Solid R (+31.6) · D 33.8% · R 65.5%
- 2008→2024 swing
- -20.0pp toward R · 2008: -11.6pp · 2024: -31.6pp
- All cycles
- 2024: R+31.6 2020: R+25.9 2016: R+26.2 2012: R+16.2 2008: R+11.6
Not yet ingested
- Civics
- —
Market trends
- HPI YoY
- ▼ -105.22%
- Current HPI
- 189.0869
- Rent YoY
- ▼ -2.57%
- Metro
- Ocala, FL
- State GDP YoY
- ▲ 3.28%
- F500 in state
- 36
Industry mix (Fortune 500 HQ in FL)
| Industry | F500 HQs | Revenue |
|---|---|---|
| Industrial Technology | 2 | $29B |
|
||
| Insurance | 2 | $17B |
|
||
| Retail | 1 | $60B |
|
||
| Technology Distribution | 1 | $58B |
|
||
| Homebuilding | 1 | $35B |
|
||
| Technology Manufacturing | 1 | $35B |
|
||
Price history
+221.1% since first listed22 events — show timeline
- 2026-04-24 Price Changed $212,900 Stellar MLS as Distributed by MLS Grid
- 2025-11-22 Price Changed $217,000 Stellar MLS as Distributed by MLS Grid
- 2025-10-18 Listed $225,000 Stellar MLS as Distributed by MLS Grid
- 2025-09-16 Listing Removed — Stellar MLS as Distributed by MLS Grid
- 2025-06-27 Price Changed $215,000 Stellar MLS as Distributed by MLS Grid
- 2025-05-08 Price Changed $225,000 Stellar MLS as Distributed by MLS Grid
- 2025-01-21 Listing Removed — Stellar MLS as Distributed by MLS Grid
- 2025-01-16 Listed $229,999 Stellar MLS as Distributed by MLS Grid
- 2025-01-16 Listed $229,999 Stellar MLS as Distributed by MLS Grid
- 2024-03-11 Sold (Public Records) $192,000 Public Records
- 2024-03-08 Sold (MLS) $192,000 Stellar MLS as Distributed by MLS Grid
- 2024-02-19 Pending — Stellar MLS as Distributed by MLS Grid
- 2024-01-22 Price Changed $199,000 Stellar MLS as Distributed by MLS Grid
- 2024-01-22 Listed $19,900 Stellar MLS as Distributed by MLS Grid
- 2023-12-08 Price Changed $210,000 Stellar MLS as Distributed by MLS Grid
- 2023-11-20 Listed $215,000 Stellar MLS as Distributed by MLS Grid
- 2005-05-24 Sold (Public Records) $128,000 Public Records
- 2005-05-16 Sold (MLS) $128,000 Stellar MLS as Distributed by MLS Grid
- 2005-01-30 Listed $128,000 Stellar MLS as Distributed by MLS Grid
- 2002-04-15 Sold (Public Records) $80,000 Public Records
- 1997-05-15 Sold (Public Records) $67,000 Public Records
- 1990-09-01 Sold (Public Records) $66,300 Public Records
Property tax history
+13.4%/yrLatest (2025): $2,770 · -21.4% YoY. Source: county tax records.
Cash-flow waterfall
monthlySold comps — $/sqft
last 12 mo · ≤1 miLoading sold comps…