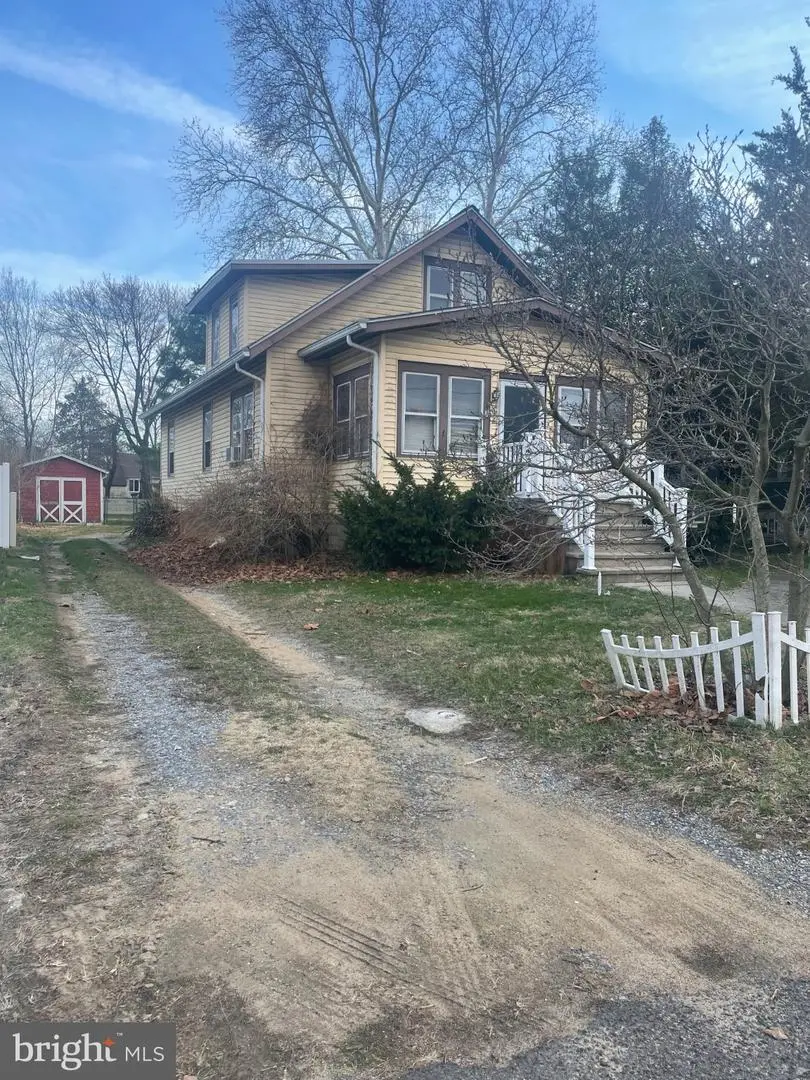
126 Thomas Ave · Cherry Hill Mall, NJ
Flood risk 1/10 · Minimal
- FEMA flood zone
- X (unshaded)
- Chance of flooding over 30 yrs
- 0.0%
- Est. flood insurance / yr
- $507 – $1,088
Fire risk 1/10 · Minimal
- Est. fire insurance / yr
- $526 – $976
Heat risk 6/10 · Moderate
- Hot days now (above 104°F)
- 7 days/yr
- Hot days in 30 yrs
- 15 days/yr
Wind risk 6/10 · Moderate
- Chance of severe wind over 30 yrs
- 49.0%
Air-quality risk 4/10 · Minor
- Unhealthy air days now
- 4 days/yr
- Unhealthy air days in 30 yrs
- 6 days/yr
Risk factors via First Street. Map © Google.
Why this score? — see what drove the C- grade
The composite is a weighted blend of 9 inputs, each scored 0–100. Each bar is that input's sub-score; the figure is the points it added to the 100-point composite (weight × sub-score).
- Cash flow +16.1/30.0
- ARV discount +15.0/15.0
- 1% rule +5.2/10.0
- DSCR +5.0/10.0
- Livability +4.0/5.0
- Rent growth +3.5/5.0
- Condition / age +2.5/5.0
- Schools +1.8/10.0
- Appreciation +0.0/10.0
$285,000
🖨 Deal sheet (PDF) 📄 Offer letter ✓ Due diligence
Key facts
- Garage
- Built 1928
- Listed 56 days
Property features AI
Finance
- Other: Fee simple ownership; Not located in a federal flood zone; Pets allowed with no restrictions
Exterior
- Parking: Detached garage (front entry) with 1 garage space; Driveway with space for 2 vehicles; Additional on-street parking; Total of 3 garage and parking spaces
- Utilities: Public water; Public sewer
- Home design: Detached property; Major rehab needed / below average condition
- Construction: Aluminum siding; Block construction; Block foundation; Estimated year built
- Exterior features: Detached structure; No tidal water on lot; Above-grade other structures
Interior
- Bedrooms: 2 bedrooms on the main level; 2 bedrooms on the upper level
- Flooring: Wood floors; Carpet
- Bathrooms: 1 full bathroom (main level)
- Heating & cooling: Radiator heating (natural gas); Wall-mounted electric cooling units; Natural gas hot water
- Interior features: Attic; Tub with shower; Combination dining and living area; Traditional floor plan; Wood floors; Carpet
- Laundry & utility: Laundry room
Neighborhood map
What this means for you Summary
Snapshot
- This is a 4-bed/1.0-bath single-family listed at $285k.
Deal economics
- At list price, monthly cash flow is $146 ($2k/yr) — positive.
- The deal already cash-flows at list — no discount required.
- Meets the 1% rule at list price ($3k rent vs $285k).
- Recommended offer: $276k (3.0% below list) — sets the bar for market timing.
- Cap rate 6.9% vs local median 4.0% in Cherry Hill Mall — top-decile yield for the area; either an underpriced asset or a hidden risk that comps aren't pricing in. Stress-test before assuming the spread holds.
Location & tenants
- Location reads 79/100 on livability (#87 in NJ, #2,267 nationally) — a middle-class / working-renter tenant base. Strengths: employment A+, housing A+, health & safety B+; Watch: commute F, cost of living F.
- Maple Shade School District (suburban): math 8% / reading 32% proficiency, ranked #428 of 472 in NJ (top 91%) — low school quality limits family demand, transient renter base, plan for 1-2y turnover.
- Zoned schools: Howard Yocum Elementary (568 students, 42% FRL); Ralph J. Steinhauer Elementary School (math 9% / reading 29%, grade F, #401 of 431 statewide, top 93%, 350 students, 44% FRL); Maple Shade High School (math 9% / reading 37%, grade F, #337 of 399 statewide, top 85%, 931 students, 42% FRL).
- Market conditions: Rents rising (+3.9%/yr); 68 active listings in the ZIP; 5 comparable units currently listed for rent nearby; rentals leasing fast (median 7d on market — plan ~1-2 weeks tenant-placement turnaround); solid renter incomes; 2,161 units permitted in Burlington County in 2024 (988 in 5+ unit buildings).
- This rent runs 44% of the median local income ($79k/yr) — at the standard rent-burdened threshold; future hikes will face affordability resistance.
Forward outlook
- Local home prices are declining (-3.0%/yr); year-one equity from $2k of loan paydown is wiped out by about $9k of value loss. Plan a longer hold.
- Burlington County population projected to shrink 5% by 2050 — rents likely to lag national; underwrite the cash flow, not the appreciation.
Negotiation context
- It's been on market 57 days — a 3% lower offer ($276k) is reasonable based on typical stale-listing flexibility.
- Current owner paid $23k; list at $285k implies a 1139% gain — meaningful room to come down on a strong offer.
Risks & watch-outs
- Watch-outs: built in 1928 — expect roof / HVAC / electrical / plumbing capex.
- Climate carrying-cost: major wind risk, 49% chance of damaging wind over 30y; extreme-heat days projected 7→15/yr by 2055 (HVAC capex compounding) — expect insurance premiums to compound above CPI over the hold.
Questions for the listing agent
- It's been on market 57 days. Have you received any prior offers? Is the seller open to a 3% concession, seller financing, or rate buy-down credit?
- Built in 1928 — when were the roof, HVAC, electrical panel, plumbing, and water heater last replaced?
- Is there a deadline driving the sale (1031 exchange, divorce, estate, relocation)? That informs how much negotiation room exists.
- Schools are B-rated — typically a magnet for longer-tenancy family renters. What's the average tenant stay here, and is there a school-zone premium baked into asking?
- What's the average days-on-market for RENTAL listings here right now (not sales)? A rising rental-DOM trend means longer vacancies and softer asking-rent achievability than the comps imply.
- What's the recent tenant-quality profile in this submarket — average credit score on applications, eviction rate, late-payment / NSF rate, and stable-employment percentage? A property-management company in the area should have these aggregated.
- How much new for-sale + rental construction is in the pipeline within 1–3 miles? Heavy new supply typically softens prices + rents 12–24 months out; constrained supply supports both.
Investment metrics
- 1% rule
- 1.02% ✓
- Cap rate
- 6.91%
- Cash-on-cash
- 2.20%
- DSCR
- 1.10
- GRM
- 8.2
CMA / ARV
- ARV (on-the-fly)
- $385,825
- Comps found
- 12
Show comp detail 12 sales within ~0.75 mi
| Address | Dist | Beds/Ba | Sqft | Sold | Price | $/sf | Match |
|---|---|---|---|---|---|---|---|
| 311 W Gradwell Ave | 0.17mi | 3/1.0 (-1) | 1,399 (-0%) | 1mo | $384,900 | $275 | 86 |
| 21 Paul Rd | 0.35mi | 4/2.0 | 1,334 (-5%) | 1mo | $355,000 | $266 | 70 |
| 66 W Center Ave | 0.22mi | 3/2.0 (-1) | 1,492 (+6%) | 1mo | $385,000 | $258 | 69 |
| 47 S Lippincott Ave | 0.24mi | 3/2.0 (-1) | 1,324 (-6%) | 3mo | $410,000 | $310 | 68 |
| 427 Cutler Ave | 0.27mi | 3/2.0 (-1) | 1,300 (-7%) | 2mo | $360,000 | $277 | 64 |
| 2 Gainor Ave | 0.27mi | 3/2.0 (-1) | 1,497 (+7%) | 4mo | $370,000 | $247 | 64 |
| 35 Farnsworth Ave | 0.30mi | 3/1.5 (-1) | 1,544 (+10%) | 2mo | $435,000 | $282 | 61 |
| 120 E Center Ave | 0.38mi | 3/1.5 (-1) | 1,609 (+15%) | 4mo | $380,000 | $236 | 47 |
| 42 Spruce Ave | 0.45mi | 3/2.0 (-1) | 1,216 (-13%) | 2mo | $375,000 | $308 | 46 |
| 452 Elm Ave | 0.64mi | 3/2.0 (-1) | 1,574 (+12%) | 3mo | $410,000 | $260 | 39 |
| 104 E Laurelton Ave | 0.73mi | 4/2.5 | 1,550 (+10%) | 5mo | $449,000 | $290 | 38 |
| 301 N Coles Ave | 0.68mi | 3/1.5 (-1) | 1,608 (+15%) | 6mo | $390,000 | $243 | 32 |
Match score weights: distance 35% · size 25% · config 20% · recency 20%. Top-matched comps best support the ARV.
Projected returns pro-forma
-3.0% appreciation · 3.9% rent growth · sell at horizon
- IRR
- -11.7%
- Equity multiple
- 0.57×
- Total profit
- $-34,084
- Equity at exit
- $42,494
- IRR
- -1.1%
- Equity multiple
- 0.92×
- Total profit
- $-6,042
- Equity at exit
- $24,642
Cash invested: $79,800 (down + closing). Projections, not guarantees.
Landlord ↔ Tenant lean methodology
- Overall (STATE)
- 21 Tenant-Leaning
- State New Jersey
- 21 Tenant-Leaning · D+6
- County
- — inherits STATE
- City
- — inherits STATE
ZIP-level market 08052
- Rents YoY
- 3.9%
- Active inventory
- 68
- Price-to-rent
- 8.2×
Monthly cashflow live
- Estimated rent
- $2,894 high interval (Pro) →
- Mortgage (P&I)
- −$1,495
- Tax from tax record
- −$527 /mo · $6,325/yr
- Insurance
- −$119
- HOA
- −$0
- Vacancy / Maint / Mgmt
- −$608
- Net cashflow
- $146
Break-even live
Sensitivity live
| Price | -10% $307 | -5% $227 | +0% $146 | +5% $65 | +10% $-15 |
|---|---|---|---|---|---|
| Rent | -10% $-83 | -5% $32 | +0% $146 | +5% $260 | +10% $375 |
| Rate | -1.0pp $290 | -0.5pp $219 | base $146 | +0.5pp $72 | +1.0pp $-3 |
UW: 25.0% down · 7.5% · 30yr · 1.5% tax · 5.0% vac · 8.0% maint · 8.0% mgmt
Financing live
Cash to close
- Down payment
- $71,250
- Closing costs
- $8,550
- Reserves months
- —
- Total cash needed
- —
Loan-product check · same deal, 3 products live
Conventional
25% down · 7.5% · 30yr
- Down + closing
- —
- Monthly P&I
- —
- Monthly cashflow
- —
- DSCR
- —
- Eligible?
- —
Personal DTI + credit; lowest rate.
DSCR
20% down · 8.5% · 30yr
- Down + closing
- —
- Monthly P&I
- —
- Monthly cashflow
- —
- DSCR
- —
- Eligible?
- —
No personal income docs; deal must DSCR.
Hard money
10% down · 12.0% · 12mo
- Down + closing
- —
- Monthly P&I
- —
- Monthly cashflow
- —
- DSCR
- —
- Eligible?
- —
Short-term bridge; refi at stabilization.
Rent comps 5 comps
| Address | Beds | Baths | Sqft | Rent | $/sqft | DOM | Units | Dist |
|---|---|---|---|---|---|---|---|---|
| 1 Burroughs Mill Cir Cherry Hill, NJ | 1.0–3.0 | 1.0–2.5 | 1142 | $3,493 | $3.06 | 0d | 23 | 0.73mi |
| 836 Cooper Landing Rd Cherry Hill, NJ | 3.0 | 1.0–2.0 | 901 | $2,925 | $3.25 | 0d | 16 | 0.85mi |
| 100 Fox Meadow Dr Maple Shade, NJ | 1.0–3.0 | 1.0 | 780 | $2,235 | $2.87 | 7d | 13 | 1.08mi |
| 715 Cooper Landing Rd Cherry Hill, NJ | 3.0 | 2.0 | 1334 | $3,100 | $2.32 | 45d | 1 | 1.25mi |
| 733 N Lenola Rd Moorestown, NJ | 3.0 | 2.0 | 1150 | $2,600 | $2.26 | 21d | 1 | 1.50mi |
Listing history 19 events
-
2026-06-21days on market $285,000 Active 57 DOM
-
2026-06-18days on market $285,000 Active 54 DOM
-
2026-06-17days on market $285,000 Active 53 DOM
-
2026-06-16days on market $285,000 Active 52 DOM
-
2026-06-15days on market $285,000 Active 51 DOM
-
2026-06-13days on market $285,000 Active 49 DOM
-
2026-06-13days on market $285,000 Active 48 DOM
-
2026-06-09days on market $285,000 Active 45 DOM
-
2026-06-08days on market $285,000 Active 44 DOM
-
2026-06-07days on market $285,000 Active 43 DOM
-
2026-06-04days on market $285,000 Active 40 DOM
-
2026-06-03days on market $285,000 Active 39 DOM
-
2026-06-02days on market $285,000 Active 38 DOM
-
2026-06-01days on market $285,000 Active 37 DOM
-
2026-05-31days on market $285,000 Active 36 DOM
-
2026-04-26status Active
-
2026-04-10historical
-
2026-03-23historical $285,000
-
1978-01-01soldstatus $23,000
ⓘ Source: listings_history table (triggers on properties + properties_extension) + one-shot
backfill from property_details.listing_events for pre-trigger history.
Tax reassessment forecast NJ · Partial reset (capped growth)
- Current annual tax
- $6,325 · $527/mo
- Projected year-2 tax
- $6,711 · $559/mo
- Expected delta
- +$386/yr (+$32/mo · 6.1%)
ⓘ Screening estimate from a state-policy table — verify with the county assessor before closing.
Climate risk First Street
- Flood 1/10 Low FEMA zone X (unshaded) · 0% chance over 30 yrs
- Wildfire 1/10 Low
- Heat 6/10 Major 7 d/yr ≥104°F today · 15 d/yr by 30 yrs out
- Wind 6/10 Major 49% chance of damaging wind over 30 yrs
- Air quality 4/10 Moderate 4 unhealthy d/yr today · 6 by 30 yrs out
Nearby sold comps map
Loading sold comps map…
Walkable amenities ~0.75 mi
Loading nearby amenities…
Taxation est. · year 1
- Rental income
- $34,732
- − Mortgage interest
- −$15,964
- − Property taxes
- −$6,325
- − Insurance
- −$1,425
- − Repairs & maintenance
- −$2,779
- − Management
- −$2,779
- − Depreciation
- −$8,291
- Taxable loss
- −$2,831
- Est. tax savings @ 24.0%
- +$679
- After-tax cash flow
- $2,433/yr
For passive investors: Depreciation is non-cash, so a rental often shows a tax loss while cash-flowing — sheltering income. Rental losses are passive: they offset passive income freely, and up to $25,000/yr can offset ordinary (W-2) income if you actively participate and your MAGI is under $100k (phasing out to $0 by $150k); unused losses carry forward. On sale, claimed depreciation is recaptured at up to 25%, and gains may owe capital-gains tax (a 1031 exchange can defer both). Figures are a year-1 estimate at your 24.0% rate — not tax advice; consult a CPA.
Schools (NCES district)
- District
- Maple Shade School District
- NCES district ID
- 3409660
- Math proficiency
- 8% ▼ -16.00%
- Reading proficiency
- 32% ▼ -8.00%
- Median HH income
- $55,213
- Composite
- 18.31/100
- National rank
- #8952
- State rank
- #428 of 472 in NJ
Livability — Cherry Hill Mall
- Score
- 79/100
- State rank
- #87
- US rank
- #2267
Category grades
Schools grade is shown separately in the Schools card above.
Census & demographics
- County
- Burlington County · 323,710 people
- City population
- 23,574
- Metro
- Philadelphia-Camden-Wilmington, PA-NJ-DE-MD
- Population (ZIP)
- 20,127
- Household income
- $79,087
- Rent vs Own
- Severe rent burden
- 1366.0
Population outlook (Burlington County) Hauer SSP2
- Today (2025)
- 453,425 people
- By 2030
- 452,359 · -0.2%
- By 2040
- 445,033 · -1.9%
- By 2050
- 431,760 · -4.8%
- By 2075
- 406,277 · -10.4%
- By 2100
- 364,732 · -19.6%
Race, ethnicity, and origin ACS 2023
- Neighborhood character
- Diverse neighborhood (Simpson 0.56)
- Race & ethnicity
- White 64% Hispanic / Latino 12% Black 9% Asian 8% Two or more races 8%
- Hispanic origin (detail)
- Mexican 1% Puerto Rican 4% Dominican 3%
- Common ancestry
- Romanian 6% Lithuanian 3% Scotch-Irish 2%
- Foreign-born
- 12% · Canada, South Korea, China
- Languages at home
- 82% English-only · Spanish 7% Other Indo-European 4% Other Asian/Pacific 2%
Political lean MEDSL · Burlington
- 2024 margin
- D (+16.6) · D 57.6% · R 41.0% · Other 1.3%
- 2008→2024 swing
- -2.0pp toward R · 2008: 18.6pp · 2024: 16.6pp
- All cycles
- 2024: D+16.6 2020: D+19.5 2016: D+14.8 2012: D+18.7 2008: D+18.6
Not yet ingested
- Civics
- —
Market trends
- HPI YoY
- ▼ -158.10%
- Current HPI
- 285.9677
- Rent YoY
- ▲ 3.90%
- Metro
- Philadelphia-Camden-Wilmington, PA-NJ-DE-MD
- State GDP YoY
- ▲ 2.05%
- F500 in state
- 34
Industry mix (Fortune 500 HQ in NJ)
| Industry | F500 HQs | Revenue |
|---|---|---|
| Consumer Goods | 3 | $31B |
|
||
| Pharmaceuticals | 2 | $153B |
|
||
| Technology | 2 | $21B |
|
||
| Insurance | 2 | $20B |
|
||
| Healthcare | 2 | $19B |
|
||
| Financial Services | 1 | $70B |
|
||
Price history
+1139.1% since first listed4 events — show timeline
- 2026-04-26 Relisted — BRIGHT MLS
- 2026-04-10 Listing Removed — BRIGHT MLS
- 2026-03-23 Coming Soon $285,000 BRIGHT MLS
- 1978-01-01 Sold (Public Records) $23,000 Public Records
Property tax history
+2.2%/yrLatest (2025): $6,325 · +4.3% YoY. Source: county tax records.
Cash-flow waterfall
monthlySold comps — $/sqft
last 12 mo · ≤1 miLoading sold comps…