124 Darby Dr · Fredericksburg, TX
Flood risk No data
- FEMA flood zone
- —
- Chance of flooding over 30 yrs
- —
- Est. flood insurance / yr
- —
Fire risk No data
- Est. fire insurance / yr
- —
Heat risk No data
- Hot days now (above threshold)
- —
- Hot days in 30 yrs
- —
Wind risk No data
- Chance of severe wind over 30 yrs
- —
Air-quality risk No data
- Unhealthy air days now
- —
- Unhealthy air days in 30 yrs
- —
Risk factors via First Street. Map © Google.
Why this score? — see what drove the D grade
The composite is a weighted blend of 9 inputs, each scored 0–100. Each bar is that input's sub-score; the figure is the points it added to the 100-point composite (weight × sub-score).
- ARV discount +15.0/15.0
- Cash flow +7.9/30.0
- Schools +4.0/10.0
- Livability +3.7/5.0
- 1% rule +2.5/10.0
- Rent growth +2.5/5.0
- Condition / age +2.5/5.0
- DSCR +2.0/10.0
- Appreciation +0.0/10.0
$310,999
🖨 Deal sheet (PDF) 📄 Offer letter ✓ Due diligence
Listing remarks MLS
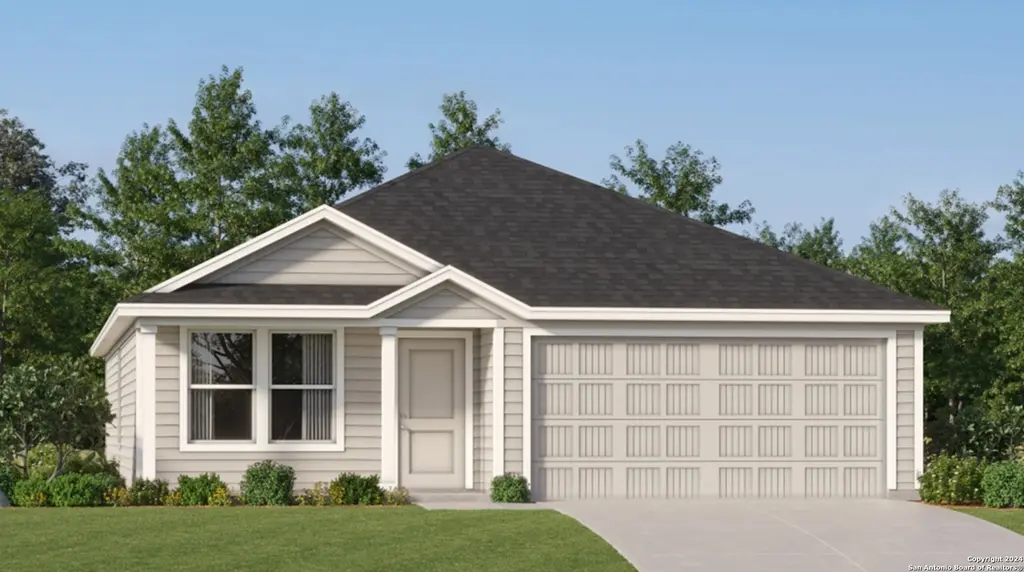
The Newlin - This single-level home showcases a spacious open floorplan shared between the kitchen, dining area and family room for easy entertaining. An owner's suite enjoys a private location in a rear corner of the home, complemented by an en-suite bathroom and walk-in closet. There are two secondary bedrooms at the front of the home. Estimated COE July 2025. Prices and features may vary and are subject to change. Photos are for illustrative purposes only.
Key facts
- Walk-in closet
- Open floorplan
- En-suite bathroom
Tags
Neighborhood map
What this means for you Summary
Snapshot
- This is a 3-bed/2.0-bath single-family listed at $311k.
Deal economics
- At list price, monthly cash flow is $-331 ($-4k/yr) — negative.
- To cash-flow at today's rent, offer at most $263k (15.4% below list).
- To meet the 1% rule (rent ≥ 1% of price), the offer needs to be $234k (24.8% below list).
- Recommended offer: $234k (24.8% below list) — sets the bar for 1% rule.
- Cap rate 5.0% vs local median 1.7% in Fredericksburg — top-decile yield for the area; either an underpriced asset or a hidden risk that comps aren't pricing in. Stress-test before assuming the spread holds.
Location & tenants
- Location reads 74/100 on livability (#182 in TX, #4,711 nationally) — a middle-class / working-renter tenant base. Strengths: crime A+, health & safety B+, cost of living B; Watch: employment C-, amenities D, commute F.
- Fredericksburg ISD (town): math 44% / reading 48% proficiency, ranked #241 of 826 in TX (top 29%) — families likely to look elsewhere, expect single-tenant / working-renter base with shorter leases.
- Zoned schools: Fredericksburg El (math 40% / reading 45%, grade F, #1,313 of 4,322 statewide, top 31%, 744 students, 67% FRL); Fredericksburg Middle (math 51% / reading 46%, grade C-, #392 of 1,662 statewide, top 24%, 684 students, 58% FRL); Fredericksburg H S (math 33% / reading 57%, grade D-, #643 of 1,632 statewide, top 40%, 1,003 students, 48% FRL).
- Market conditions: 978 active listings in the ZIP; 18 comparable units currently listed for rent nearby; rentals at typical pace (median 26d on market — plan ~3-4 weeks tenant-placement turnaround); solid renter incomes; 52 units permitted in Gillespie County in 2024 (0 in 5+ unit buildings).
- This rent runs 37% of the median local income ($75k/yr) — at the standard rent-burdened threshold; future hikes will face affordability resistance.
Forward outlook
- Local home prices are declining (-3.0%/yr); year-one equity from $2k of loan paydown is wiped out by about $9k of value loss. Plan a longer hold.
- Gillespie County population projected at +16% by 2050 — long-run rental-demand tailwind backs the buy-and-hold thesis.
Negotiation context
- It's been on market 404 days — a 12% lower offer ($274k) is reasonable based on typical stale-listing flexibility.
Questions for the listing agent
- What do current leases actually rent for vs. the listed asking? Can we see a recent rent roll and the last 12 months of T-12 income?
- It's been on market 404 days. Have you received any prior offers? Is the seller open to a 25% concession, seller financing, or rate buy-down credit?
- What does the HOA fee cover, when was the last increase, and are there any pending special assessments or reserve-fund shortfalls?
- Why hasn't it sold? Are there any deal-killer items the seller is aware of (foundation, flood, title, zoning, code violations)?
- Is there a deadline driving the sale (1031 exchange, divorce, estate, relocation)? That informs how much negotiation room exists.
- The area grade is low — what's the realistic commute time and amenity access for the typical tenant pool here? Any planned neighborhood developments (good or bad) we should know about?
- What's the average days-on-market for RENTAL listings here right now (not sales)? A rising rental-DOM trend means longer vacancies and softer asking-rent achievability than the comps imply.
- What's the recent tenant-quality profile in this submarket — average credit score on applications, eviction rate, late-payment / NSF rate, and stable-employment percentage? A property-management company in the area should have these aggregated.
- How much new for-sale + rental construction is in the pipeline within 1–3 miles? Heavy new supply typically softens prices + rents 12–24 months out; constrained supply supports both.
Investment metrics
- 1% rule
- 0.75% ✗
- Cap rate
- 5.01%
- Cash-on-cash
- -4.57%
- DSCR
- 0.80
- GRM
- 11.1
CMA / ARV
- ARV (median comp)
- $478,714
- List price
- $310,999
- Delta
- -35.03%
- Verdict
- UNDERPRICED
- Comps
- 20 within 1.0 mi
Show comp detail 12 sales within ~0.75 mi
| Address | Dist | Beds/Ba | Sqft | Sold | Price | $/sf | Match |
|---|---|---|---|---|---|---|---|
| 111 Darby Dr | 0.00mi | 3/2.0 | 1,474 (0%) | 13mo | $307,999 | $209 | 89 |
| 107 Darby Dr | 0.14mi | 3/2.0 | 1,474 (0%) | 13mo | $287,999 | $195 | 83 |
| 101 Darby Dr | 0.14mi | 3/2.0 | 1,474 (0%) | 14mo | $310,999 | $211 | 82 |
| 119 W Creek St | 0.21mi | 3/4.0 | 1,468 (-0%) | 10mo | $675,000 | $460 | 73 |
| 100 Ellendale Pl | 0.00mi | 4/2.0 (+1) | 1,667 (+13%) | 6mo | $314,999 | $189 | 68 |
| 122 Lilli's Ln | 0.27mi | 3/2.0 | 1,650 (+12%) | 5mo | $349,950 | $212 | 63 |
| 611 N Adams St | 0.50mi | 3/2.0 | 1,600 (+8%) | 3mo | $544,900 | $341 | 60 |
| 413 1/2 S Milam St | 0.48mi | 3/2.0 | 1,484 (+1%) | 22mo | $379,900 | $256 | 58 |
| 210 E Travis St | 0.42mi | 3/2.0 | 1,320 (-10%) | 7mo | $779,000 | $590 | 57 |
| 406 E Centre St | 0.72mi | 3/2.0 | 1,446 (-2%) | 13mo | $639,000 | $442 | 53 |
| 807 N Orange St | 0.57mi | 2/2.0 (-1) | 1,400 (-5%) | 11mo | $849,900 | $607 | 51 |
| 208 N Acorn St | 0.69mi | 4/3.0 (+1) | 1,550 (+5%) | 7mo | $899,000 | $580 | 44 |
Match score weights: distance 35% · size 25% · config 20% · recency 20%. Top-matched comps best support the ARV.
Projected returns pro-forma
-3.0% appreciation · 3.0% rent growth · sell at horizon
- IRR
- -24.0%
- Equity multiple
- 0.18×
- Total profit
- $-71,442
- Equity at exit
- $46,371
- IRR
- -19.1%
- Equity multiple
- -0.02×
- Total profit
- $-89,165
- Equity at exit
- $26,890
Cash invested: $87,080 (down + closing). Projections, not guarantees.
Landlord ↔ Tenant lean methodology
- Overall (STATE)
- 87 Strongly Landlord-Friendly
- State Texas
- 87 Strongly Landlord-Friendly · R+5
- County
- — inherits STATE
- City
- — inherits STATE
ZIP-level market 78624
- Active inventory
- 978
- Price-to-rent
- 11.1×
Monthly cashflow live
- Estimated rent
- $2,338 high interval (Pro) →
- Mortgage (P&I)
- −$1,631
- Tax est. 1.5%
- −$389 /mo · $4,665/yr
- Insurance
- −$130
- HOA
- −$29
- Vacancy / Maint / Mgmt
- −$491
- Net cashflow
- $-331
Break-even live
Sensitivity live
| Price | -10% $-116 | -5% $-224 | +0% $-331 | +5% $-439 | +10% $-546 |
|---|---|---|---|---|---|
| Rent | -10% $-516 | -5% $-424 | +0% $-331 | +5% $-239 | +10% $-147 |
| Rate | -1.0pp $-175 | -0.5pp $-252 | base $-331 | +0.5pp $-412 | +1.0pp $-494 |
UW: 25.0% down · 7.5% · 30yr · 1.5% tax · 5.0% vac · 8.0% maint · 8.0% mgmt
Financing live
Cash to close
- Down payment
- $77,750
- Closing costs
- $9,330
- Reserves months
- —
- Total cash needed
- —
Loan-product check · same deal, 3 products live
Conventional
25% down · 7.5% · 30yr
- Down + closing
- —
- Monthly P&I
- —
- Monthly cashflow
- —
- DSCR
- —
- Eligible?
- —
Personal DTI + credit; lowest rate.
DSCR
20% down · 8.5% · 30yr
- Down + closing
- —
- Monthly P&I
- —
- Monthly cashflow
- —
- DSCR
- —
- Eligible?
- —
No personal income docs; deal must DSCR.
Hard money
10% down · 12.0% · 12mo
- Down + closing
- —
- Monthly P&I
- —
- Monthly cashflow
- —
- DSCR
- —
- Eligible?
- —
Short-term bridge; refi at stabilization.
Rent comps 18 comps
| Address | Beds | Baths | Sqft | Rent | $/sqft | DOM | Units | Dist |
|---|---|---|---|---|---|---|---|---|
| 202 E Ufer St Fredericksburg, TX | 3.0 | 1.0–2.0 | 993 | $2,355 | $2.37 | 0d | 11 | 0.38mi |
| 422 S Orange St Fredericksburg, TX | 2.0 | 1.0 | 1732 | $2,250 | $1.30 | 22d | 1 | 0.44mi |
| 509 W Creek St Fredericksburg, TX | 2.0 | 2.0 | 1576 | $1,750 | $1.11 | 25d | 1 | 0.52mi |
| 104 N Elk St Fredericksburg, TX | 2.0 | 2.0 | 1620 | $2,000 | $1.23 | 13d | 1 | 0.63mi |
| 1004 E Hill St Unit B Fredericksburg, TX | 3.0 | 2.0 | 1431 | $1,895 | $1.32 | 25d | 1 | 0.86mi |
| 1004 W Hill St Fredericksburg, TX | 3.0 | 2.0 | 1432 | $1,895 | $1.32 | 25d | 1 | 0.87mi |
| 619 W Live Oak St Fredericksburg, TX | 1.0–2.0 | 1.0–2.0 | 879 | $1,899 | $2.16 | 0d | 11 | 0.98mi |
| 1401 N Orange St Fredericksburg, TX | 2.0 | 2.0 | 1222 | $1,700 | $1.39 | 45d | 1 | 1.06mi |
| 405 Summit Cir Fredericksburg, TX | 3.0 | 2.0 | 1532 | $2,100 | $1.37 | 45d | 1 | 1.07mi |
| 501 S Olive St Fredericksburg, TX | 2.0 | 2.5 | 1400 | $2,500 | $1.79 | 45d | 1 | 1.17mi |
| 510 S Olive St Fredericksburg, TX | 3.0 | 2.0 | 1335 | $2,950 | $2.21 | 45d | 1 | 1.19mi |
| 108 E Lower Crabapple Rd Fredericksburg, TX | 3.0 | 1.0–2.0 | 939 | $2,102 | $2.24 | 0d | 11 | 1.25mi |
| 605 Paintbrush Hollow St Fredericksburg, TX | 3.0 | 2.0 | 1611 | $2,495 | $1.55 | 25d | 1 | 1.26mi |
| 915 E Highway St Unit NA Fredericksburg, TX | 3.0 | 2.0 | 1407 | $1,950 | $1.39 | 6d | 1 | 1.34mi |
| 1006 E Highway St Fredericksburg, TX | 3.0 | 2.0 | 1588 | $2,250 | $1.42 | 45d | 1 | 1.39mi |
| 712 Englemann Oak Dr Fredericksburg, TX | 3.0 | 2.0 | 1510 | $2,650 | $1.75 | 19d | 1 | 1.39mi |
| 713 Englemann Oak Dr Fredericksburg, TX | 3.0 | 2.0 | 1496 | $2,850 | $1.91 | 45d | 1 | 1.42mi |
| 1705 Cherrywood Dr Fredericksburg, TX | 3.0 | 2.0 | 1786 | $2,500 | $1.40 | 13d | 1 | 1.46mi |
HOA detail
- Monthly dues
- $29 · $348/yr
Listing history 15 events
-
2026-06-21days on market $310,999 Active 404 DOM
-
2026-06-18days on market $310,999 Active 401 DOM
-
2026-06-17days on market $310,999 Active 400 DOM
-
2026-06-16days on market $310,999 Active 399 DOM
-
2026-06-15days on market $310,999 Active 398 DOM
-
2026-06-13days on market $310,999 Active 396 DOM
-
2026-06-09days on market $310,999 Active 392 DOM
-
2026-06-08days on market $310,999 Active 391 DOM
-
2026-06-07days on market $310,999 Active 390 DOM
-
2026-06-04days on market $310,999 Active 387 DOM
-
2026-06-03days on market $310,999 Active 386 DOM
-
2026-06-02days on market $310,999 Active 385 DOM
-
2026-06-01days on market $310,999 Active 384 DOM
-
2026-05-31days on market $310,999 Active 383 DOM
-
2025-05-13$310,999 New 463-char remark
Show marketing remark (463 chars)
The Newlin - This single-level home showcases a spacious open floorplan shared between the kitchen, dining area and family room for easy entertaining. An owner's suite enjoys a private location in a rear corner of the home, complemented by an en-suite bathroom and walk-in closet. There are two secondary bedrooms at the front of the home. Estimated COE July 2025. Prices and features may vary and are subject to change. Photos are for illustrative purposes only.
ⓘ Source: listings_history table (triggers on properties + properties_extension) + one-shot
backfill from property_details.listing_events for pre-trigger history.
Nearby sold comps map
Loading sold comps map…
Walkable amenities ~0.75 mi
Loading nearby amenities…
Taxation est. · year 1
- Rental income
- $28,055
- − Mortgage interest
- −$17,421
- − Property taxes
- −$4,665
- − Insurance
- −$1,555
- − Repairs & maintenance
- −$2,244
- − Management
- −$2,244
- − HOA
- −$348
- − Depreciation
- −$9,047
- Taxable loss
- −$9,470
- Est. tax savings @ 24.0%
- +$2,273
- After-tax cash flow
- $-1,703/yr
For passive investors: Depreciation is non-cash, so a rental often shows a tax loss while cash-flowing — sheltering income. Rental losses are passive: they offset passive income freely, and up to $25,000/yr can offset ordinary (W-2) income if you actively participate and your MAGI is under $100k (phasing out to $0 by $150k); unused losses carry forward. On sale, claimed depreciation is recaptured at up to 25%, and gains may owe capital-gains tax (a 1031 exchange can defer both). Figures are a year-1 estimate at your 24.0% rate — not tax advice; consult a CPA.
Schools (NCES district)
- District
- Fredericksburg ISD
- NCES district ID
- 4819840
- Math proficiency
- 44% ▼ -7.00%
- Reading proficiency
- 48% ▼ -2.00%
- Median HH income
- $54,655
- Composite
- 39.9/100
- National rank
- #3857
- State rank
- #241 of 826 in TX
Livability — Fredericksburg
- Score
- 74/100
- State rank
- #182
- US rank
- #4711
Category grades
Schools grade is shown separately in the Schools card above.
Census & demographics
- Census place
- Fredericksburg, TX
- County
- Gillespie County · 23,741 people
- City population
- 23,741
- Metro
- Fredericksburg, TX
- Population (ZIP)
- 23,741
- Household income
- $75,237
- Rent vs Own
- Severe rent burden
- 470.0
Population outlook (Gillespie County) Hauer SSP2
- Today (2025)
- 28,213 people
- By 2030
- 29,243 · +3.7%
- By 2040
- 31,133 · +10.3%
- By 2050
- 32,854 · +16.4%
- By 2075
- 37,597 · +33.3%
- By 2100
- 39,369 · +39.5%
Race, ethnicity, and origin ACS 2023
- Neighborhood character
- Predominantly White (73%)
- Race & ethnicity
- White 73% Hispanic / Latino 23% Two or more races 9%
- Hispanic origin (detail)
- Mexican 21%
- Common ancestry
- Slovak 4% Serbian 2% Lithuanian 2%
- Foreign-born
- 7% · Canada, Dominican Republic
- Languages at home
- 84% English-only · Spanish 13% German/W. Germanic 2% Other Asian/Pacific 1%
Political lean MEDSL · Gillespie
- 2024 margin
- Solid R (+60.9) · D 19.2% · R 80.1%
- 2008→2024 swing
- -4.3pp toward R · 2008: -56.6pp · 2024: -60.9pp
- All cycles
- 2024: R+60.9 2020: R+58.9 2016: R+62.2 2012: R+65.8 2008: R+56.6
Not yet ingested
- Civics
- —
Market trends
- HPI YoY
- ▼ -209.14%
- Current HPI
- 218.7201
- Rent YoY
- —
- Metro
- Fredericksburg, TX
- State GDP YoY
- ▲ 3.95%
- F500 in state
- 110
Industry mix (Fortune 500 HQ in TX)
| Industry | F500 HQs | Revenue |
|---|---|---|
| Energy | 16 | $1,198B |
|
||
| Technology | 5 | $198B |
|
||
| Engineering / Construction | 4 | $72B |
|
||
| Energy Services | 3 | $60B |
|
||
| Utilities | 3 | $41B |
|
||
| Healthcare | 2 | $330B |
|
||
Price history
1 event — show timeline
- 2025-05-13 Listed $310,999 LERA
Cash-flow waterfall
monthlySold comps — $/sqft
last 12 mo · ≤1 miLoading sold comps…