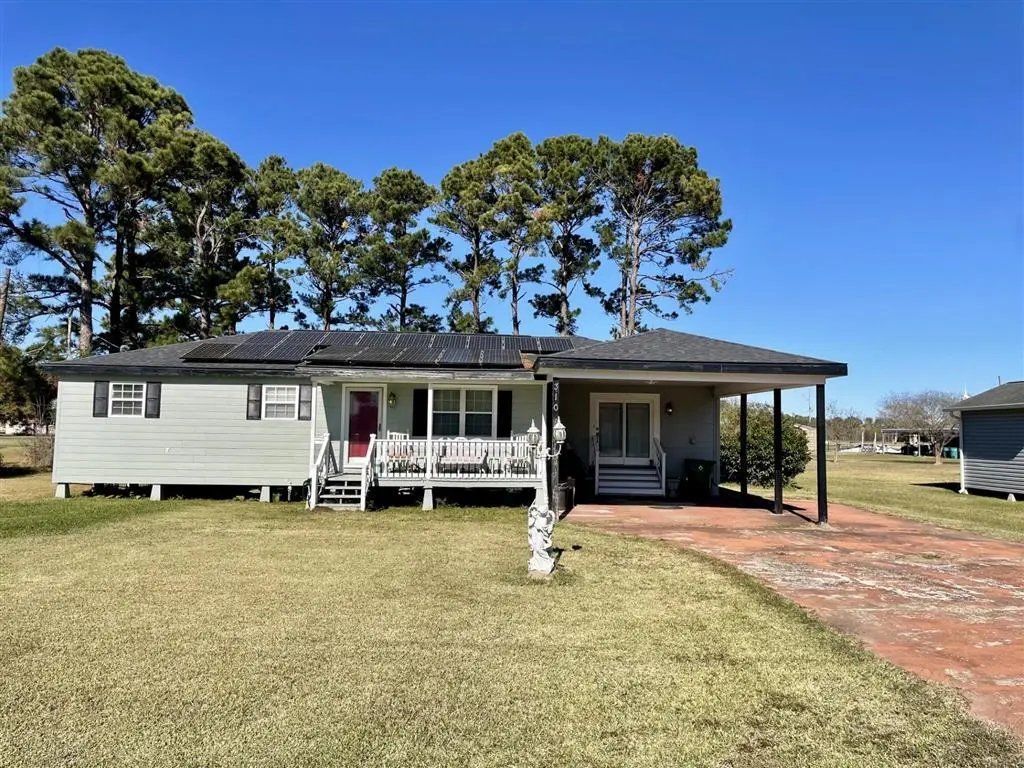
310 Romero · Lacassine, LA
Flood risk 1/10 · Minimal
- FEMA flood zone
- X (unshaded)
- Chance of flooding over 30 yrs
- 0.0%
- Est. flood insurance / yr
- $507 – $1,088
Fire risk 3/10 · Minor
- Est. fire insurance / yr
- $1,269 – $2,357
Heat risk 9/10 · Severe
- Hot days now (above 109°F)
- 7 days/yr
- Hot days in 30 yrs
- 20 days/yr
Wind risk 9/10 · Severe
- Chance of severe wind over 30 yrs
- 99.0%
Air-quality risk 1/10 · Minimal
- Unhealthy air days now
- 0 days/yr
- Unhealthy air days in 30 yrs
- 0 days/yr
Risk factors via First Street. Map © Google.
Why this score? — see what drove the C- grade
The composite is a weighted blend of 9 inputs, each scored 0–100. Each bar is that input's sub-score; the figure is the points it added to the 100-point composite (weight × sub-score).
- Cash flow +17.8/30.0
- ARV discount +15.0/15.0
- DSCR +5.6/10.0
- 1% rule +4.3/10.0
- Schools +3.0/10.0
- Rent growth +2.5/5.0
- Condition / age +2.5/5.0
- Livability +2.2/5.0
- Appreciation +0.0/10.0
$150,000
🖨 Deal sheet 📄 Offer letter ✓ Due diligence
Listing remarks MLS
Home features 3 bedrooms, 1.5 baths, large living room, newer hardy board siding, workshop with electricity, and solar panels to help with electric bills. Flood zone X, flood insurance should not be required. All measurements are more or less.
Key facts
- Large living room
- Flood zone x
- Solar panels
Tags
Neighborhood map
What this means for you Summary
Snapshot
- This is a 3-bed/1.5-bath single-family listed at $150k.
Deal economics
- At list price, monthly cash flow is $123 ($1k/yr) — positive.
- The deal already cash-flows at list — no discount required.
- To meet the 1% rule (rent ≥ 1% of price), the offer needs to be $140k (6.7% below list).
- Recommended offer: $132k (12.0% below list) — sets the bar for market timing.
Location & tenants
- Location reads 45/100 on livability (#453 in LA) — a working-class tenant base; expect higher turnover. Strengths: cost of living A+, crime A, schools A-; Watch: amenities F, commute F, employment F.
- Jefferson Davis Parish (town): math 30% / reading 42% proficiency, ranked #33 of 98 in LA (top 34%) — families likely to look elsewhere, expect single-tenant / working-renter base with shorter leases.
- Market conditions: 259 active listings in the ZIP; 69 units permitted in Jefferson Davis Parish in 2024 (0 in 5+ unit buildings).
Forward outlook
- Local home prices are declining (-3.0%/yr); year-one equity from $1k of loan paydown is wiped out by about $4k of value loss. Plan a longer hold.
- Jefferson Davis County population projected to shrink 8% by 2050 — rents likely to lag national; underwrite the cash flow, not the appreciation.
Negotiation context
- It's been on market 178 days — a 12% lower offer ($132k) is reasonable based on typical stale-listing flexibility.
Risks & watch-outs
- Climate carrying-cost: severe wind risk, 99% chance of damaging wind over 30y; extreme-heat days projected 7→20/yr by 2055 (HVAC capex compounding) — expect insurance premiums to compound above CPI over the hold.
Questions for the listing agent
- It's been on market 178 days. Have you received any prior offers? Is the seller open to a 12% concession, seller financing, or rate buy-down credit?
- Built in 1978 — when were the roof, HVAC, electrical panel, plumbing, and water heater last replaced?
- Why hasn't it sold? Are there any deal-killer items the seller is aware of (foundation, flood, title, zoning, code violations)?
- Is there a deadline driving the sale (1031 exchange, divorce, estate, relocation)? That informs how much negotiation room exists.
- Schools are A-rated — typically a magnet for longer-tenancy family renters. What's the average tenant stay here, and is there a school-zone premium baked into asking?
- What's the average days-on-market for RENTAL listings here right now (not sales)? A rising rental-DOM trend means longer vacancies and softer asking-rent achievability than the comps imply.
- What's the recent tenant-quality profile in this submarket — average credit score on applications, eviction rate, late-payment / NSF rate, and stable-employment percentage? A property-management company in the area should have these aggregated.
- How much new for-sale + rental construction is in the pipeline within 1–3 miles? Heavy new supply typically softens prices + rents 12–24 months out; constrained supply supports both.
Investment metrics
- 1% rule
- 0.93% ✗
- Cap rate
- 7.28%
- Cash-on-cash
- 3.53%
- DSCR
- 1.16
- GRM
- 8.9
CMA / ARV
- ARV (median comp)
- $261,810
- List price
- $150,000
- Delta
- -42.71%
- Verdict
- UNDERPRICED
- Comps
- 14 within 1.0 mi
Show comp detail 4 sales within ~0.75 mi
| Address | Dist | Beds/Ba | Sqft | Sold | Price | $/sf | Match |
|---|---|---|---|---|---|---|---|
| 414 Algonia Ave | 0.31mi | 3/2.5 | 1,575 (-6%) | 1mo | $210,000 | $133 | 71 |
| 523 Lakota St | 0.50mi | 4/2.0 (+1) | 1,699 (+2%) | 6mo | $222,000 | $131 | 62 |
| 18966 Kayla St | 0.68mi | 3/2.0 | 1,587 (-5%) | 1mo | $260,000 | $164 | 58 |
| 18804 Cade St | 0.58mi | 4/2.0 (+1) | 1,816 (+9%) | 14mo | $300,000 | $165 | 39 |
Match score weights: distance 35% · size 25% · config 20% · recency 20%. Top-matched comps best support the ARV.
Projected returns pro-forma
-3.0% appreciation · 3.0% rent growth · sell at horizon
- IRR
- -10.8%
- Equity multiple
- 0.61×
- Total profit
- $-16,459
- Equity at exit
- $22,365
- IRR
- -1.5%
- Equity multiple
- 0.90×
- Total profit
- $-4,262
- Equity at exit
- $12,969
Cash invested: $42,000 (down + closing). Projections, not guarantees.
Landlord ↔ Tenant lean methodology
- Overall (STATE)
- 90 Strongly Landlord-Friendly
- State Louisiana
- 90 Strongly Landlord-Friendly · R+12
- County
- — inherits STATE
- City
- — inherits STATE
ZIP-level market 70647
- Active inventory
- 259
- Price-to-rent
- 8.9×
Monthly cashflow live
- Estimated rent
- $1,399 medium interval (Pro) →
- Mortgage (P&I)
- −$787
- Tax from tax record
- −$133 /mo · $1,594/yr
- Insurance
- −$62
- HOA
- −$0
- Vacancy / Maint / Mgmt
- −$294
- Net cashflow
- $123
Break-even live
UW: 25.0% down · 7.5% · 30yr · 1.5% tax · 5.0% vac · 8.0% maint · 8.0% mgmt
Financing live
Cash to close
- Down payment
- $37,500
- Closing costs
- $4,500
- Reserves months
- —
- Total cash needed
- —
Loan-product check · same deal, 3 products live
Conventional
25% down · 7.5% · 30yr
- Down + closing
- —
- Monthly P&I
- —
- Monthly cashflow
- —
- DSCR
- —
- Eligible?
- —
Personal DTI + credit; lowest rate.
DSCR
20% down · 8.5% · 30yr
- Down + closing
- —
- Monthly P&I
- —
- Monthly cashflow
- —
- DSCR
- —
- Eligible?
- —
No personal income docs; deal must DSCR.
Hard money
10% down · 12.0% · 12mo
- Down + closing
- —
- Monthly P&I
- —
- Monthly cashflow
- —
- DSCR
- —
- Eligible?
- —
Short-term bridge; refi at stabilization.
Listing history 12 events
-
2026-06-13statusdays on market $150,000 Pending 178 DOM
-
2026-06-10days on market $150,000 Active 177 DOM
-
2026-06-09days on market $150,000 Active 176 DOM
-
2026-06-08days on market $150,000 Active 175 DOM
-
2026-06-07days on market $150,000 Active 174 DOM
-
2026-06-02days on market $150,000 Active 169 DOM
-
2026-06-01days on market $150,000 Active 168 DOM
-
2026-05-31days on market $150,000 Active 167 DOM
-
2026-05-30days on market $150,000 Active 166 DOM
-
2026-01-26price $150,000 243-char remark
Show marketing remark (243 chars)
Home features 3 bedrooms, 1.5 baths, large living room, newer hardy board siding, workshop with electricity, and solar panels to help with electric bills. Flood zone X, flood insurance should not be required. All measurements are more or less.
-
2025-12-15$160,000 Active 243-char remark
Show marketing remark (243 chars)
Home features 3 bedrooms, 1.5 baths, large living room, newer hardy board siding, workshop with electricity, and solar panels to help with electric bills. Flood zone X, flood insurance should not be required. All measurements are more or less.
-
2021-08-16soldstatus $158,000
ⓘ Source: listings_history table (triggers on properties + properties_extension) + one-shot
backfill from property_details.listing_events for pre-trigger history.
Tax reassessment forecast LA · Resets to sale price
- Current annual tax
- $1,594 · $133/mo
- Projected year-2 tax
- $1,594 · $133/mo
- Expected delta
- $0/yr ($0/mo · 0.0%)
ⓘ Screening estimate from a state-policy table — verify with the county assessor before closing.
Climate risk First Street
- Flood 1/10 Low FEMA zone X (unshaded) · 0% chance over 30 yrs
- Wildfire 3/10 Moderate
- Heat 9/10 Extreme 7 d/yr ≥109°F today · 20 d/yr by 30 yrs out
- Wind 9/10 Extreme 99% chance of damaging wind over 30 yrs
- Air quality 1/10 Low 0 unhealthy d/yr today · 0 by 30 yrs out
Nearby sold comps map
Loading sold comps map…
Walkable amenities ~0.75 mi
Loading nearby amenities…
Taxation est. · year 1
- Rental income
- $16,791
- − Mortgage interest
- −$8,402
- − Property taxes
- −$1,594
- − Insurance
- −$750
- − Repairs & maintenance
- −$1,343
- − Management
- −$1,343
- − Depreciation
- −$4,364
- Taxable loss
- −$1,006
- Est. tax savings @ 24.0%
- +$241
- After-tax cash flow
- $1,722/yr
For passive investors: Depreciation is non-cash, so a rental often shows a tax loss while cash-flowing — sheltering income. Rental losses are passive: they offset passive income freely, and up to $25,000/yr can offset ordinary (W-2) income if you actively participate and your MAGI is under $100k (phasing out to $0 by $150k); unused losses carry forward. On sale, claimed depreciation is recaptured at up to 25%, and gains may owe capital-gains tax (a 1031 exchange can defer both). Figures are a year-1 estimate at your 24.0% rate — not tax advice; consult a CPA.
Schools (NCES district)
- District
- Jefferson Davis Parish
- NCES district ID
- 2200810
- Math proficiency
- 30% ▼ -39.00%
- Reading proficiency
- 42% ▼ -33.00%
- Median HH income
- $40,322
- Composite
- 30.21/100
- National rank
- #6302
- State rank
- #33 of 98 in LA
Livability — Lacassine
- Score
- 45/100
- State rank
- #453
- US rank
- #26691
Category grades
Schools grade is shown separately in the Schools card above.
Census & demographics
- Census place
- Lacassine, LA
- City population
- 175
- Population (ZIP)
- 12,056
Population outlook (Jefferson Davis County) Hauer SSP2
- Today (2025)
- 31,015 people
- By 2030
- 30,563 · -1.5%
- By 2040
- 29,639 · -4.4%
- By 2050
- 28,456 · -8.3%
- By 2075
- 25,521 · -17.7%
- By 2100
- 21,787 · -29.8%
Race, ethnicity, and origin ACS 2023
- Neighborhood character
- Predominantly White (67%)
- Race & ethnicity
- White 67% Black 22% Two or more races 9% Hispanic / Latino 3%
- Common ancestry
- Lithuanian 18% Slovak 1%
- Foreign-born
- 1%
- Languages at home
- 92% English-only · French/Haitian/Cajun 3% Spanish 3% Other Asian/Pacific 2%
Political lean MEDSL · Jefferson Davis
- 2024 margin
- Solid R (+61.1) · D 18.8% · R 79.9% · Other 1.3%
- 2008→2024 swing
- -21.5pp toward R · 2008: -39.7pp · 2024: -61.1pp
- All cycles
- 2024: R+61.1 2020: R+55.4 2016: R+53.9 2012: R+47.6 2008: R+39.7
Not yet ingested
- Civics
- —
Market trends
- HPI YoY
- ▼ -78.33%
- Current HPI
- 119.3512
- Rent YoY
- —
- Metro
- —
- State GDP YoY
- ▲ 3.29%
- F500 in state
- 10
Industry mix (Fortune 500 HQ in LA)
| Industry | F500 HQs | Revenue |
|---|---|---|
| Telecommunications | 2 | $23B |
|
||
| Utilities | 1 | $12B |
|
||
| Wholesale / Distribution | 1 | $5B |
|
||
| Advertising | 1 | $2B |
|
||
Price history
-5.1% since first listed3 events — show timeline
- 2026-01-26 Price Changed $150,000 SWLAR
- 2025-12-15 Listed $160,000 SWLAR
- 2021-08-16 Sold (Public Records) $158,000 Public Records
Property tax history
+14.4%/yrLatest (2025): $1,594 · +0.3% YoY. Source: county tax records.
Cash-flow waterfall
monthlySold comps — $/sqft
last 12 mo · ≤1 miLoading sold comps…