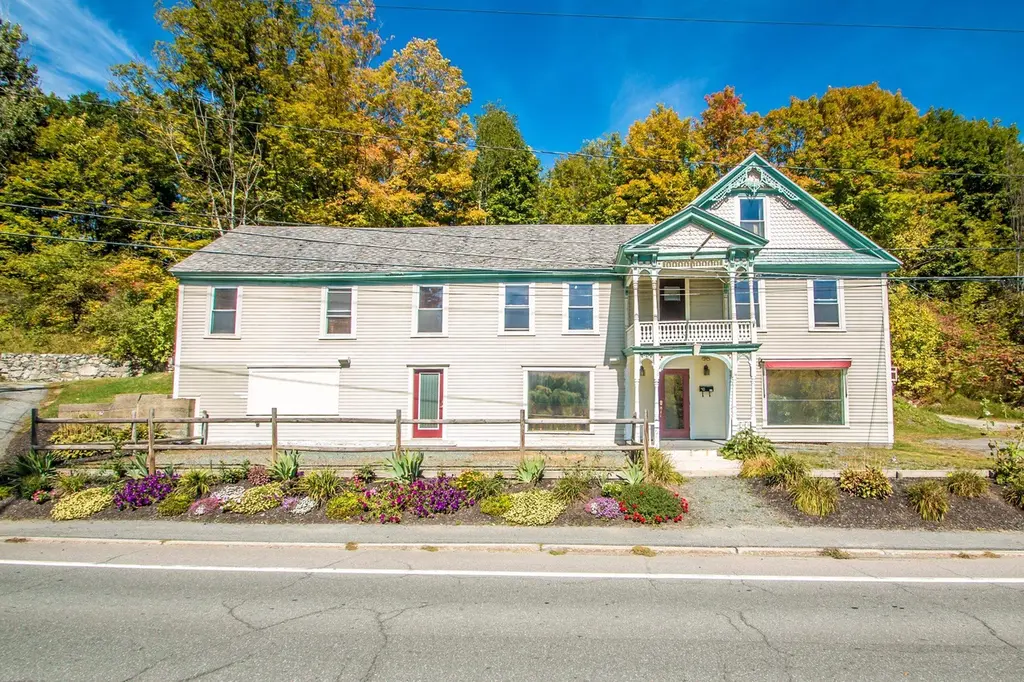
40 W Main St · Littleton, NH
Flood risk No data
- FEMA flood zone
- —
- Chance of flooding over 30 yrs
- —
- Est. flood insurance / yr
- —
Fire risk No data
- Est. fire insurance / yr
- —
Heat risk No data
- Hot days now (above threshold)
- —
- Hot days in 30 yrs
- —
Wind risk No data
- Chance of severe wind over 30 yrs
- —
Air-quality risk No data
- Unhealthy air days now
- —
- Unhealthy air days in 30 yrs
- —
Risk factors via First Street. Map © Google.
Why this score? — see what drove the D grade
The composite is a weighted blend of 9 inputs, each scored 0–100. Each bar is that input's sub-score; the figure is the points it added to the 100-point composite (weight × sub-score).
- ARV discount +15.0/15.0
- Appreciation +10.0/10.0
- Cash flow +4.6/30.0
- Schools +4.0/10.0
- Livability +3.2/5.0
- Rent growth +2.5/5.0
- Condition / age +2.5/5.0
- 1% rule +0.6/10.0
- DSCR +0.0/10.0
$329,000
🖨 Deal sheet 📄 Offer letter ✓ Due diligence
Listing remarks MLS
Prime Littleton location with outstanding visibility and endless potential! Situated on 0.53 acres along a highly traveled road in Littleton, this versatile commercial property offers an exceptional opportunity for investors, entrepreneurs, or those seeking a unique mixed-use space. Currently set up as a residential property, the main level has been thoughtfully converted into a spacious three-bedroom apartment, making it ideal for owner occupancy or long-term rental income. Customers and tenants alike will appreciate the easy walk to Littleton’s thriving Main Street and River District, filled with shops, restaurants, breweries, and community events. The street-level finished lower level opens the door to a variety of commercial possibilities. Featuring large windows for natural light, a private entrance, an expansive bar, two additional rooms, and access to a level outdoor patio, the space could lend itself to retail, office, studio, entertainment, or hospitality ventures. Whether you’re looking to establish a business, expand your investment portfolio, or create a live/work setup in one of northern New Hampshire’s most desirable downtown communities, this adaptable property is ready for your vision. Opportunity, location, and flexibility all come together here.
Key facts
- Large windows
- Sizeable bar area
- Level outdoor patio
Tags
Neighborhood map
What this means for you Summary
Snapshot
- This is a 3-bed/1.5-bath single-family listed at $329k.
Deal economics
- At list price, monthly cash flow is $-827 ($-10k/yr) — negative.
- To cash-flow at today's rent, offer at most $209k (36.4% below list).
- To meet the 1% rule (rent ≥ 1% of price), the offer needs to be $183k (44.3% below list).
- Recommended offer: $183k (44.3% below list) — sets the bar for 1% rule.
Location & tenants
- Location reads 64/100 on livability (#80 in NH) — a middle-class / working-renter tenant base. Strengths: cost of living A+, crime A, housing B; Watch: schools D+, amenities F, commute F.
- Littleton School District (town): math 43% / reading 51% proficiency, ranked #51 of 98 in NH (top 52%) — families likely to look elsewhere, expect single-tenant / working-renter base with shorter leases.
- Market conditions: 39 active listings in the ZIP; 487 units permitted in Grafton County in 2024 (127 in 5+ unit buildings).
Forward outlook
- In year one you build about $35k of equity ($2k loan paydown + $33k appreciation (10.0% local appreciation)).
- Grafton County population projected at -13% by 2050 — secular population decline; favor cash flow + early exit over multi-decade hold.
- By year 2, paydown + projected appreciation supports a ~$57k cash-out refi (75% LTV) — recoverable capital for the next deal without selling this one.
Negotiation context
- It's been on market 192 days — a 12% lower offer ($290k) is reasonable based on typical stale-listing flexibility.
Risks & watch-outs
- Watch-outs: built in 1820 — expect roof / HVAC / electrical / plumbing capex.
Questions for the listing agent
- What do current leases actually rent for vs. the listed asking? Can we see a recent rent roll and the last 12 months of T-12 income?
- It's been on market 192 days. Have you received any prior offers? Is the seller open to a 44% concession, seller financing, or rate buy-down credit?
- Built in 1820 — when were the roof, HVAC, electrical panel, plumbing, and water heater last replaced?
- Why hasn't it sold? Are there any deal-killer items the seller is aware of (foundation, flood, title, zoning, code violations)?
- Is there a deadline driving the sale (1031 exchange, divorce, estate, relocation)? That informs how much negotiation room exists.
- Schools are D-rated, which usually means shorter tenancies and higher turnover. Who's the typical renter profile here, and what's been the actual vacancy rate?
- The area grade is low — what's the realistic commute time and amenity access for the typical tenant pool here? Any planned neighborhood developments (good or bad) we should know about?
- What's the average days-on-market for RENTAL listings here right now (not sales)? A rising rental-DOM trend means longer vacancies and softer asking-rent achievability than the comps imply.
- What's the recent tenant-quality profile in this submarket — average credit score on applications, eviction rate, late-payment / NSF rate, and stable-employment percentage? A property-management company in the area should have these aggregated.
- How much new for-sale + rental construction is in the pipeline within 1–3 miles? Heavy new supply typically softens prices + rents 12–24 months out; constrained supply supports both.
Investment metrics
- 1% rule
- 0.56% ✗
- Cap rate
- 3.28%
- Cash-on-cash
- -10.77%
- DSCR
- 0.52
- GRM
- 15.0
CMA / ARV
- ARV (median comp)
- $494,709
- List price
- $329,000
- Delta
- -33.50%
- Verdict
- UNDERPRICED
- Comps
- 10 within 1.0 mi
Projected returns pro-forma
10.0% appreciation · 3.0% rent growth · sell at horizon
- IRR
- 16.7%
- Equity multiple
- 2.37×
- Total profit
- $126,565
- Equity at exit
- $296,389
- IRR
- 15.9%
- Equity multiple
- 5.50×
- Total profit
- $414,166
- Equity at exit
- $639,175
Cash invested: $92,120 (down + closing). Projections, not guarantees.
Landlord ↔ Tenant lean methodology
- Overall (STATE)
- 56 Moderately Landlord-Leaning
- State New Hampshire
- 56 Moderately Landlord-Leaning · D+1
- County
- — inherits STATE
- City
- — inherits STATE
ZIP-level market 03561
- Home prices YoY
- 4.3%
- Active inventory
- 39
- Price-to-rent
- 15.0×
Monthly cashflow live
- Estimated rent
- $1,832 medium interval (Pro) →
- Mortgage (P&I)
- −$1,725
- Tax est. 1.5%
- −$411 /mo · $4,935/yr
- Insurance
- −$137
- HOA
- −$0
- Vacancy / Maint / Mgmt
- −$385
- Net cashflow
- $-827
Break-even live
UW: 25.0% down · 7.5% · 30yr · 1.5% tax · 5.0% vac · 8.0% maint · 8.0% mgmt
Financing live
Cash to close
- Down payment
- $82,250
- Closing costs
- $9,870
- Reserves months
- —
- Total cash needed
- —
Loan-product check · same deal, 3 products live
Conventional
25% down · 7.5% · 30yr
- Down + closing
- —
- Monthly P&I
- —
- Monthly cashflow
- —
- DSCR
- —
- Eligible?
- —
Personal DTI + credit; lowest rate.
DSCR
20% down · 8.5% · 30yr
- Down + closing
- —
- Monthly P&I
- —
- Monthly cashflow
- —
- DSCR
- —
- Eligible?
- —
No personal income docs; deal must DSCR.
Hard money
10% down · 12.0% · 12mo
- Down + closing
- —
- Monthly P&I
- —
- Monthly cashflow
- —
- DSCR
- —
- Eligible?
- —
Short-term bridge; refi at stabilization.
Listing history 17 events
-
2026-06-18price $329,000 Active 192 DOM
-
2026-06-18days on market $335,000 Active 192 DOM
-
2026-06-17days on market $335,000 Active 191 DOM
-
2026-06-16days on market $335,000 Active 190 DOM
-
2026-06-15days on market $335,000 Active 189 DOM
-
2026-06-13days on market $335,000 Active 187 DOM
-
2026-06-12days on market $335,000 Active 186 DOM
-
2026-06-09days on market $335,000 Active 183 DOM
-
2026-06-08days on market $335,000 Active 182 DOM
-
2026-06-07days on market $335,000 Active 181 DOM
-
2026-06-07days on market $335,000 Active 180 DOM
-
2026-06-04days on market $335,000 Active 177 DOM
-
2026-06-02days on market $335,000 Active 176 DOM
-
2026-06-01days on market $335,000 Active 175 DOM
-
2026-05-31days on market $335,000 Active 174 DOM
-
2025-12-08$335,000 Active 1301-char remark
Show marketing remark (1301 chars)
Prime Littleton location with outstanding visibility and endless potential! Situated on 0.53 acres along a highly traveled road in Littleton, this versatile commercial property offers an exceptional opportunity for investors, entrepreneurs, or those seeking a unique mixed-use space. Currently set up as a residential property, the main level has been thoughtfully converted into a spacious three-bedroom apartment, making it ideal for owner occupancy or long-term rental income. Customers and tenants alike will appreciate the easy walk to Littleton’s thriving Main Street and River District, filled with shops, restaurants, breweries, and community events. The street-level finished lower level opens the door to a variety of commercial possibilities. Featuring large windows for natural light, a private entrance, an expansive bar, two additional rooms, and access to a level outdoor patio, the space could lend itself to retail, office, studio, entertainment, or hospitality ventures. Whether you’re looking to establish a business, expand your investment portfolio, or create a live/work setup in one of northern New Hampshire’s most desirable downtown communities, this adaptable property is ready for your vision. Opportunity, location, and flexibility all come together here.
-
2022-01-08price $379,000
ⓘ Source: listings_history table (triggers on properties + properties_extension) + one-shot
backfill from property_details.listing_events for pre-trigger history.
Nearby sold comps map
Loading sold comps map…
Walkable amenities ~0.75 mi
Loading nearby amenities…
Taxation est. · year 1
- Rental income
- $21,981
- − Mortgage interest
- −$18,429
- − Property taxes
- −$4,935
- − Insurance
- −$1,645
- − Repairs & maintenance
- −$1,758
- − Management
- −$1,758
- − Depreciation
- −$9,571
- Taxable loss
- −$16,116
- Est. tax savings @ 24.0%
- +$3,868
- After-tax cash flow
- $-6,051/yr
For passive investors: Depreciation is non-cash, so a rental often shows a tax loss while cash-flowing — sheltering income. Rental losses are passive: they offset passive income freely, and up to $25,000/yr can offset ordinary (W-2) income if you actively participate and your MAGI is under $100k (phasing out to $0 by $150k); unused losses carry forward. On sale, claimed depreciation is recaptured at up to 25%, and gains may owe capital-gains tax (a 1031 exchange can defer both). Figures are a year-1 estimate at your 24.0% rate — not tax advice; consult a CPA.
Schools (NCES district)
- District
- Littleton School District
- NCES district ID
- 3304380
- Math proficiency
- 43% ▲ 1.00%
- Reading proficiency
- 51% ▼ -4.00%
- Median HH income
- $42,215
- Composite
- 39.53/100
- National rank
- #3943
- State rank
- #51 of 98 in NH
Livability — Littleton
- Score
- 64/100
- State rank
- #80
- US rank
- #14062
Category grades
Schools grade is shown separately in the Schools card above.
Census & demographics
- Census place
- Littleton, NH
- Population (ZIP)
- 6,031
Population outlook (Grafton County) Hauer SSP2
- Today (2025)
- 88,798 people
- By 2030
- 87,131 · -1.9%
- By 2040
- 82,000 · -7.7%
- By 2050
- 77,064 · -13.2%
- By 2075
- 68,769 · -22.6%
- By 2100
- 61,631 · -30.6%
Race, ethnicity, and origin ACS 2023
- Neighborhood character
- Predominantly White (90%)
- Race & ethnicity
- White 90% Hispanic / Latino 5% Two or more races 5%
- Hispanic origin (detail)
- Puerto Rican 3%
- Common ancestry
- Lithuanian 10% Romanian 7% German 2%
- Foreign-born
- 1% · Canada
- Languages at home
- 97% English-only · French/Haitian/Cajun 3%
Political lean MEDSL · Grafton
- 2024 margin
- D (+19.9) · D 59.4% · R 39.4% · Other 1.2%
- 2008→2024 swing
- -7.8pp toward R · 2008: 27.7pp · 2024: 19.9pp
- All cycles
- 2024: D+19.9 2020: D+24.6 2016: D+19.0 2012: D+23.8 2008: D+27.7
Not yet ingested
- Civics
- —
Market trends
- HPI YoY
- ▲ 16.89%
- Current HPI
- 408.5862
- Rent YoY
- —
- Metro
- —
- State GDP YoY
- —
- F500 in state
- 0
Price history
-11.6% since first listed2 events — show timeline
- 2025-12-08 Listed $335,000 PrimeMLS
- 2022-01-08 Price Changed $379,000 PrimeMLS
Cash-flow waterfall
monthlySold comps — $/sqft
last 12 mo · ≤1 miLoading sold comps…