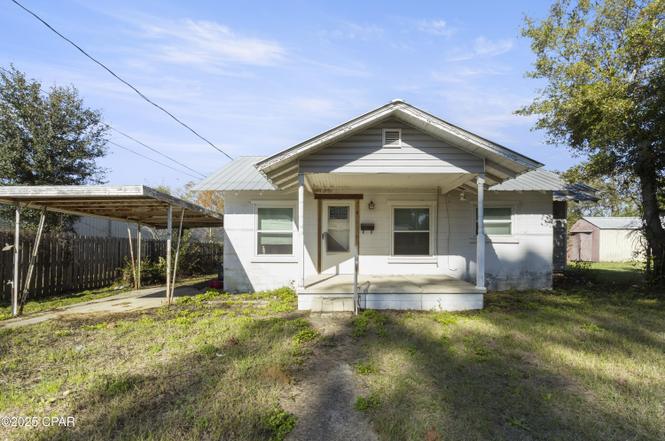
209 E North Ave · Bonifay, FL
Flood risk 1/10 · Minimal
- FEMA flood zone
- X (unshaded)
- Chance of flooding over 30 yrs
- 0.0%
- Est. flood insurance / yr
- $507 – $1,088
Fire risk 5/10 · Moderate
- Est. fire insurance / yr
- $947 – $1,759
Heat risk 8/10 · Major
- Hot days now (above 107°F)
- 7 days/yr
- Hot days in 30 yrs
- 19 days/yr
Wind risk 9/10 · Severe
- Chance of severe wind over 30 yrs
- 99.0%
Air-quality risk 2/10 · Minimal
- Unhealthy air days now
- 1 days/yr
- Unhealthy air days in 30 yrs
- 1 days/yr
Risk factors via First Street. Map © Google.
Why this score? — see what drove the B+ grade
The composite is a weighted blend of 9 inputs, each scored 0–100. Each bar is that input's sub-score; the figure is the points it added to the 100-point composite (weight × sub-score).
- Cash flow +30.0/30.0
- 1% rule +10.0/10.0
- DSCR +10.0/10.0
- Appreciation +10.0/10.0
- ARV discount +7.5/15.0
- Schools +3.7/10.0
- Livability +3.4/5.0
- Rent growth +2.5/5.0
- Condition / age +2.5/5.0
$69,999
🖨 Deal sheet (PDF) 📄 Offer letter ✓ Due diligence
Listing remarks
Located in a high-traffic area of a charming small town, this older home in Bonifay offers incredible potential for the buyer with vision. Whether you're looking to create a cozy residence, a professional office, or a mixed-use space, this property provides a solid foundation to make it your own. Inside, you'll find classic character waiting to be revitalized—the perfect canvas for a full remodel or modern redesign. With its flexible layout and excellent visibility, this property is ideal for entrepreneurs, investors, or anyone looking to put their personal touch on a standout location. Outside, the lot provides room for expansion or outdoor improvements, adding even more value to the
Key facts
- Flexible layout
- Room for expansion
- Outdoor improvements
Tags
Property features AI
Finance
- Other: Units furnished: None
- Financial info: Annual tax amount reported for 2025
- HOA & community: Short-term rentals allowed
Exterior
- Home design: Mobile home dimensions measured in feet
- Exterior features: Lot dimensions approximately 50 x 130
Interior
- Bedrooms: Three bedrooms on the first floor (two approx. 10 x 12, one approx. 10 x 10)
- Bathrooms: 2 full bathrooms
- Interior features: Total of 3 rooms
Neighborhood map
What this means for you Summary
Snapshot
- This is a 3-bed/2.0-bath single-family listed at $70k.
Deal economics
- At list price, monthly cash flow is $525 ($6k/yr) — positive.
- The deal already cash-flows at list — no discount required.
- Meets the 1% rule at list price ($1k rent vs $70k).
- Recommended offer: $62k (12.0% below list) — sets the bar for market timing.
- Cap rate 15.3% vs local median 3.8% in Bonifay — top-decile yield for the area; either an underpriced asset or a hidden risk that comps aren't pricing in. Stress-test before assuming the spread holds.
Location & tenants
- Location reads 67/100 on livability (#577 in FL) — a middle-class / working-renter tenant base. Strengths: crime A+, cost of living A+, housing A+; Watch: schools D, amenities F, commute F.
- Holmes (rural): math 44% / reading 45% proficiency, ranked #53 of 73 in FL (top 73%) — families likely to look elsewhere, expect single-tenant / working-renter base with shorter leases.
- Market conditions: 141 active listings in the ZIP; 12 units permitted in Holmes County in 2024 (0 in 5+ unit buildings).
Forward outlook
- In year one you build about $7k of equity ($484 loan paydown + $7k appreciation (10.0% local appreciation)).
- Holmes County population projected at -17% by 2050 — secular population decline; favor cash flow + early exit over multi-decade hold.
- At projected returns (10.0% appreciation + 3.0% rent growth), your $20k cash investment doubles in ~2 years — after that, you're playing with house money.
- By year 5, paydown + projected appreciation supports a ~$35k cash-out refi (75% LTV) — recoverable capital for the next deal without selling this one.
Negotiation context
- It's been on market 159 days — a 12% lower offer ($62k) is reasonable based on typical stale-listing flexibility.
- 3 sale attempts; this cycle's ask has dropped $20k (22%) from the opening price — seller is motivated, your offer sets the floor, not the list.
Risks & watch-outs
- Climate carrying-cost: severe wind risk, 99% chance of damaging wind over 30y; moderate wildfire risk; extreme-heat days projected 7→19/yr by 2055 (HVAC capex compounding) — expect insurance premiums to compound above CPI over the hold.
Questions for the listing agent
- It's been on market 159 days. Have you received any prior offers? Is the seller open to a 12% concession, seller financing, or rate buy-down credit?
- Built in 1960 — when were the roof, HVAC, electrical panel, plumbing, and water heater last replaced?
- Why hasn't it sold? Are there any deal-killer items the seller is aware of (foundation, flood, title, zoning, code violations)?
- Is there a deadline driving the sale (1031 exchange, divorce, estate, relocation)? That informs how much negotiation room exists.
- Schools are D-rated, which usually means shorter tenancies and higher turnover. Who's the typical renter profile here, and what's been the actual vacancy rate?
- What's the average days-on-market for RENTAL listings here right now (not sales)? A rising rental-DOM trend means longer vacancies and softer asking-rent achievability than the comps imply.
- What's the recent tenant-quality profile in this submarket — average credit score on applications, eviction rate, late-payment / NSF rate, and stable-employment percentage? A property-management company in the area should have these aggregated.
- How much new for-sale + rental construction is in the pipeline within 1–3 miles? Heavy new supply typically softens prices + rents 12–24 months out; constrained supply supports both.
Investment metrics
- 1% rule
- 1.71% ✓
- Cap rate
- 15.28%
- Cash-on-cash
- 32.11%
- DSCR
- 2.43
- GRM
- 4.9
CMA / ARV
- ARV (on-the-fly)
- $215,644
- Comps found
- 6
Show comp detail 6 sales within ~0.75 mi
| Address | Dist | Beds/Ba | Sqft | Sold | Price | $/sf | Match |
|---|---|---|---|---|---|---|---|
| 900 N Tracy St | 0.30mi | 3/2.0 | 1,209 (-5%) | 8mo | $204,000 | $169 | 70 |
| 904 N Tracy St | 0.30mi | 3/2.0 | 1,209 (-5%) | 9mo | $204,900 | $169 | 70 |
| 908 N Tracy St | 0.29mi | 3/2.0 | 1,209 (-5%) | 10mo | $204,000 | $169 | 69 |
| 102 Lisenby Dr | 0.32mi | 3/2.0 | 1,377 (+8%) | 13mo | $225,000 | $163 | 61 |
| 206 Northdale Ave | 0.56mi | 3/2.0 | 1,440 (+13%) | 14mo | $238,000 | $165 | 40 |
| 603 W Kansas Ave | 0.67mi | 2/1.0 (-1) | 1,100 (-14%) | 6mo | $125,000 | $114 | 32 |
Match score weights: distance 35% · size 25% · config 20% · recency 20%. Top-matched comps best support the ARV.
Projected returns pro-forma
10.0% appreciation · 3.0% rent growth · sell at horizon
- IRR
- 48.8%
- Equity multiple
- 4.65×
- Total profit
- $71,510
- Equity at exit
- $63,061
- IRR
- 42.5%
- Equity multiple
- 10.40×
- Total profit
- $184,276
- Equity at exit
- $135,993
Cash invested: $19,600 (down + closing). Projections, not guarantees.
Landlord ↔ Tenant lean methodology
- Overall (STATE)
- 87 Strongly Landlord-Friendly
- State Florida
- 87 Strongly Landlord-Friendly · R+3
- County
- — inherits STATE
- City
- — inherits STATE
ZIP-level market 32425
- Home prices YoY
- 16.2%
- Active inventory
- 141
- Price-to-rent
- 4.9×
Monthly cashflow live
- Estimated rent
- $1,199 medium interval (Pro) →
- Mortgage (P&I)
- −$367
- Tax from tax record
- −$26 /mo · $317/yr
- Insurance
- −$29
- HOA
- −$0
- Vacancy / Maint / Mgmt
- −$252
- Net cashflow
- $525
Break-even live
Sensitivity live
| Price | -10% $564 | -5% $544 | +0% $525 | +5% $505 | +10% $485 |
|---|---|---|---|---|---|
| Rent | -10% $430 | -5% $477 | +0% $525 | +5% $572 | +10% $619 |
| Rate | -1.0pp $560 | -0.5pp $542 | base $525 | +0.5pp $506 | +1.0pp $488 |
UW: 25.0% down · 7.5% · 30yr · 1.5% tax · 5.0% vac · 8.0% maint · 8.0% mgmt
Financing live
Cash to close
- Down payment
- $17,500
- Closing costs
- $2,100
- Reserves months
- —
- Total cash needed
- —
Loan-product check · same deal, 3 products live
Conventional
25% down · 7.5% · 30yr
- Down + closing
- —
- Monthly P&I
- —
- Monthly cashflow
- —
- DSCR
- —
- Eligible?
- —
Personal DTI + credit; lowest rate.
DSCR
20% down · 8.5% · 30yr
- Down + closing
- —
- Monthly P&I
- —
- Monthly cashflow
- —
- DSCR
- —
- Eligible?
- —
No personal income docs; deal must DSCR.
Hard money
10% down · 12.0% · 12mo
- Down + closing
- —
- Monthly P&I
- —
- Monthly cashflow
- —
- DSCR
- —
- Eligible?
- —
Short-term bridge; refi at stabilization.
Listing history 18 events
-
2026-06-13statusdays on market $69,999 Pending 159 DOM
-
2026-06-10days on market $69,999 Active 157 DOM
-
2026-06-09days on market $69,999 Active 156 DOM
-
2026-06-08days on market $69,999 Active 155 DOM
-
2026-06-07days on market $69,999 Active 154 DOM
-
2026-06-05days on market $69,999 Active 151 DOM
-
2026-06-02days on market $69,999 Active 149 DOM
-
2026-06-01days on market $69,999 Active 148 DOM
-
2026-05-31days on market $69,999 Active 147 DOM
-
2026-05-30days on market $69,999 Active 146 DOM
-
2026-05-13status Active
-
2026-05-12historical
-
2026-05-01status Active
-
2026-04-09status Pending
-
2026-03-17price $69,999
-
2026-01-22price $79,999
-
2025-12-12$89,999 Active
-
2006-07-28soldstatus $71,000
ⓘ Source: listings_history table (triggers on properties + properties_extension) + one-shot
backfill from property_details.listing_events for pre-trigger history.
Tax reassessment forecast FL · Resets to sale price
- Current annual tax
- $317 · $26/mo
- Projected year-2 tax
- $581 · $48/mo
- Expected delta
- +$264/yr (+$22/mo · 83.2%)
ⓘ Screening estimate from a state-policy table — verify with the county assessor before closing.
Climate risk First Street
- Flood 1/10 Low FEMA zone X (unshaded) · 0% chance over 30 yrs
- Wildfire 5/10 Major
- Heat 8/10 Severe 7 d/yr ≥107°F today · 19 d/yr by 30 yrs out
- Wind 9/10 Extreme 99% chance of damaging wind over 30 yrs
- Air quality 2/10 Low 1 unhealthy d/yr today · 1 by 30 yrs out
Nearby sold comps map
Loading sold comps map…
Walkable amenities ~0.75 mi
Loading nearby amenities…
Taxation est. · year 1
- Rental income
- $14,388
- − Mortgage interest
- −$3,921
- − Property taxes
- −$317
- − Insurance
- −$350
- − Repairs & maintenance
- −$1,151
- − Management
- −$1,151
- − Depreciation
- −$2,036
- Taxable income
- $5,461
- Est. tax owed @ 24.0%
- −$1,311
- After-tax cash flow
- $4,983/yr
For passive investors: Depreciation is non-cash, so a rental often shows a tax loss while cash-flowing — sheltering income. Rental losses are passive: they offset passive income freely, and up to $25,000/yr can offset ordinary (W-2) income if you actively participate and your MAGI is under $100k (phasing out to $0 by $150k); unused losses carry forward. On sale, claimed depreciation is recaptured at up to 25%, and gains may owe capital-gains tax (a 1031 exchange can defer both). Figures are a year-1 estimate at your 24.0% rate — not tax advice; consult a CPA.
Schools (NCES district)
- District
- Holmes
- NCES district ID
- 1200900
- Math proficiency
- 44% ▼ -5.00%
- Reading proficiency
- 45% ▼ -7.00%
- Median HH income
- $35,365
- Composite
- 36.83/100
- National rank
- #4558
- State rank
- #53 of 73 in FL
Livability — Bonifay
- Score
- 67/100
- State rank
- #577
- US rank
- #10976
Category grades
Schools grade is shown separately in the Schools card above.
Census & demographics
- Population (ZIP)
- 13,944
Population outlook (Holmes County) Hauer SSP2
- Today (2025)
- 17,963 people
- By 2030
- 17,245 · -4.0%
- By 2040
- 15,970 · -11.1%
- By 2050
- 14,905 · -17.0%
- By 2075
- 12,327 · -31.4%
- By 2100
- 9,760 · -45.7%
Race, ethnicity, and origin ACS 2023
- Neighborhood character
- Predominantly White (81%)
- Race & ethnicity
- White 81% Black 9% Two or more races 6% Hispanic / Latino 4%
- Common ancestry
- Slovak 1% Iranian 1% Lithuanian 1%
- Foreign-born
- 2% · Canada
- Languages at home
- 94% English-only · Spanish 4% Russian/Polish/Slavic 1% French/Haitian/Cajun 1%
Political lean MEDSL · Holmes
- 2024 margin
- Solid R (+80.2) · D 9.7% · R 89.9%
- 2008→2024 swing
- -15.1pp toward R · 2008: -65.0pp · 2024: -80.2pp
- All cycles
- 2024: R+80.2 2020: R+78.9 2016: R+77.9 2012: R+68.3 2008: R+65.0
Not yet ingested
- Civics
- —
Market trends
- HPI YoY
- ▲ 44.87%
- Current HPI
- 322.29
- Rent YoY
- —
- Metro
- —
- State GDP YoY
- ▲ 3.28%
- F500 in state
- 36
Industry mix (Fortune 500 HQ in FL)
| Industry | F500 HQs | Revenue |
|---|---|---|
| Industrial Technology | 2 | $29B |
|
||
| Insurance | 2 | $17B |
|
||
| Retail | 1 | $60B |
|
||
| Technology Distribution | 1 | $58B |
|
||
| Homebuilding | 1 | $35B |
|
||
| Technology Manufacturing | 1 | $35B |
|
||
Price history
-1.4% since first listed8 events — show timeline
- 2026-05-13 Relisted — CPARMLS
- 2026-05-12 Listing Removed — CPARMLS
- 2026-05-01 Relisted — CPARMLS
- 2026-04-09 Pending — CPARMLS
- 2026-03-17 Price Changed $69,999 CPARMLS
- 2026-01-22 Price Changed $79,999 CPARMLS
- 2025-12-12 Listed $89,999 CPARMLS
- 2006-07-28 Sold (Public Records) $71,000 Public Records
Property tax history
-2.0%/yrLatest (2025): $317 · +7.5% YoY. Source: county tax records.
Cash-flow waterfall
monthlySold comps — $/sqft
last 12 mo · ≤1 miLoading sold comps…