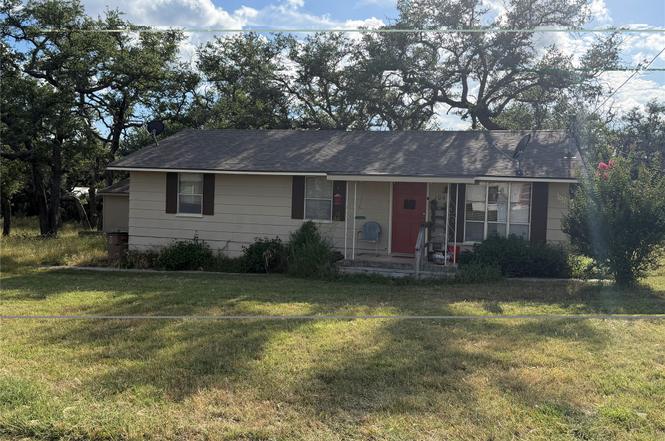
106 County Road 138 · Buchanan Dam, TX
Flood risk 1/10 · Minimal
- FEMA flood zone
- X (unshaded)
- Chance of flooding over 30 yrs
- 0.0%
- Est. flood insurance / yr
- $507 – $1,088
Fire risk 4/10 · Minor
- Est. fire insurance / yr
- $1,222 – $2,270
Heat risk 8/10 · Major
- Hot days now (above 107°F)
- 8 days/yr
- Hot days in 30 yrs
- 27 days/yr
Wind risk 6/10 · Moderate
- Chance of severe wind over 30 yrs
- 46.0%
Air-quality risk 1/10 · Minimal
- Unhealthy air days now
- 0 days/yr
- Unhealthy air days in 30 yrs
- 0 days/yr
Risk factors via First Street. Map © Google.
Why this score? — see what drove the D+ grade
The composite is a weighted blend of 9 inputs, each scored 0–100. Each bar is that input's sub-score; the figure is the points it added to the 100-point composite (weight × sub-score).
- ARV discount +15.0/15.0
- Cash flow +13.0/30.0
- 1% rule +4.8/10.0
- DSCR +3.9/10.0
- Schools +3.2/10.0
- Livability +3.2/5.0
- Rent growth +2.5/5.0
- Condition / age +2.5/5.0
- Appreciation +0.0/10.0
$160,000
🖨 Deal sheet (PDF) 📄 Offer letter ✓ Due diligence
Listing remarks MLS
Nice cottage in Lake Buchanan subdivision. Well maintained with recent plumbing and electrical, serviced air conditioning unit and roof only 2 years old. Large storage building with water and electrical ( would make a grand "man cave") plus separate dry storage area with lean-to for storage of your yard equipment. Pretty lot with lots of shade. Restrictions: Yes
Key facts
- 56 acres
- Boatramp
- 0.56 acre lot
Tags
Neighborhood map
What this means for you Summary
Snapshot
- This is a 3-bed/1.0-bath single-family listed at $160k.
Deal economics
- At list price, monthly cash flow is $-7 ($-90/yr) — negative.
- To cash-flow at today's rent, offer at most $159k (0.8% below list).
- To meet the 1% rule (rent ≥ 1% of price), the offer needs to be $157k (2.1% below list).
- Recommended offer: $157k (2.1% below list) — sets the bar for 1% rule.
- Cap rate 6.2% vs local median 0.6% in Buchanan Dam — top-decile yield for the area; either an underpriced asset or a hidden risk that comps aren't pricing in. Stress-test before assuming the spread holds.
Location & tenants
- Location reads 64/100 on livability (#813 in TX) — a middle-class / working-renter tenant base. Strengths: crime A+, cost of living A+, housing A+; Watch: schools F, amenities F, commute F.
- Burnet CISD (rural): math 36% / reading 38% proficiency, ranked #465 of 826 in TX (top 56%) — families likely to look elsewhere, expect single-tenant / working-renter base with shorter leases.
- Market conditions: 554 active listings in the ZIP; solid renter incomes; 891 units permitted in Burnet County in 2024 (76 in 5+ unit buildings).
Forward outlook
- Local home prices are declining (-3.0%/yr); year-one equity from $1k of loan paydown is wiped out by about $5k of value loss. Plan a longer hold.
- Burnet County population projected at +22% by 2050 — long-run rental-demand tailwind backs the buy-and-hold thesis.
Negotiation context
- Only 0 days on market — expect competitive offers; lowballing is unlikely to land.
- 3 sale attempts since 16y ago; this cycle's ask is 48% above the opening price — seller raised mid-cycle; expect resistance to lowballs.
Risks & watch-outs
- Climate carrying-cost: major wind risk, 46% chance of damaging wind over 30y; extreme-heat days projected 8→27/yr by 2055 (HVAC capex compounding) — expect insurance premiums to compound above CPI over the hold.
Questions for the listing agent
- What do current leases actually rent for vs. the listed asking? Can we see a recent rent roll and the last 12 months of T-12 income?
- Built in 1970 — when were the roof, HVAC, electrical panel, plumbing, and water heater last replaced?
- What does the HOA fee cover, when was the last increase, and are there any pending special assessments or reserve-fund shortfalls?
- Is there a deadline driving the sale (1031 exchange, divorce, estate, relocation)? That informs how much negotiation room exists.
- Schools are F-rated, which usually means shorter tenancies and higher turnover. Who's the typical renter profile here, and what's been the actual vacancy rate?
- The area grade is low — what's the realistic commute time and amenity access for the typical tenant pool here? Any planned neighborhood developments (good or bad) we should know about?
- What's the average days-on-market for RENTAL listings here right now (not sales)? A rising rental-DOM trend means longer vacancies and softer asking-rent achievability than the comps imply.
- What's the recent tenant-quality profile in this submarket — average credit score on applications, eviction rate, late-payment / NSF rate, and stable-employment percentage? A property-management company in the area should have these aggregated.
- How much new for-sale + rental construction is in the pipeline within 1–3 miles? Heavy new supply typically softens prices + rents 12–24 months out; constrained supply supports both.
Investment metrics
- 1% rule
- 0.98% ✗
- Cap rate
- 6.24%
- Cash-on-cash
- -0.20%
- DSCR
- 0.99
- GRM
- 8.5
CMA / ARV
- ARV (on-the-fly)
- $197,760
- Comps found
- 1
Show comp detail 1 sale within ~0.75 mi
| Address | Dist | Beds/Ba | Sqft | Sold | Price | $/sf | Match |
|---|---|---|---|---|---|---|---|
| 109 County Road 138 | 0.03mi | 2/1.0 (-1) | 964 (+0%) | 2mo | $199,000 | $206 | 91 |
Match score weights: distance 35% · size 25% · config 20% · recency 20%. Top-matched comps best support the ARV.
Projected returns pro-forma
-3.0% appreciation · 3.0% rent growth · sell at horizon
- IRR
- -16.6%
- Equity multiple
- 0.41×
- Total profit
- $-26,295
- Equity at exit
- $23,857
- IRR
- -8.2%
- Equity multiple
- 0.49×
- Total profit
- $-23,069
- Equity at exit
- $13,834
Cash invested: $44,800 (down + closing). Projections, not guarantees.
Landlord ↔ Tenant lean methodology
- Overall (STATE)
- 87 Strongly Landlord-Friendly
- State Texas
- 87 Strongly Landlord-Friendly · R+5
- County
- — inherits STATE
- City
- — inherits STATE
ZIP-level market 78611
- Home prices YoY
- -24.7%
- Active inventory
- 554
- Price-to-rent
- 8.5×
Monthly cashflow live
- Estimated rent
- $1,566 medium interval (Pro) →
- Mortgage (P&I)
- −$839
- Tax from tax record
- −$219 /mo · $2,628/yr
- Insurance
- −$67
- HOA
- −$120
- Vacancy / Maint / Mgmt
- −$329
- Net cashflow
- $-7
Break-even live
Sensitivity live
| Price | -10% $83 | -5% $38 | +0% $-7 | +5% $-53 | +10% $-98 |
|---|---|---|---|---|---|
| Rent | -10% $-131 | -5% $-69 | +0% $-7 | +5% $54 | +10% $116 |
| Rate | -1.0pp $73 | -0.5pp $33 | base $-7 | +0.5pp $-49 | +1.0pp $-91 |
UW: 25.0% down · 7.5% · 30yr · 1.5% tax · 5.0% vac · 8.0% maint · 8.0% mgmt
Financing live
Cash to close
- Down payment
- $40,000
- Closing costs
- $4,800
- Reserves months
- —
- Total cash needed
- —
Loan-product check · same deal, 3 products live
Conventional
25% down · 7.5% · 30yr
- Down + closing
- —
- Monthly P&I
- —
- Monthly cashflow
- —
- DSCR
- —
- Eligible?
- —
Personal DTI + credit; lowest rate.
DSCR
20% down · 8.5% · 30yr
- Down + closing
- —
- Monthly P&I
- —
- Monthly cashflow
- —
- DSCR
- —
- Eligible?
- —
No personal income docs; deal must DSCR.
Hard money
10% down · 12.0% · 12mo
- Down + closing
- —
- Monthly P&I
- —
- Monthly cashflow
- —
- DSCR
- —
- Eligible?
- —
Short-term bridge; refi at stabilization.
HOA detail
- Monthly dues
- $120 · $1,440/yr
- Likely covers
- waterelectric
Listing history 3 events
-
2026-06-21remarks 504-char remark
-
2026-06-19remarks 87-char remark
-
2026-06-19$160,000 Active
ⓘ Source: listings_history table (triggers on properties + properties_extension) + one-shot
backfill from property_details.listing_events for pre-trigger history.
Tax reassessment forecast TX · Resets to sale price
- Current annual tax
- $2,628 · $219/mo
- Projected year-2 tax
- $2,928 · $244/mo
- Expected delta
- +$300/yr (+$25/mo · 11.4%)
ⓘ Screening estimate from a state-policy table — verify with the county assessor before closing.
Climate risk First Street
- Flood 1/10 Low FEMA zone X (unshaded) · 0% chance over 30 yrs
- Wildfire 4/10 Moderate
- Heat 8/10 Severe 8 d/yr ≥107°F today · 27 d/yr by 30 yrs out
- Wind 6/10 Major 46% chance of damaging wind over 30 yrs
- Air quality 1/10 Low 0 unhealthy d/yr today · 0 by 30 yrs out
Nearby sold comps map
Loading sold comps map…
Walkable amenities ~0.75 mi
Loading nearby amenities…
Taxation est. · year 1
- Rental income
- $18,793
- − Mortgage interest
- −$8,962
- − Property taxes
- −$2,628
- − Insurance
- −$800
- − Repairs & maintenance
- −$1,503
- − Management
- −$1,503
- − HOA
- −$1,440
- − Depreciation
- −$4,655
- Taxable loss
- −$2,699
- Est. tax savings @ 24.0%
- +$648
- After-tax cash flow
- $558/yr
For passive investors: Depreciation is non-cash, so a rental often shows a tax loss while cash-flowing — sheltering income. Rental losses are passive: they offset passive income freely, and up to $25,000/yr can offset ordinary (W-2) income if you actively participate and your MAGI is under $100k (phasing out to $0 by $150k); unused losses carry forward. On sale, claimed depreciation is recaptured at up to 25%, and gains may owe capital-gains tax (a 1031 exchange can defer both). Figures are a year-1 estimate at your 24.0% rate — not tax advice; consult a CPA.
Schools (NCES district)
- District
- Burnet CISD
- NCES district ID
- 4812220
- Math proficiency
- 36% ▼ -3.00%
- Reading proficiency
- 38% ▬ 0.00%
- Median HH income
- $50,890
- Composite
- 32.09/100
- National rank
- #5811
- State rank
- #465 of 826 in TX
Livability — Buchanan Dam
- Score
- 64/100
- State rank
- #813
- US rank
- #14766
Category grades
Schools grade is shown separately in the Schools card above.
Census & demographics
- County
- Burnet County · 35,210 people
- City population
- 1,826
- Metro
- nan
- Population (ZIP)
- 14,560
- Household income
- $80,938
- Rent vs Own
- Severe rent burden
- 218.0
Population outlook (Burnet County) Hauer SSP2
- Today (2025)
- 50,492 people
- By 2030
- 52,995 · +5.0%
- By 2040
- 57,528 · +13.9%
- By 2050
- 61,444 · +21.7%
- By 2075
- 71,098 · +40.8%
- By 2100
- 74,634 · +47.8%
Race, ethnicity, and origin ACS 2023
- Neighborhood character
- Predominantly White (76%)
- Race & ethnicity
- White 76% Hispanic / Latino 16% Two or more races 9% Black 3%
- Hispanic origin (detail)
- Mexican 13%
- Common ancestry
- Italian 4% Slovak 3% Serbian 2%
- Foreign-born
- 6% · Canada, Vietnam
- Languages at home
- 91% English-only · Spanish 8% Vietnamese 1%
Political lean MEDSL · Burnet
- 2024 margin
- Solid R (+55.7) · D 21.7% · R 77.4%
- 2008→2024 swing
- -11.6pp toward R · 2008: -44.1pp · 2024: -55.7pp
- All cycles
- 2024: R+55.7 2020: R+53.1 2016: R+56.8 2012: R+54.6 2008: R+44.1
Not yet ingested
- Civics
- —
Market trends
- HPI YoY
- ▼ -83.25%
- Current HPI
- 253.5299
- Rent YoY
- —
- Metro
- nan
- State GDP YoY
- ▲ 3.95%
- F500 in state
- 110
Industry mix (Fortune 500 HQ in TX)
| Industry | F500 HQs | Revenue |
|---|---|---|
| Energy | 16 | $1,198B |
|
||
| Technology | 5 | $198B |
|
||
| Engineering / Construction | 4 | $72B |
|
||
| Energy Services | 3 | $60B |
|
||
| Utilities | 3 | $41B |
|
||
| Healthcare | 2 | $330B |
|
||
Price history
+0.0% since first listed6 events — show timeline
- 2014-11-25 Listing Removed — CTXMLS
- 2014-11-25 Sold (MLS) — Unlock MLS
- 2014-09-03 Listed $108,000 CTXMLS
- 2014-07-22 Listed $108,000 Unlock MLS
- 2011-02-17 Delisted — Unlock MLS
- 2010-02-03 Listed — Unlock MLS
Property tax history
+9.4%/yrLatest (2026): $2,628 · +40.7% YoY. Source: county tax records.
Cash-flow waterfall
monthlySold comps — $/sqft
last 12 mo · ≤1 miLoading sold comps…