 🏷️ Likely Rental
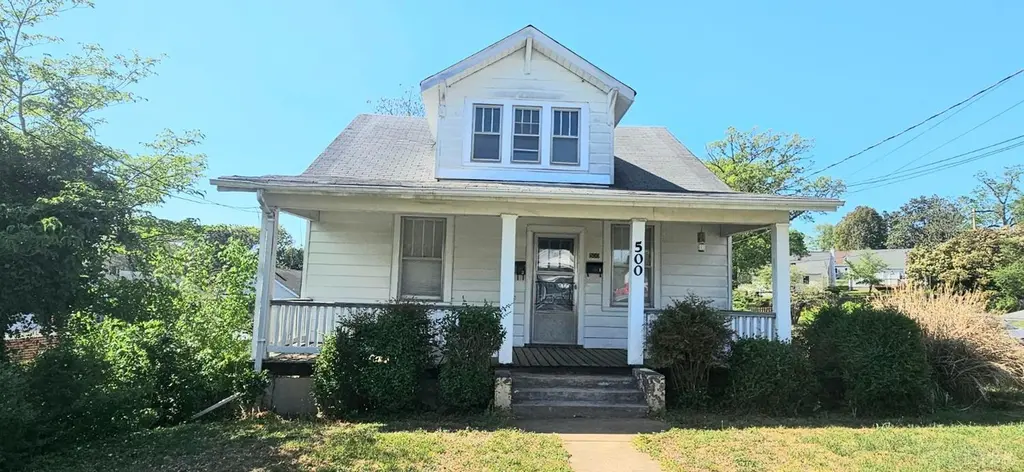
500 Stafford St · Lynchburg, VA
Flood risk 1/10 · Minimal
- FEMA flood zone
- X (unshaded)
- Chance of flooding over 30 yrs
- 0.0%
- Est. flood insurance / yr
- $473 – $860
Fire risk 1/10 · Minimal
- Est. fire insurance / yr
- $666 – $1,236
Heat risk 6/10 · Moderate
- Hot days now (above 101°F)
- 7 days/yr
- Hot days in 30 yrs
- 18 days/yr
Wind risk 2/10 · Minimal
- Chance of severe wind over 30 yrs
- 3.0%
Air-quality risk 2/10 · Minimal
- Unhealthy air days now
- 0 days/yr
- Unhealthy air days in 30 yrs
- 1 days/yr
Risk factors via First Street. Map © Google.
Why this score? — see what drove the C- grade
The composite is a weighted blend of 9 inputs, each scored 0–100. Each bar is that input's sub-score; the figure is the points it added to the 100-point composite (weight × sub-score).
- Cash flow +15.8/30.0
- ARV discount +15.0/15.0
- DSCR +4.9/10.0
- Livability +4.5/5.0
- Schools +4.0/10.0
- 1% rule +3.4/10.0
- Rent growth +2.8/5.0
- Condition / age +2.5/5.0
- Appreciation +0.0/10.0
$187,900
🖨 Deal sheet 📄 Offer letter ✓ Due diligence
Listing remarks MLS
NEW PRICE !! Excellent Investment Opportunity !! 3 one bdrm units walking distance to University of Lynchburg. 1st floor has a door between the two 1 bdrm apartments which if opened could make a 2 or 3 bdrm mmain level apartment & still have an upstairs unit . New laminate flooring & carpet throughout. New interior paint, 3 electric boxes, 3 hot water heaters, 2 heat pumps on main level & a mini split in 2nd floor apart. 2 car carport area under property. Aluminum siding. Two 1st floor apartments w/ 1 bdrm, 1 bath, LR, Kitchens w/ range, refrigerator & microwave (1 apartment has new butcher block countertops), 1 second floor apartment w/ 1 bdrm LR, full bath (new sink & shower stall) & kitchen . Full walkout basement w/ laundry area. Shingle roof on main house Rubber roof over rear apartment. Corner lot. Previously rented for $1535 total . Last rented approx late in 2024.Covered front porch, large concrete patio at rear entry. Seller paid water which averaged 90 per month + grass cutting
Key facts
- 3 electric boxes
- 3 hot water heaters
- New interior paint
Tags
Neighborhood map
What this means for you Summary
Snapshot
- This is a 3-bed/3.0-bath other listed at $188k.
Deal economics
- At list price, monthly cash flow is $85 ($1k/yr) — positive.
- The deal already cash-flows at list — no discount required.
- To meet the 1% rule (rent ≥ 1% of price), the offer needs to be $159k (15.6% below list).
- Recommended offer: $159k (15.6% below list) — sets the bar for 1% rule.
- Cap rate 6.8% vs local median 4.0% in Lynchburg — top-decile yield for the area; either an underpriced asset or a hidden risk that comps aren't pricing in. Stress-test before assuming the spread holds.
Location & tenants
- Location reads 91/100 on livability (#1 in VA, #58 nationally) — a professional / high-income tenant draw. Strengths: amenities A+, commute A+, cost of living A+; Watch: crime C-, employment D+.
- Lynchburg City Public School District (urban): math 36% / reading 61% proficiency, ranked #104 of 131 in VA (top 79%) — families likely to look elsewhere, expect single-tenant / working-renter base with shorter leases; 61% free/reduced lunch — lower-income household profile, screen leases tightly.
- Market conditions: Rents rising (+1.1%/yr); 216 active listings in the ZIP; 29 comparable units currently listed for rent nearby; rentals lingering (median 44d on market — plan ~5-8 weeks vacancy on turnover, expect pricing pressure); 52% of comp listings sitting > 30 days — soft ceiling on asking rent; lower-income renter base — watch delinquency; 472 units permitted in Lynchburg city in 2024 (240 in 5+ unit buildings).
- At $1,586/mo this rent would consume 45% of the median local household income ($42k/yr) (locally 1717% of renters already pay >50% of income on rent) — very limited rent-growth headroom before tenants either downsize or default.
Forward outlook
- Local home prices are declining (-3.0%/yr); year-one equity from $1k of loan paydown is wiped out by about $6k of value loss. Plan a longer hold.
- Lynchburg County population projected at +37% by 2050 — long-run rental-demand tailwind backs the buy-and-hold thesis.
Negotiation context
- It's been on market 63 days — a 6% lower offer ($177k) is reasonable based on typical stale-listing flexibility.
Risks & watch-outs
- Watch-outs: built in 1929 — expect roof / HVAC / electrical / plumbing capex.
- Climate carrying-cost: extreme-heat days projected 7→18/yr by 2055 (HVAC capex compounding) — expect insurance premiums to compound above CPI over the hold.
Questions for the listing agent
- It's been on market 63 days. Have you received any prior offers? Is the seller open to a 16% concession, seller financing, or rate buy-down credit?
- Built in 1929 — when were the roof, HVAC, electrical panel, plumbing, and water heater last replaced?
- Why hasn't it sold? Are there any deal-killer items the seller is aware of (foundation, flood, title, zoning, code violations)?
- Is there a deadline driving the sale (1031 exchange, divorce, estate, relocation)? That informs how much negotiation room exists.
- Schools are A-rated — typically a magnet for longer-tenancy family renters. What's the average tenant stay here, and is there a school-zone premium baked into asking?
- What's the average days-on-market for RENTAL listings here right now (not sales)? A rising rental-DOM trend means longer vacancies and softer asking-rent achievability than the comps imply.
- What's the recent tenant-quality profile in this submarket — average credit score on applications, eviction rate, late-payment / NSF rate, and stable-employment percentage? A property-management company in the area should have these aggregated.
- How much new for-sale + rental construction is in the pipeline within 1–3 miles? Heavy new supply typically softens prices + rents 12–24 months out; constrained supply supports both.
Investment metrics
- 1% rule
- 0.84% ✗
- Cap rate
- 6.84%
- Cash-on-cash
- 1.94%
- DSCR
- 1.09
- GRM
- 9.9
CMA / ARV
- ARV (median comp)
- $264,706
- List price
- $187,900
- Delta
- -29.02%
- Verdict
- UNDERPRICED
- Comps
- 5 within 1.0 mi
Projected returns pro-forma
-3.0% appreciation · 1.15% rent growth · sell at horizon
- IRR
- -15.2%
- Equity multiple
- 0.47×
- Total profit
- $-27,975
- Equity at exit
- $28,017
- IRR
- -9.7%
- Equity multiple
- 0.45×
- Total profit
- $-29,061
- Equity at exit
- $16,246
Cash invested: $52,612 (down + closing). Projections, not guarantees.
Landlord ↔ Tenant lean methodology
- Overall (STATE)
- 55 Moderately Landlord-Leaning
- State Virginia
- 55 Moderately Landlord-Leaning · D+2
- County
- — inherits STATE
- City
- — inherits STATE
ZIP-level market 24501
- Rents YoY
- 1.1%
- Active inventory
- 216
- Price-to-rent
- 9.9×
Monthly cashflow live
- Estimated rent
- $1,586 high interval (Pro) →
- Mortgage (P&I)
- −$985
- Tax from tax record
- −$104 /mo · $1,251/yr
- Insurance
- −$78
- HOA
- −$0
- Vacancy / Maint / Mgmt
- −$333
- Net cashflow
- $85
Break-even live
UW: 25.0% down · 7.5% · 30yr · 1.5% tax · 5.0% vac · 8.0% maint · 8.0% mgmt
Financing live
Cash to close
- Down payment
- $46,975
- Closing costs
- $5,637
- Reserves months
- —
- Total cash needed
- —
Loan-product check · same deal, 3 products live
Conventional
25% down · 7.5% · 30yr
- Down + closing
- —
- Monthly P&I
- —
- Monthly cashflow
- —
- DSCR
- —
- Eligible?
- —
Personal DTI + credit; lowest rate.
DSCR
20% down · 8.5% · 30yr
- Down + closing
- —
- Monthly P&I
- —
- Monthly cashflow
- —
- DSCR
- —
- Eligible?
- —
No personal income docs; deal must DSCR.
Hard money
10% down · 12.0% · 12mo
- Down + closing
- —
- Monthly P&I
- —
- Monthly cashflow
- —
- DSCR
- —
- Eligible?
- —
Short-term bridge; refi at stabilization.
Rent comps 29 comps
| Address | Beds | Baths | Sqft | Rent | $/sqft | DOM | Units | Dist |
|---|---|---|---|---|---|---|---|---|
| 101 Thomas Rd Unit A Lynchburg, VA | 3.0 | 1.0 | 1530 | $1,395 | $0.91 | 44d | 1 | 0.26mi |
| 310 Yeardley Ave Lynchburg, VA | 4.0 | 2.5 | 1888 | $1,800 | $0.95 | 21d | 1 | 0.42mi |
| 206 Connecticut Ave Lynchburg, VA | 4.0 | 2.5 | 2180 | $1,650 | $0.76 | 21d | 1 | 0.43mi |
| 4624 Ferncliff Dr Lynchburg, VA | 3.0 | 2.0 | 2064 | $1,700 | $0.82 | 44d | 1 | 0.54mi |
| 4300 Tremont St Lynchburg, VA | 3.0 | 1.0 | 1122 | $1,200 | $1.07 | 44d | 1 | 0.55mi |
| 4612 Greenwood Dr Lynchburg, VA | 3.0 | 1.0 | 1257 | $1,595 | $1.27 | 21d | 1 | 0.56mi |
| 106 Yeardley Ave Unit B Lynchburg, VA | 3.0 | 1.0 | 1060 | $895 | $0.84 | 21d | 1 | 0.65mi |
| 2920 Richmond St Lynchburg, VA | 4.0 | 1.0 | 1472 | $1,695 | $1.15 | 21d | 1 | 0.73mi |
| 1309 Radcliff Ave Lynchburg, VA | 4.0 | 2.5 | 1658 | $1,725 | $1.04 | 44d | 1 | 0.90mi |
| 1009 Lindsay St Lynchburg, VA | 3.0 | 2.0 | 1050 | $1,800 | $1.71 | 44d | 1 | 0.92mi |
| 216 Kenyon St Lynchburg, VA | 2.0 | 1.0 | 1114 | $995 | $0.89 | 44d | 1 | 0.96mi |
| 1810 Broadway St #112 Lynchburg, VA | 2.0 | 2.5 | 1210 | $1,600 | $1.32 | 44d | 1 | 1.04mi |
| 320 Kenyon St Lynchburg, VA | 3.0 | 2.0 | 1736 | $1,595 | $0.92 | 44d | 1 | 1.05mi |
| 1400 Weeping Willow Dr Apt A Lynchburg, VA | 1.0–3.0 | 1.0–2.0 | 1003 | $1,601 | $1.60 | 13d | 12 | 1.07mi |
| 1116 Chestnut Hill Dr Lynchburg, VA | 4.0 | 2.0 | 1818 | $1,895 | $1.04 | 44d | 1 | 1.12mi |
| 1116 Chestnut Hill Dr Lynchburg, VA | 4.0 | 2.0 | 1818 | $2,095 | $1.15 | 13d | 1 | 1.12mi |
| 2734 Fort Ave Lynchburg, VA | 1.0–2.0 | 1.0–2.0 | 875 | $1,450 | $1.66 | 44d | 1 | 1.14mi |
| 403 Grove St Lynchburg, VA | 3.0 | 2.0 | 1400 | $1,600 | $1.14 | 44d | 1 | 1.23mi |
| 2121 Langhorne Rd Unit 11041092SF 2BR/2BA Lynchburg, VA | 2.0 | 2.0 | 1092 | $1,495 | $1.37 | 21d | 1 | 1.24mi |
| 2121 Langhorne Rd Unit 11011559SF 3BR/2BA Lynchburg, VA | 3.0 | 2.0 | 1559 | $1,695 | $1.09 | 21d | 1 | 1.24mi |
| 630 Park Ln Lynchburg, VA | 4.0 | 1.5 | 1434 | $1,895 | $1.32 | 13d | 1 | 1.25mi |
| 2245 Landover Pl Lynchburg, VA | 1.0–3.0 | 1.0–1.5 | 925 | $965 | $1.04 | 44d | 2 | 1.27mi |
| 2121 Langhorne Rd Lynchburg, VA | 2.0 | 2.0 | 1142 | $1,575 | $1.38 | 21d | 1 | 1.27mi |
| 913 Sandusky Dr Lynchburg, VA | 4.0 | 3.0 | 2200 | $2,200 | $1.00 | 13d | 1 | 1.32mi |
| 710 Grady St Unit B Lynchburg, VA | 2.0 | 1.0 | 1872 | $795 | $0.42 | 13d | 1 | 1.39mi |
| 2421 Old Forest Rd Lynchburg, VA | 3.0 | 2.0 | 1400 | $1,550 | $1.11 | 44d | 1 | 1.44mi |
| 2269 Aragon St Lynchburg, VA | 3.0 | 2.0 | 1200 | $1,695 | $1.41 | 44d | 1 | 1.44mi |
| 128 Brenleigh Ct Lynchburg, VA | 2.0–3.0 | 2.0 | 1365 | $1,695 | $1.24 | 13d | 1 | 1.45mi |
| 311 Killarney Ct Lynchburg, VA | 3.0 | 2.0 | 1300 | $1,295 | $1.00 | 44d | 1 | 1.50mi |
Listing history 21 events
-
2026-06-19days on market $187,900 Active 63 DOM
-
2026-06-18days on market $187,900 Active 62 DOM
-
2026-06-17days on market $187,900 Active 61 DOM
-
2026-06-16days on market $187,900 Active 60 DOM
-
2026-06-15days on market $187,900 Active 59 DOM
-
2026-06-14days on market $187,900 Active 57 DOM
-
2026-06-13days on market $187,900 Active 56 DOM
-
2026-06-10days on market $187,900 Active 54 DOM
-
2026-06-09days on market $187,900 Active 53 DOM
-
2026-06-08days on market $187,900 Active 52 DOM
-
2026-06-07days on market $187,900 Active 51 DOM
-
2026-06-03days on market $187,900 Active 47 DOM
-
2026-06-02days on market $187,900 Active 46 DOM
-
2026-06-01days on market $187,900 Active 45 DOM
-
2026-05-31days on market $187,900 Active 44 DOM
-
2026-05-30days on market $187,900 Active 43 DOM
-
2026-04-28price $199,900 1038-char remark
Show marketing remark (1038 chars)
NEW PRICE !! Excellent Investment Opportunity !! 3 one bdrm units walking distance to University of Lynchburg. 1st floor has a door between the two 1 bdrm apartments which if opened could make a 2 or 3 bdrm mmain level apartment & still have an upstairs unit . New laminate flooring & carpet throughout. New interior paint, 3 electric boxes, 3 hot water heaters, 2 heat pumps on main level & a mini split in 2nd floor apart. 2 car carport area under property. Aluminum siding. Two 1st floor apartments w/ 1 bdrm, 1 bath, LR, Kitchens w/ range, refrigerator & microwave (1 apartment has new butcher block countertops), 1 second floor apartment w/ 1 bdrm LR, full bath (new sink & shower stall) & kitchen . Full walkout basement w/ laundry area. Shingle roof on main house Rubber roof over rear apartment. Corner lot. Previously rented for $1535 total . Last rented approx late in 2024.Covered front porch, large concrete patio at rear entry. Seller paid water which averaged 90 per month + grass cutting
-
2026-04-17$219,900 Active 1038-char remark
Show marketing remark (1038 chars)
NEW PRICE !! Excellent Investment Opportunity !! 3 one bdrm units walking distance to University of Lynchburg. 1st floor has a door between the two 1 bdrm apartments which if opened could make a 2 or 3 bdrm mmain level apartment & still have an upstairs unit . New laminate flooring & carpet throughout. New interior paint, 3 electric boxes, 3 hot water heaters, 2 heat pumps on main level & a mini split in 2nd floor apart. 2 car carport area under property. Aluminum siding. Two 1st floor apartments w/ 1 bdrm, 1 bath, LR, Kitchens w/ range, refrigerator & microwave (1 apartment has new butcher block countertops), 1 second floor apartment w/ 1 bdrm LR, full bath (new sink & shower stall) & kitchen . Full walkout basement w/ laundry area. Shingle roof on main house Rubber roof over rear apartment. Corner lot. Previously rented for $1535 total . Last rented approx late in 2024.Covered front porch, large concrete patio at rear entry. Seller paid water which averaged 90 per month + grass cutting
-
2007-08-20soldstatus $185,000
-
1995-05-02soldstatus $175,000
-
1979-05-10soldstatus $30,800
ⓘ Source: listings_history table (triggers on properties + properties_extension) + one-shot
backfill from property_details.listing_events for pre-trigger history.
Tax reassessment forecast VA · Resets to sale price
- Current annual tax
- $1,251 · $104/mo
- Projected year-2 tax
- $1,541 · $128/mo
- Expected delta
- +$290/yr (+$24/mo · 23.2%)
ⓘ Screening estimate from a state-policy table — verify with the county assessor before closing.
Climate risk First Street
- Flood 1/10 Low FEMA zone X (unshaded) · 0% chance over 30 yrs
- Wildfire 1/10 Low
- Heat 6/10 Major 7 d/yr ≥101°F today · 18 d/yr by 30 yrs out
- Wind 2/10 Low 3% chance of damaging wind over 30 yrs
- Air quality 2/10 Low 0 unhealthy d/yr today · 1 by 30 yrs out
Nearby sold comps map
Loading sold comps map…
Walkable amenities ~0.75 mi
Loading nearby amenities…
Taxation est. · year 1
- Rental income
- $19,035
- − Mortgage interest
- −$10,525
- − Property taxes
- −$1,251
- − Insurance
- −$940
- − Repairs & maintenance
- −$1,523
- − Management
- −$1,523
- − Depreciation
- −$5,466
- Taxable loss
- −$2,192
- Est. tax savings @ 24.0%
- +$526
- After-tax cash flow
- $1,549/yr
For passive investors: Depreciation is non-cash, so a rental often shows a tax loss while cash-flowing — sheltering income. Rental losses are passive: they offset passive income freely, and up to $25,000/yr can offset ordinary (W-2) income if you actively participate and your MAGI is under $100k (phasing out to $0 by $150k); unused losses carry forward. On sale, claimed depreciation is recaptured at up to 25%, and gains may owe capital-gains tax (a 1031 exchange can defer both). Figures are a year-1 estimate at your 24.0% rate — not tax advice; consult a CPA.
Schools (NCES district)
- District
- Lynchburg City Public School District
- NCES district ID
- 5102340
- Math proficiency
- 36% ▼ -38.00%
- Reading proficiency
- 61% ▼ -8.00%
- Median HH income
- $39,097
- Composite
- 40.4/100
- National rank
- #3730
- State rank
- #104 of 131 in VA
Livability — Lynchburg
- Score
- 91/100
- State rank
- #1
- US rank
- #58
Category grades
Schools grade is shown separately in the Schools card above.
Census & demographics
- Census place
- Lynchburg, VA
- County
- Lynchburg City · 97,036 people
- City population
- 97,036
- Metro
- Lynchburg, VA
- Population (ZIP)
- 25,006
- Household income
- $42,222
- Rent vs Own
- Severe rent burden
- 1717.0
Population outlook (Lynchburg County) Hauer SSP2
- Today (2025)
- 87,977 people
- By 2030
- 93,626 · +6.4%
- By 2040
- 106,145 · +20.7%
- By 2050
- 120,783 · +37.3%
- By 2075
- 162,249 · +84.4%
- By 2100
- 191,358 · +117.5%
Race, ethnicity, and origin ACS 2023
- Neighborhood character
- Diverse neighborhood (Simpson 0.55)
- Race & ethnicity
- White 58% Black 34% Two or more races 4% Hispanic / Latino 3%
- Common ancestry
- Slovak 1% Italian 1% Serbian 1%
- Foreign-born
- 3% · Canada
- Languages at home
- 96% English-only · Spanish 2%
Political lean MEDSL · Lynchburg
- 2024 margin
- Lean R (+7.9) · D 45.4% · R 53.3% · Other 1.3%
- 2008→2024 swing
- -3.9pp toward R · 2008: -4.0pp · 2024: -7.9pp
- All cycles
- 2024: R+7.9 2020: D+2.6 2016: R+9.0 2012: R+10.6 2008: R+4.0
Not yet ingested
- Civics
- —
Market trends
- HPI YoY
- ▼ -131.06%
- Current HPI
- 223.6839
- Rent YoY
- ▲ 1.15%
- Metro
- Lynchburg, VA
- State GDP YoY
- ▲ 2.40%
- F500 in state
- 50
Industry mix (Fortune 500 HQ in VA)
| Industry | F500 HQs | Revenue |
|---|---|---|
| Aerospace / Defense | 4 | $236B |
|
||
| Technology / Defense | 3 | $32B |
|
||
| Financial Services | 2 | $176B |
|
||
| Utilities | 2 | $27B |
|
||
| Insurance | 2 | $25B |
|
||
| Technology | 2 | $15B |
|
||
Price history
+549.0% since first listed5 events — show timeline
- 2026-04-28 Price Changed $199,900 LMLS
- 2026-04-17 Listed $219,900 LMLS
- 2007-08-20 Sold (Public Records) $185,000 Public Records
- 1995-05-02 Sold (Public Records) $175,000 Public Records
- 1979-05-10 Sold (Public Records) $30,800 Public Records
Property tax history
+1.6%/yrLatest (2025): $1,251 · +12.8% YoY. Source: county tax records.
Cash-flow waterfall
monthlySold comps — $/sqft
last 12 mo · ≤1 miLoading sold comps…