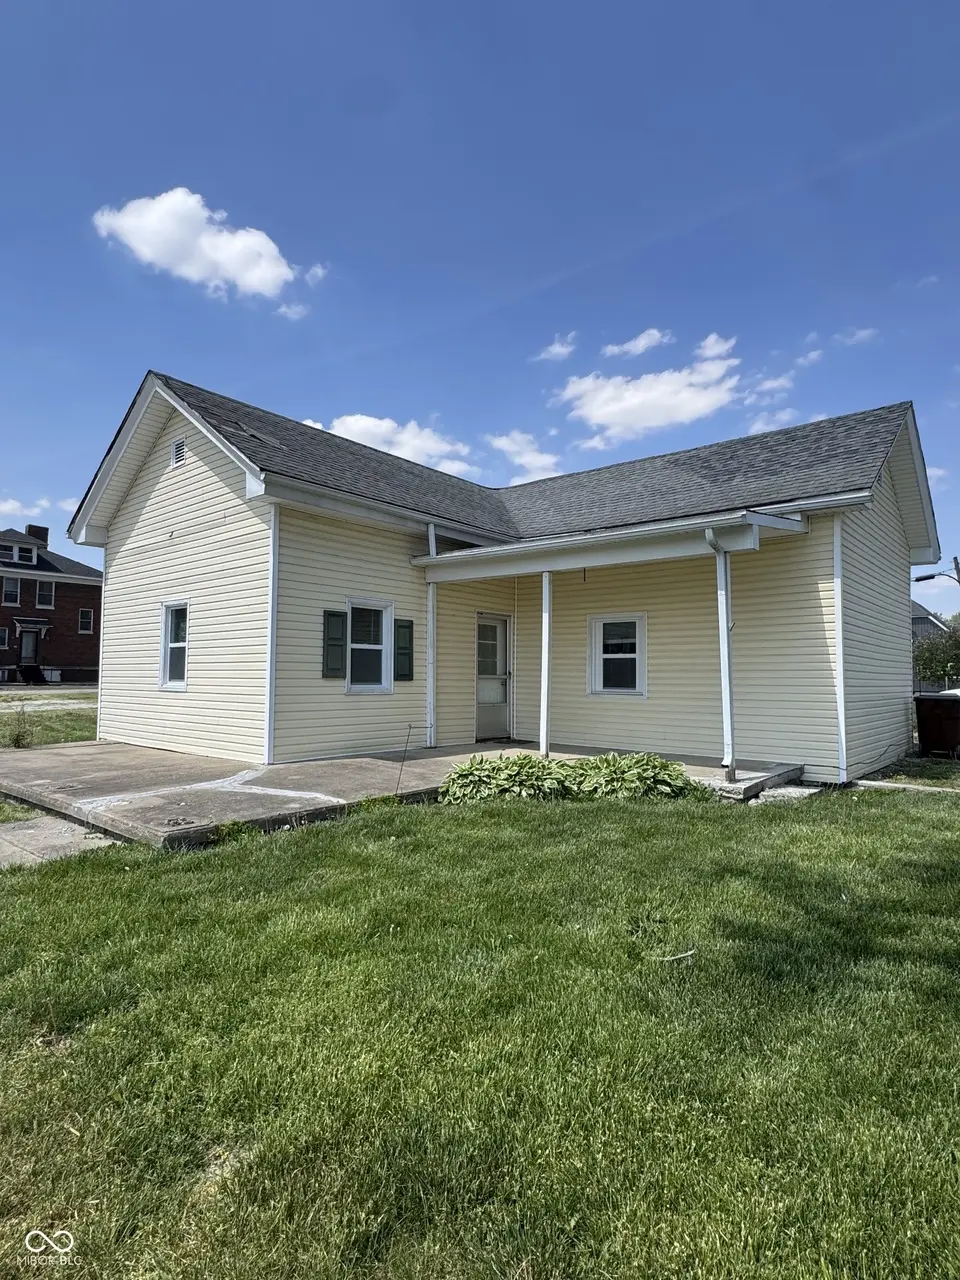
102 W Main St · Milroy, IN
Flood risk 1/10 · Minimal
- FEMA flood zone
- X (unshaded)
- Chance of flooding over 30 yrs
- 0.0%
- Est. flood insurance / yr
- $473 – $860
Fire risk 1/10 · Minimal
- Est. fire insurance / yr
- $717 – $1,331
Heat risk 3/10 · Minor
- Hot days now (above 100°F)
- 7 days/yr
- Hot days in 30 yrs
- 19 days/yr
Wind risk 2/10 · Minimal
- Chance of severe wind over 30 yrs
- 1.0%
Air-quality risk 2/10 · Minimal
- Unhealthy air days now
- 1 days/yr
- Unhealthy air days in 30 yrs
- 2 days/yr
Risk factors via First Street. Map © Google.
Why this score? — see what drove the C- grade
The composite is a weighted blend of 9 inputs, each scored 0–100. Each bar is that input's sub-score; the figure is the points it added to the 100-point composite (weight × sub-score).
- ARV discount +15.0/15.0
- Cash flow +10.5/30.0
- Appreciation +8.6/10.0
- Livability +3.7/5.0
- Schools +3.4/10.0
- DSCR +3.0/10.0
- Rent growth +2.5/5.0
- Condition / age +2.5/5.0
- 1% rule +2.1/10.0
$159,000
🖨 Deal sheet 📄 Offer letter ✓ Due diligence
Listing remarks MLS
Recently remodeled 4 BR 1 bath home on corner lot! New vinyl plank throughout Living room, bathroom hallway and kitchen! New carpet in all the bedrooms. Has side covered porch as well as front covered porch. Gas furnace, window ac, newly remodeled bathroom. Incl stove and refrigerator. Within walking distance to all Milroy has to offer!
Key facts
- Front covered porch
- Side covered porch
- Nice size back yard
Tags
Property features AI
Exterior
- Utilities: Public water; Municipal sewer connected; Electricity connected (100 amp service); Propane (leased)
- Home design: Single-family residence; One level
- Construction: Wood siding; Cellar and crawl space foundation
- Exterior features: Less than 1/4 acre lot (approximately 0.2 acre)
Interior
- Kitchen: Electric oven; Refrigerator
- Bedrooms: Four main-level bedrooms
- Bathrooms: One full bathroom (main level)
- Heating & cooling: Baseboard heating; Forced air heating (natural gas); Window air conditioning units
- Interior features: Eat-in kitchen; Cellar
- Laundry & utility: Laundry connections (all); Sump pump
Neighborhood map
What this means for you Summary
Snapshot
- This is a 2-bed/1.0-bath single-family listed at $159k.
Deal economics
- At list price, monthly cash flow is $-82 ($-982/yr) — negative.
- To cash-flow at today's rent, offer at most $145k (9.1% below list).
- To meet the 1% rule (rent ≥ 1% of price), the offer needs to be $113k (28.7% below list).
- Recommended offer: $113k (28.7% below list) — sets the bar for 1% rule.
Location & tenants
- Location reads 73/100 on livability (#93 in IN) — a middle-class / working-renter tenant base. Strengths: employment A+, cost of living A+, housing A+; Watch: crime C-, amenities F, commute F.
- Rush County Schools (town): math 38% / reading 41% proficiency, ranked #147 of 301 in IN (top 49%) — families likely to look elsewhere, expect single-tenant / working-renter base with shorter leases.
- Zoned schools: Rushville Consolidated High School (math 37% / reading 67%, grade D+, #106 of 369 statewide, top 31%, 654 students, 54% FRL).
- Zoned-school proficiency averages 52% at this address vs 40% district-wide (+12 pts) — the actual schools serving this property are materially stronger than the Rush County Schools average implies; a family-tenant draw the district grade alone would hide.
- Market conditions: 5 active listings in the ZIP; 59 units permitted in Rush County in 2024 (40 in 5+ unit buildings).
Forward outlook
- In year one you build about $13k of equity ($1k loan paydown + $11k appreciation (7.2% local appreciation)).
- Rush County population projected at -22% by 2050 — secular population decline; favor cash flow + early exit over multi-decade hold.
- At projected returns (7.2% appreciation + 3.0% rent growth), your $45k cash investment doubles in ~4 years — after that, you're playing with house money.
- By year 3, paydown + projected appreciation supports a ~$31k cash-out refi (75% LTV) — recoverable capital for the next deal without selling this one.
Negotiation context
- It's been on market 31 days — a 3% lower offer ($154k) is reasonable based on typical stale-listing flexibility.
- 6 sale attempts since 19y ago; this cycle's ask has dropped $10k (6%) from the opening price — seller is motivated, your offer sets the floor, not the list.
- Current owner paid $12k; list at $159k implies a 1283% gain — meaningful room to come down on a strong offer.
Risks & watch-outs
- Watch-outs: built in 1900 — expect roof / HVAC / electrical / plumbing capex.
Questions for the listing agent
- What do current leases actually rent for vs. the listed asking? Can we see a recent rent roll and the last 12 months of T-12 income?
- It's been on market 31 days. Have you received any prior offers? Is the seller open to a 29% concession, seller financing, or rate buy-down credit?
- Built in 1900 — when were the roof, HVAC, electrical panel, plumbing, and water heater last replaced?
- Is there a deadline driving the sale (1031 exchange, divorce, estate, relocation)? That informs how much negotiation room exists.
- Schools are D-rated, which usually means shorter tenancies and higher turnover. Who's the typical renter profile here, and what's been the actual vacancy rate?
- What's the average days-on-market for RENTAL listings here right now (not sales)? A rising rental-DOM trend means longer vacancies and softer asking-rent achievability than the comps imply.
- What's the recent tenant-quality profile in this submarket — average credit score on applications, eviction rate, late-payment / NSF rate, and stable-employment percentage? A property-management company in the area should have these aggregated.
- How much new for-sale + rental construction is in the pipeline within 1–3 miles? Heavy new supply typically softens prices + rents 12–24 months out; constrained supply supports both.
Investment metrics
- 1% rule
- 0.71% ✗
- Cap rate
- 5.68%
- Cash-on-cash
- -2.21%
- DSCR
- 0.90
- GRM
- 11.7
CMA / ARV
- ARV (median comp)
- $196,148
- List price
- $159,000
- Delta
- -18.94%
- Verdict
- UNDERPRICED
- Comps
- 9 within 1.0 mi
Show comp detail 3 sales within ~0.75 mi
| Address | Dist | Beds/Ba | Sqft | Sold | Price | $/sf | Match |
|---|---|---|---|---|---|---|---|
| 202 W Willow St | 0.14mi | 3/2.0 (+1) | 1,410 (-1%) | 1mo | $290,000 | $206 | 82 |
| 311 S Pleasant St | 0.22mi | 3/1.0 (+1) | 1,388 (-3%) | 0mo | $110,000 | $79 | 80 |
| 512 E Main St | 0.30mi | 3/1.5 (+1) | 1,216 (-15%) | 17mo | $221,500 | $182 | 40 |
Match score weights: distance 35% · size 25% · config 20% · recency 20%. Top-matched comps best support the ARV.
Projected returns pro-forma
7.18% appreciation · 3.0% rent growth · sell at horizon
- IRR
- 16.4%
- Equity multiple
- 2.17×
- Total profit
- $51,989
- Equity at exit
- $112,032
- IRR
- 16.0%
- Equity multiple
- 4.48×
- Total profit
- $154,741
- Equity at exit
- $214,507
Cash invested: $44,520 (down + closing). Projections, not guarantees.
Landlord ↔ Tenant lean methodology
- Overall (STATE)
- 90 Strongly Landlord-Friendly
- State Indiana
- 90 Strongly Landlord-Friendly · R+11
- County
- — inherits STATE
- City
- — inherits STATE
ZIP-level market 46156
- Home prices YoY
- 3.3%
- Active inventory
- 5
- Price-to-rent
- 11.7×
Monthly cashflow live
- Estimated rent
- $1,134 medium interval (Pro) →
- Mortgage (P&I)
- −$834
- Tax from tax record
- −$78 /mo · $934/yr
- Insurance
- −$66
- HOA
- −$0
- Vacancy / Maint / Mgmt
- −$238
- Net cashflow
- $-82
Break-even live
UW: 25.0% down · 7.5% · 30yr · 1.5% tax · 5.0% vac · 8.0% maint · 8.0% mgmt
Financing live
Cash to close
- Down payment
- $39,750
- Closing costs
- $4,770
- Reserves months
- —
- Total cash needed
- —
Loan-product check · same deal, 3 products live
Conventional
25% down · 7.5% · 30yr
- Down + closing
- —
- Monthly P&I
- —
- Monthly cashflow
- —
- DSCR
- —
- Eligible?
- —
Personal DTI + credit; lowest rate.
DSCR
20% down · 8.5% · 30yr
- Down + closing
- —
- Monthly P&I
- —
- Monthly cashflow
- —
- DSCR
- —
- Eligible?
- —
No personal income docs; deal must DSCR.
Hard money
10% down · 12.0% · 12mo
- Down + closing
- —
- Monthly P&I
- —
- Monthly cashflow
- —
- DSCR
- —
- Eligible?
- —
Short-term bridge; refi at stabilization.
Listing history 14 events
-
2026-06-18days on market $159,000 Active 31 DOM
-
2026-06-17days on market $159,000 Active 30 DOM
-
2026-06-16days on market $159,000 Active 29 DOM
-
2026-06-16status $159,000 Active 28 DOM
-
2026-05-08price $159,000 338-char remark
Show marketing remark (338 chars)
Recently remodeled 4 BR 1 bath home on corner lot! New vinyl plank throughout Living room, bathroom hallway and kitchen! New carpet in all the bedrooms. Has side covered porch as well as front covered porch. Gas furnace, window ac, newly remodeled bathroom. Incl stove and refrigerator. Within walking distance to all Milroy has to offer!
-
2026-05-08price $159,000 249-char remark
Show marketing remark (338 chars)
Recently remodeled 4 BR 1 bath home on corner lot! New vinyl plank throughout Living room, bathroom hallway and kitchen! New carpet in all the bedrooms. Has side covered porch as well as front covered porch. Gas furnace, window ac, newly remodeled bathroom. Incl stove and refrigerator. Within walking distance to all Milroy has to offer!
-
2026-04-24$169,000 Active 338-char remark
Show marketing remark (338 chars)
Recently remodeled 4 BR 1 bath home on corner lot! New vinyl plank throughout Living room, bathroom hallway and kitchen! New carpet in all the bedrooms. Has side covered porch as well as front covered porch. Gas furnace, window ac, newly remodeled bathroom. Incl stove and refrigerator. Within walking distance to all Milroy has to offer!
-
2026-04-24$169,000 Active 249-char remark
Show marketing remark (338 chars)
Recently remodeled 4 BR 1 bath home on corner lot! New vinyl plank throughout Living room, bathroom hallway and kitchen! New carpet in all the bedrooms. Has side covered porch as well as front covered porch. Gas furnace, window ac, newly remodeled bathroom. Incl stove and refrigerator. Within walking distance to all Milroy has to offer!
-
2012-10-19historical
Show marketing remark (56 chars)
Two bedroom home in downtown Milroy in need of some TLC.
-
2012-10-18soldstatus $11,500
Show marketing remark (56 chars)
Two bedroom home in downtown Milroy in need of some TLC.
-
2012-08-03$14,900
Show marketing remark (56 chars)
Two bedroom home in downtown Milroy in need of some TLC.
-
2007-09-15soldstatus $32,000
-
2007-08-15soldstatus $33,500
-
2007-06-24$34,900
ⓘ Source: listings_history table (triggers on properties + properties_extension) + one-shot
backfill from property_details.listing_events for pre-trigger history.
Tax reassessment forecast IN · Partial reset (capped growth)
- Current annual tax
- $934 · $78/mo
- Projected year-2 tax
- $1,143 · $95/mo
- Expected delta
- +$209/yr (+$17/mo · 22.3%)
ⓘ Screening estimate from a state-policy table — verify with the county assessor before closing.
Climate risk First Street
- Flood 1/10 Low FEMA zone X (unshaded) · 0% chance over 30 yrs
- Wildfire 1/10 Low
- Heat 3/10 Moderate 7 d/yr ≥100°F today · 19 d/yr by 30 yrs out
- Wind 2/10 Low 100% chance of damaging wind over 30 yrs
- Air quality 2/10 Low 1 unhealthy d/yr today · 2 by 30 yrs out
Nearby sold comps map
Loading sold comps map…
Walkable amenities ~0.75 mi
Loading nearby amenities…
Taxation est. · year 1
- Rental income
- $13,611
- − Mortgage interest
- −$8,906
- − Property taxes
- −$934
- − Insurance
- −$795
- − Repairs & maintenance
- −$1,089
- − Management
- −$1,089
- − Depreciation
- −$4,625
- Taxable loss
- −$3,828
- Est. tax savings @ 24.0%
- +$919
- After-tax cash flow
- $-64/yr
For passive investors: Depreciation is non-cash, so a rental often shows a tax loss while cash-flowing — sheltering income. Rental losses are passive: they offset passive income freely, and up to $25,000/yr can offset ordinary (W-2) income if you actively participate and your MAGI is under $100k (phasing out to $0 by $150k); unused losses carry forward. On sale, claimed depreciation is recaptured at up to 25%, and gains may owe capital-gains tax (a 1031 exchange can defer both). Figures are a year-1 estimate at your 24.0% rate — not tax advice; consult a CPA.
Schools (NCES district)
- District
- Rush County Schools
- NCES district ID
- 1809750
- Math proficiency
- 38% ▼ -14.00%
- Reading proficiency
- 41% ▼ -14.00%
- Median HH income
- $46,237
- Composite
- 33.72/100
- National rank
- #5377
- State rank
- #147 of 301 in IN
Livability — Milroy
- Score
- 73/100
- State rank
- #93
- US rank
- #5351
Category grades
Schools grade is shown separately in the Schools card above.
Census & demographics
- Census place
- Milroy, IN
- Population (ZIP)
- 1,011
Population outlook (Rush County) Hauer SSP2
- Today (2025)
- 15,654 people
- By 2030
- 15,036 · -3.9%
- By 2040
- 13,674 · -12.6%
- By 2050
- 12,239 · -21.8%
- By 2075
- 9,466 · -39.5%
- By 2100
- 7,104 · -54.6%
Race, ethnicity, and origin ACS 2023
- Neighborhood character
- Predominantly White (91%)
- Race & ethnicity
- White 91% Two or more races 5%
- Common ancestry
- Polish 4% Slovak 4% Italian 1%
- Foreign-born
- 0% · Canada
- Languages at home
- 87% English-only · German/W. Germanic 13%
Political lean MEDSL · Rush
- 2024 margin
- Solid R (+54.0) · D 21.9% · R 75.9% · Other 2.2%
- 2008→2024 swing
- -40.4pp toward R · 2008: -13.7pp · 2024: -54.0pp
- All cycles
- 2024: R+54.0 2020: R+54.0 2016: R+52.2 2012: R+34.3 2008: R+13.7
Not yet ingested
- Civics
- —
Market trends
- HPI YoY
- ▲ 7.18%
- Current HPI
- 221.7795
- Rent YoY
- —
- Metro
- —
- State GDP YoY
- ▲ 2.90%
- F500 in state
- 18
Industry mix (Fortune 500 HQ in IN)
| Industry | F500 HQs | Revenue |
|---|---|---|
| Industrial Machinery | 2 | $37B |
|
||
| Healthcare | 1 | $177B |
|
||
| Pharmaceuticals | 1 | $45B |
|
||
| Metals / Steel | 1 | $18B |
|
||
| Agriculture | 1 | $17B |
|
||
| Packaging | 1 | $12B |
|
||
Price history
+355.6% since first listed14 events — show timeline
- 2026-06-19 Relisted — SEIBR
- 2026-06-15 Relisted — MIBOR as Distributed by MLS Grid
- 2026-05-22 Pending — MIBOR as Distributed by MLS Grid
- 2026-05-22 Pending — SEIBR
- 2026-05-08 Price Changed $159,000 SEIBR
- 2026-05-08 Price Changed $159,000 MIBOR as Distributed by MLS Grid
- 2026-04-24 Listed $169,000 MIBOR as Distributed by MLS Grid
- 2026-04-24 Listed $169,000 SEIBR
- 2012-10-19 Listing Removed — MIBOR as Distributed by MLS Grid
- 2012-10-18 Sold (MLS) $11,500 MIBOR as Distributed by MLS Grid
- 2012-08-03 Listed $14,900 MIBOR as Distributed by MLS Grid
- 2007-09-15 Sold (MLS) $32,000 MIBOR as Distributed by MLS Grid
- 2007-08-15 Sold (Public Records) $33,500 Public Records
- 2007-06-24 Listed $34,900 MIBOR as Distributed by MLS Grid
Property tax history
+4.6%/yrLatest (2024): $934 · +0.4% YoY. Source: county tax records.
Cash-flow waterfall
monthlySold comps — $/sqft
last 12 mo · ≤1 miLoading sold comps…