4701 Hilltop Dr · Ocean Springs, MS
Flood risk 4/10 · Minor
- FEMA flood zone
- X (shaded)
- Chance of flooding over 30 yrs
- 0.13%
- Est. flood insurance / yr
- $507 – $1,088
Fire risk 3/10 · Minor
- Est. fire insurance / yr
- $1,241 – $2,305
Heat risk 10/10 · Severe
- Hot days now (above 107°F)
- 7 days/yr
- Hot days in 30 yrs
- 23 days/yr
Wind risk 9/10 · Severe
- Chance of severe wind over 30 yrs
- 99.0%
Air-quality risk 2/10 · Minimal
- Unhealthy air days now
- 1 days/yr
- Unhealthy air days in 30 yrs
- 2 days/yr
Risk factors via First Street. Map © Google.
Why this score? — see what drove the C- grade
The composite is a weighted blend of 9 inputs, each scored 0–100. Each bar is that input's sub-score; the figure is the points it added to the 100-point composite (weight × sub-score).
- ARV discount +15.0/15.0
- Cash flow +14.5/30.0
- Schools +5.3/10.0
- DSCR +4.4/10.0
- Livability +4.3/5.0
- Rent growth +2.8/5.0
- 1% rule +2.7/10.0
- Condition / age +2.5/5.0
- Appreciation +0.0/10.0
$339,900
🖨 Deal sheet (PDF) 📄 Offer letter ✓ Due diligence
Listing remarks
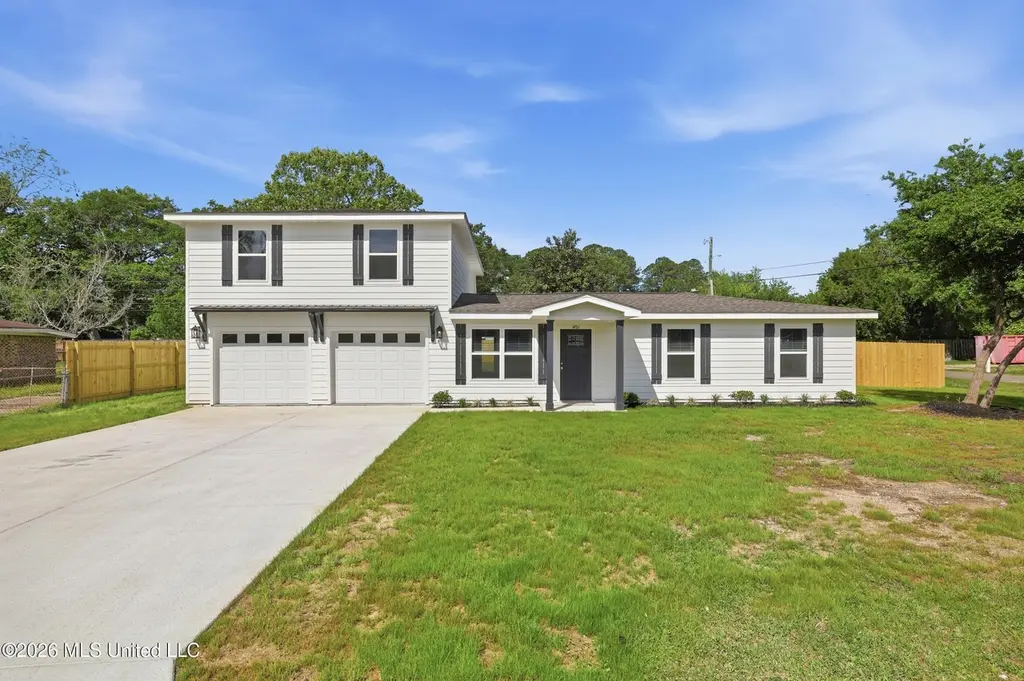
STUNNING FULL REMODEL IN OCEAN SPRINGS! Just 8 mins from downtown, this ''like-new'' masterpiece sits on a spacious corner lot. This rare find features 4 BR/3.5 BA with a split floor plan, including two Primary Suites (one up/one down). The interior boasts an oversized family room, new stainless appliances, walk-in closets, and massive storage. The main primary bath is a true retreat with his/her sinks, a walk-in shower, and a large jacuzzi tub. Step outside to your private, fenced oasis featuring a large covered patio with an outdoor kitchen--perfect for entertaining! Includes a 2-car garage and additional RV parking. Complete interior/exterior renovation. This one won't last!
Key facts
- Massive storage
- Full remodel
- Walk in closets
Tags
Property features AI
Exterior
- Parking: 2-car garage; Garage faces front; RV access/parking; Concrete parking surfaces
- Utilities: Public water; Public sewer; Electricity connected; Propane available; Sewer connected; Water connected
- Home design: Single-family house; Updated/remodeled; One and one-half stories; Built with HardiPlank-type siding; Slab foundation
- Construction: Architectural shingle roof; HardiPlank-type exterior
- Exterior features: Outdoor kitchen; Private yard; Privacy fencing in back yard; Corner lot; Fenced
Interior
- Kitchen: Dishwasher; Microwave; Refrigerator; Stainless steel appliances; Granite counters
- Bedrooms: Primary bedroom located downstairs
- Flooring: Luxury vinyl; Carpet; Ceramic tile
- Bathrooms: 3 full bathrooms; 1 half bathroom (total 4 bathrooms)
- Heating & cooling: Central electric heating; Central electric air conditioning
- Interior features: Ceiling fans; Primary bedroom on main level; Storage; Granite counters
- Laundry & utility: Laundry inside the home; Laundry closet
Neighborhood map
What this means for you Summary
Snapshot
- This is a 4-bed/2.0-bath single-family listed at $340k.
Deal economics
- At list price, monthly cash flow is $78 ($931/yr) — positive.
- The deal already cash-flows at list — no discount required.
- To meet the 1% rule (rent ≥ 1% of price), the offer needs to be $262k (22.9% below list).
- Recommended offer: $262k (22.9% below list) — sets the bar for 1% rule.
- Cap rate 6.6% vs local median 4.2% in Ocean Springs — top-decile yield for the area; either an underpriced asset or a hidden risk that comps aren't pricing in. Stress-test before assuming the spread holds.
Location & tenants
- Location reads 86/100 on livability (#2 in MS, #420 nationally) — a professional / high-income tenant draw. Strengths: crime A+, amenities A+, cost of living A+; Watch: commute F.
- Ocean Springs School District (suburban): math 64% / reading 59% proficiency, ranked #1 of 130 in MS (top 1%) — acceptable for families but not a draw, mixed tenant base, ~2y average lease.
- Zoned schools: Pecan Park Elementary School (math 62% / reading 57%, grade B-, #27 of 375 statewide, top 8%, 530 students, 99% FRL); Ocean Springs Upper Elementary Scho (math 59% / reading 56%, grade B, #12 of 179 statewide, top 6%, 1,332 students, 100% FRL); Ocean Springs High School (math 77% / reading 64%, grade B+, #1 of 197 statewide, top 0%, 1,899 students, 100% FRL) — zoned schools average 100% FRL vs 33% district-wide (67 pts higher); higher-poverty schools than district average — tighter screening recommended.
- Market conditions: Rents rising (+1.3%/yr); 723 active listings in the ZIP; 2 comparable units currently listed for rent nearby; solid renter incomes; 516 units permitted in Jackson County in 2024 (6 in 5+ unit buildings).
- This rent runs 40% of the median local income ($79k/yr) — at the standard rent-burdened threshold; future hikes will face affordability resistance.
Forward outlook
- Local home prices are declining (-3.0%/yr); year-one equity from $2k of loan paydown is wiped out by about $10k of value loss. Plan a longer hold.
Negotiation context
- Only 12 days on market — expect competitive offers; lowballing is unlikely to land.
Risks & watch-outs
- Climate carrying-cost: severe wind risk, 99% chance of damaging wind over 30y; extreme-heat days projected 7→23/yr by 2055 (HVAC capex compounding) — expect insurance premiums to compound above CPI over the hold.
Questions for the listing agent
- Built in 1964 — when were the roof, HVAC, electrical panel, plumbing, and water heater last replaced?
- Is there a deadline driving the sale (1031 exchange, divorce, estate, relocation)? That informs how much negotiation room exists.
- Schools are B-rated — typically a magnet for longer-tenancy family renters. What's the average tenant stay here, and is there a school-zone premium baked into asking?
- What's the average days-on-market for RENTAL listings here right now (not sales)? A rising rental-DOM trend means longer vacancies and softer asking-rent achievability than the comps imply.
- What's the recent tenant-quality profile in this submarket — average credit score on applications, eviction rate, late-payment / NSF rate, and stable-employment percentage? A property-management company in the area should have these aggregated.
- How much new for-sale + rental construction is in the pipeline within 1–3 miles? Heavy new supply typically softens prices + rents 12–24 months out; constrained supply supports both.
Investment metrics
- 1% rule
- 0.77% ✗
- Cap rate
- 6.57%
- Cash-on-cash
- 0.98%
- DSCR
- 1.04
- GRM
- 10.8
CMA / ARV
- ARV (on-the-fly)
- $413,168
- Comps found
- 7
Show comp detail 7 sales within ~0.75 mi
| Address | Dist | Beds/Ba | Sqft | Sold | Price | $/sf | Match |
|---|---|---|---|---|---|---|---|
| 3010 Trentwood Dr | 0.18mi | 5/2.5 (+1) | 3,109 (+2%) | 8mo | $409,900 | $132 | 74 |
| 4701 Hilltop Dr | 0.00mi | 4/3.5 | 2,600 (-14%) | 1mo | $339,900 | $131 | 69 |
| 3009 Trentwood Dr | 0.14mi | 5/3.5 (+1) | 3,013 (-1%) | 17mo | $410,000 | $136 | 67 |
| 55 Lakeview Dr | 0.60mi | 4/2.5 | 3,259 (+7%) | 4mo | $399,999 | $123 | 55 |
| 205 Madison Place Dr | 0.41mi | 3/2.5 (-1) | 2,631 (-13%) | 9mo | $410,000 | $156 | 44 |
| 3825 Bergerac Ln | 0.75mi | 4/3.5 | 2,842 (-6%) | 10mo | $509,000 | $179 | 40 |
| 10 N Lakeview Dr | 0.53mi | 4/2.5 | 2,620 (-14%) | 13mo | $359,000 | $137 | 39 |
Match score weights: distance 35% · size 25% · config 20% · recency 20%. Top-matched comps best support the ARV.
Projected returns pro-forma
-3.0% appreciation · 1.31% rent growth · sell at horizon
- IRR
- -16.4%
- Equity multiple
- 0.43×
- Total profit
- $-54,702
- Equity at exit
- $50,680
- IRR
- -11.1%
- Equity multiple
- 0.38×
- Total profit
- $-59,389
- Equity at exit
- $29,388
Cash invested: $95,172 (down + closing). Projections, not guarantees.
Landlord ↔ Tenant lean methodology
- Overall (STATE)
- 90 Strongly Landlord-Friendly
- State Mississippi
- 90 Strongly Landlord-Friendly · R+11
- County
- — inherits STATE
- City
- — inherits STATE
ZIP-level market 39564
- Home prices YoY
- -26.8%
- Rents YoY
- 1.3%
- Active inventory
- 723
- Price-to-rent
- 10.8×
Monthly cashflow live
- Estimated rent
- $2,621 medium interval (Pro) →
- Mortgage (P&I)
- −$1,782
- Tax from tax record
- −$69 /mo · $829/yr
- Insurance
- −$142
- HOA
- −$0
- Vacancy / Maint / Mgmt
- −$550
- Net cashflow
- $78
Break-even live
Sensitivity live
| Price | -10% $270 | -5% $174 | +0% $78 | +5% $-19 | +10% $-115 |
|---|---|---|---|---|---|
| Rent | -10% $-130 | -5% $-26 | +0% $78 | +5% $181 | +10% $285 |
| Rate | -1.0pp $249 | -0.5pp $164 | base $78 | +0.5pp $-11 | +1.0pp $-100 |
UW: 25.0% down · 7.5% · 30yr · 1.5% tax · 5.0% vac · 8.0% maint · 8.0% mgmt
Financing live
Cash to close
- Down payment
- $84,975
- Closing costs
- $10,197
- Reserves months
- —
- Total cash needed
- —
Loan-product check · same deal, 3 products live
Conventional
25% down · 7.5% · 30yr
- Down + closing
- —
- Monthly P&I
- —
- Monthly cashflow
- —
- DSCR
- —
- Eligible?
- —
Personal DTI + credit; lowest rate.
DSCR
20% down · 8.5% · 30yr
- Down + closing
- —
- Monthly P&I
- —
- Monthly cashflow
- —
- DSCR
- —
- Eligible?
- —
No personal income docs; deal must DSCR.
Hard money
10% down · 12.0% · 12mo
- Down + closing
- —
- Monthly P&I
- —
- Monthly cashflow
- —
- DSCR
- —
- Eligible?
- —
Short-term bridge; refi at stabilization.
Rent comps 2 comps
| Address | Beds | Baths | Sqft | Rent | $/sqft | DOM | Units | Dist |
|---|---|---|---|---|---|---|---|---|
| 44 Whisperwood Ln Ocean Springs, MS | 5.0 | 3.0 | 2594 | $2,750 | $1.06 | 15d | 1 | 0.66mi |
| 106 Booth Cir Ocean Springs, MS | 4.0 | 2.0 | 2100 | $2,500 | $1.19 | 15d | 1 | 1.27mi |
Listing history 3 events
-
2026-04-21status Pending
-
2026-04-09$339,900 Active
-
2025-05-16soldstatus
ⓘ Source: listings_history table (triggers on properties + properties_extension) + one-shot
backfill from property_details.listing_events for pre-trigger history.
Tax reassessment forecast MS · Resets to sale price
- Current annual tax
- $829 · $69/mo
- Projected year-2 tax
- $2,685 · $224/mo
- Expected delta
- +$1,856/yr (+$155/mo · 223.7%)
ⓘ Screening estimate from a state-policy table — verify with the county assessor before closing.
Climate risk First Street
- Flood 4/10 Moderate FEMA zone X (shaded) · 13% chance over 30 yrs
- Wildfire 3/10 Moderate
- Heat 10/10 Extreme 7 d/yr ≥107°F today · 23 d/yr by 30 yrs out
- Wind 9/10 Extreme 99% chance of damaging wind over 30 yrs
- Air quality 2/10 Low 1 unhealthy d/yr today · 2 by 30 yrs out
Nearby sold comps map
Loading sold comps map…
Walkable amenities ~0.75 mi
Loading nearby amenities…
Taxation est. · year 1
- Rental income
- $31,455
- − Mortgage interest
- −$19,040
- − Property taxes
- −$829
- − Insurance
- −$1,700
- − Repairs & maintenance
- −$2,516
- − Management
- −$2,516
- − Depreciation
- −$9,888
- Taxable loss
- −$5,035
- Est. tax savings @ 24.0%
- +$1,208
- After-tax cash flow
- $2,139/yr
For passive investors: Depreciation is non-cash, so a rental often shows a tax loss while cash-flowing — sheltering income. Rental losses are passive: they offset passive income freely, and up to $25,000/yr can offset ordinary (W-2) income if you actively participate and your MAGI is under $100k (phasing out to $0 by $150k); unused losses carry forward. On sale, claimed depreciation is recaptured at up to 25%, and gains may owe capital-gains tax (a 1031 exchange can defer both). Figures are a year-1 estimate at your 24.0% rate — not tax advice; consult a CPA.
Schools (NCES district)
- District
- Ocean Springs School District
- NCES district ID
- 2803360
- Math proficiency
- 64% ▼ -3.00%
- Reading proficiency
- 59% ▲ 1.00%
- Median HH income
- $60,485
- Composite
- 53.35/100
- National rank
- #1477
- State rank
- #1 of 130 in MS
Livability — Ocean Springs
- Score
- 86/100
- State rank
- #2
- US rank
- #420
Category grades
Schools grade is shown separately in the Schools card above.
Census & demographics
- Census place
- Ocean Springs, MS
- County
- Jackson County · 82,196 people
- City population
- 43,240
- Metro
- Gulfport-Biloxi, MS
- Population (ZIP)
- 43,240
- Household income
- $78,596
- Rent vs Own
- Severe rent burden
- 734.0
Population outlook (Jackson County) Hauer SSP2
- Today (2025)
- 146,926 people
- By 2030
- 148,442 · +1.0%
- By 2040
- 149,631 · +1.8%
- By 2050
- 148,723 · +1.2%
- By 2075
- 147,845 · +0.6%
- By 2100
- 144,510 · -1.6%
Race, ethnicity, and origin ACS 2023
- Neighborhood character
- Predominantly White (74%)
- Race & ethnicity
- White 74% Black 10% Hispanic / Latino 8% Two or more races 7% Asian 4%
- Hispanic origin (detail)
- Mexican 3% Puerto Rican 2%
- Common ancestry
- Lithuanian 5% Slovak 4% Romanian 2%
- Foreign-born
- 5% · Canada, South Korea, Vietnam
- Languages at home
- 93% English-only · Spanish 3% Vietnamese 2% Tagalog/Filipino 1%
Political lean MEDSL · Jackson
- 2024 margin
- Solid R (+39.9) · D 29.5% · R 69.4% · Other 1.1%
- 2008→2024 swing
- -6.4pp toward R · 2008: -33.5pp · 2024: -39.9pp
- All cycles
- 2024: R+39.9 2020: R+34.6 2016: R+39.9 2012: R+36.1 2008: R+33.5
Not yet ingested
- Civics
- —
Market trends
- HPI YoY
- ▼ -74.77%
- Current HPI
- 204.2244
- Rent YoY
- ▲ 1.31%
- Metro
- Gulfport-Biloxi, MS
- State GDP YoY
- —
- F500 in state
- 0
Price history
3 events — show timeline
- 2026-04-21 Pending — MLSU
- 2026-04-09 Listed $339,900 MLSU
- 2025-05-16 Sold (Public Records) — Public Records
Property tax history
-8.8%/yrLatest (2025): $829 · +12.4% YoY. Source: county tax records.
Cash-flow waterfall
monthlySold comps — $/sqft
last 12 mo · ≤1 miLoading sold comps…