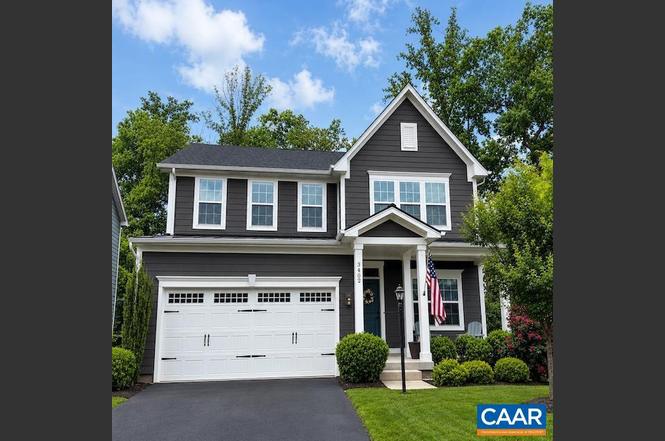
3402 Steamer Dr · Rivanna, VA
Flood risk 1/10 · Minimal
- FEMA flood zone
- X (unshaded)
- Chance of flooding over 30 yrs
- 0.0%
- Est. flood insurance / yr
- $473 – $860
Fire risk 3/10 · Minor
- Est. fire insurance / yr
- $666 – $1,236
Heat risk 6/10 · Moderate
- Hot days now (above 104°F)
- 7 days/yr
- Hot days in 30 yrs
- 17 days/yr
Wind risk 2/10 · Minimal
- Chance of severe wind over 30 yrs
- 3.0%
Air-quality risk 1/10 · Minimal
- Unhealthy air days now
- 0 days/yr
- Unhealthy air days in 30 yrs
- 0 days/yr
Risk factors via First Street. Map © Google.
Why this score? — see what drove the F grade
The composite is a weighted blend of 9 inputs, each scored 0–100. Each bar is that input's sub-score; the figure is the points it added to the 100-point composite (weight × sub-score).
- ARV discount +15.0/15.0
- Schools +6.2/10.0
- Livability +3.2/5.0
- Rent growth +2.5/5.0
- Condition / age +2.5/5.0
- Cash flow +2.0/30.0
- 1% rule +0.0/10.0
- DSCR +0.0/10.0
- Appreciation +0.0/10.0
$742,000
🖨 Deal sheet 📄 Offer letter ✓ Due diligence
Listing remarks MLS
Immediate Move-In! Come tour this FINAL opportunity for our most popular floorplan! This 4 BR, 3.5 BA home boasts a finished WALKOUT bsmt, 2 car garage, front porch & covered deck. Gourmet kitchen w/ spacious island, white cabinetry, granite, SS appliances, gas fireplace, home office, oversized owners suite w/ private bath & WI closet. Rivanna Village offers new single-family homes in Charlottesville with a community park, pavilion and trails, close to Downtown, UVA & 5th Street Station. Every new home in Rivanna Village is tested, inspected & HERS® scored by a 3rd party energy consultant & a 3rd party inspector. Receive $5,000 toward closing costs on our FINAL opportunity! *
Key facts
- Covered deck
- Quiet cul-de-sac
- Completed dog park
Tags
Property features AI
Finance
- Other: Above-grade finished living area and below-grade finished/unfinished areas recorded in public records
- HOA & community: Homeowners association with a quarterly fee of $220; Association maintains playground, road maintenance and snow removal; Community amenities include picnic area, playground and sidewalks
Exterior
- Parking: Attached garage; Two-car garage; Garage faces front; Garage door opener
- Security: Smoke detectors; Carbon monoxide detectors
- Utilities: Public water; Public sewer; Cable available; High-speed internet available
- Home design: Detached single-family home; Three or more levels; Exterior entry basement with walk-out access
- Construction: HardiPlank siding; Stick-built construction; Poured foundation; Architectural roof
- Exterior features: Front porch; Screened porch; Porch; Property on a landscaped cul-de-sac lot
Interior
- Kitchen: Dishwasher; Garbage disposal; Gas range; Microwave; Refrigerator; Kitchen island; Breakfast bar; Eat-in kitchen
- Bedrooms: Primary bedroom on second level; Additional bedroom on second level
- Flooring: Carpet; Ceramic tile; Luxury vinyl plank
- Bathrooms: Three full bathrooms; One half bathroom; Primary bathroom on second level; Bathrooms located on first, second and basement levels
- Heating & cooling: Central heating (propane); Central air; Heat pump
- Interior features: Double vanity; Walk-in closets; Breakfast bar; Entrance foyer; Eat-in kitchen; Home office; Kitchen island; Mud room; Recessed lighting; Insulated windows with low-emissivity glass and screens; Gas fireplace
- Laundry & utility: Washer; Dryer
Neighborhood map
What this means for you Summary
Snapshot
- This is a 4-bed/3.5-bath single-family listed at $742k.
Deal economics
- At list price, monthly cash flow is $-3k ($-33k/yr) — negative.
- To cash-flow at today's rent, offer at most $256k (65.5% below list).
- To meet the 1% rule (rent ≥ 1% of price), the offer needs to be $256k (65.5% below list).
- Recommended offer: $256k (65.5% below list) — sets the bar for 1% rule.
- Cap rate 1.8% vs local median 2.4% in Rivanna — below-typical yield; the buyer is paying a premium for something (appreciation thesis, condition, location) that the cap rate doesn't capture.
Location & tenants
- Location reads 64/100 on livability (#343 in VA) — a middle-class / working-renter tenant base. Strengths: crime A+, employment A+; Watch: amenities F, commute F, cost of living F.
- Albemarle County Public School District (rural): math 66% / reading 77% proficiency, ranked #14 of 131 in VA (top 11%) — strong family-tenant draw, lease renewals of 3-5y typical.
- Zoned schools: Stone Robinson Elementary (math 67% / reading 77%, grade A-, #273 of 1,108 statewide, top 27%, 473 students, 31% FRL); Jackson P. Burley Middle (math 59% / reading 71%, grade A-, #120 of 342 statewide, top 35%, 586 students, 45% FRL); Monticello High (math 49% / reading 81%, grade B, #210 of 319 statewide, top 66%, 1,229 students, 56% FRL) — zoned schools average 44% FRL vs 23% district-wide (21 pts higher); higher-poverty schools than district average — tighter screening recommended.
- Market conditions: 139 active listings in the ZIP; 810 units permitted in Albemarle County in 2024 (188 in 5+ unit buildings).
Forward outlook
- Local home prices are declining (-3.0%/yr); year-one equity from $5k of loan paydown is wiped out by about $22k of value loss. Plan a longer hold.
- Albemarle County population projected at +24% by 2050 — long-run rental-demand tailwind backs the buy-and-hold thesis.
Negotiation context
- Only 8 days on market — expect competitive offers; lowballing is unlikely to land.
- 4 sale attempts since 6y ago; this cycle's ask is 21100% above the opening price — seller raised mid-cycle; expect resistance to lowballs.
- Current owner paid $486k; list at $742k implies a 53% gain — meaningful room to come down on a strong offer.
Risks & watch-outs
- Climate carrying-cost: extreme-heat days projected 7→17/yr by 2055 (HVAC capex compounding) — expect insurance premiums to compound above CPI over the hold.
Questions for the listing agent
- What do current leases actually rent for vs. the listed asking? Can we see a recent rent roll and the last 12 months of T-12 income?
- What does the HOA fee cover, when was the last increase, and are there any pending special assessments or reserve-fund shortfalls?
- Is there a deadline driving the sale (1031 exchange, divorce, estate, relocation)? That informs how much negotiation room exists.
- The area grade is low — what's the realistic commute time and amenity access for the typical tenant pool here? Any planned neighborhood developments (good or bad) we should know about?
- What's the average days-on-market for RENTAL listings here right now (not sales)? A rising rental-DOM trend means longer vacancies and softer asking-rent achievability than the comps imply.
- What's the recent tenant-quality profile in this submarket — average credit score on applications, eviction rate, late-payment / NSF rate, and stable-employment percentage? A property-management company in the area should have these aggregated.
- How much new for-sale + rental construction is in the pipeline within 1–3 miles? Heavy new supply typically softens prices + rents 12–24 months out; constrained supply supports both.
Investment metrics
- 1% rule
- 0.35% ✗
- Cap rate
- 1.85%
- Cash-on-cash
- -15.88%
- DSCR
- 0.29
- GRM
- 24.2
CMA / ARV
- ARV (on-the-fly)
- $925,395
- Comps found
- 11
Show comp detail 11 sales within ~0.75 mi
| Address | Dist | Beds/Ba | Sqft | Sold | Price | $/sf | Match |
|---|---|---|---|---|---|---|---|
| 3461 Steamer Dr | 0.11mi | 4/3.5 | 3,195 (-2%) | 23mo | $685,000 | $214 | 74 |
| 3419 Steamer Dr | 0.04mi | 5/3.5 (+1) | 3,174 (-2%) | 20mo | $702,500 | $221 | 73 |
| 1425 Sunderland Ln | 0.44mi | 3/3.5 (-1) | 3,369 (+4%) | 13mo | $959,000 | $285 | 58 |
| 1025 Shadwell Rd | 0.61mi | 4/3.5 | 3,111 (-4%) | 12mo | $761,500 | $245 | 55 |
| 2426 Pendower Ln | 0.64mi | 4/3.5 | 3,543 (+9%) | 2mo | $1,250,000 | $353 | 54 |
| 3351 Darby Rd | 0.54mi | 4/3.5 | 2,881 (-11%) | 8mo | $850,000 | $295 | 49 |
| 2706 Lockerbie Ln | 0.64mi | 3/3.5 (-1) | 3,636 (+12%) | 1mo | $1,050,000 | $289 | 45 |
| 2477 Ferndown Ln | 0.54mi | 3/3.5 (-1) | 2,942 (-9%) | 12mo | $1,050,000 | $357 | 44 |
| 1332 Piper Way | 0.73mi | 3/2.5 (-1) | 3,438 (+6%) | 11mo | $900,000 | $262 | 38 |
| 3590 Glasgow Ln | 0.73mi | 4/3.5 | 3,655 (+13%) | 9mo | $1,050,000 | $287 | 37 |
| 3579 Glasgow Ln | 0.72mi | 4/4.5 | 3,647 (+12%) | 15mo | $1,019,000 | $279 | 30 |
Match score weights: distance 35% · size 25% · config 20% · recency 20%. Top-matched comps best support the ARV.
Projected returns pro-forma
-3.0% appreciation · 3.0% rent growth · sell at horizon
- IRR
- -47.3%
- Equity multiple
- -0.42×
- Total profit
- $-295,534
- Equity at exit
- $110,635
- IRR
- -90.3%
- Equity multiple
- -1.33×
- Total profit
- $-483,569
- Equity at exit
- $64,155
Cash invested: $207,760 (down + closing). Projections, not guarantees.
Landlord ↔ Tenant lean methodology
- Overall (STATE)
- 55 Moderately Landlord-Leaning
- State Virginia
- 55 Moderately Landlord-Leaning · D+2
- County
- — inherits STATE
- City
- — inherits STATE
ZIP-level market 22947
- Home prices YoY
- -5.8%
- Active inventory
- 139
- Price-to-rent
- 24.2×
Monthly cashflow live
- Estimated rent
- $2,560 medium interval (Pro) →
- Mortgage (P&I)
- −$3,891
- Tax from tax record
- −$499 /mo · $5,985/yr
- Insurance
- −$309
- HOA
- −$73
- Vacancy / Maint / Mgmt
- −$538
- Net cashflow
- $-2,750
Break-even live
UW: 25.0% down · 7.5% · 30yr · 1.5% tax · 5.0% vac · 8.0% maint · 8.0% mgmt
Financing live
Cash to close
- Down payment
- $185,500
- Closing costs
- $22,260
- Reserves months
- —
- Total cash needed
- —
Loan-product check · same deal, 3 products live
Conventional
25% down · 7.5% · 30yr
- Down + closing
- —
- Monthly P&I
- —
- Monthly cashflow
- —
- DSCR
- —
- Eligible?
- —
Personal DTI + credit; lowest rate.
DSCR
20% down · 8.5% · 30yr
- Down + closing
- —
- Monthly P&I
- —
- Monthly cashflow
- —
- DSCR
- —
- Eligible?
- —
No personal income docs; deal must DSCR.
Hard money
10% down · 12.0% · 12mo
- Down + closing
- —
- Monthly P&I
- —
- Monthly cashflow
- —
- DSCR
- —
- Eligible?
- —
Short-term bridge; refi at stabilization.
HOA detail
- Monthly dues
- $73 · $876/yr
- Likely covers
- gas
Listing history 8 events
-
2026-06-19days on market $742,000 Coming Soon 8 DOM
-
2026-06-18days on market $742,000 Coming Soon 7 DOM
-
2026-06-17days on market $742,000 Coming Soon 6 DOM
-
2026-06-16days on market $742,000 Coming Soon 5 DOM
-
2026-06-15days on market $742,000 Coming Soon 4 DOM
-
2026-06-14days on market $742,000 Coming Soon 2 DOM
-
2026-06-13remarks 699-char remark
-
2026-06-13$742,000 Coming Soon 1 DOM
ⓘ Source: listings_history table (triggers on properties + properties_extension) + one-shot
backfill from property_details.listing_events for pre-trigger history.
Tax reassessment forecast VA · Resets to sale price
- Current annual tax
- $5,985 · $499/mo
- Projected year-2 tax
- $6,084 · $507/mo
- Expected delta
- +$99/yr (+$8/mo · 1.7%)
ⓘ Screening estimate from a state-policy table — verify with the county assessor before closing.
Climate risk First Street
- Flood 1/10 Low FEMA zone X (unshaded) · 0% chance over 30 yrs
- Wildfire 3/10 Moderate
- Heat 6/10 Major 7 d/yr ≥104°F today · 17 d/yr by 30 yrs out
- Wind 2/10 Low 3% chance of damaging wind over 30 yrs
- Air quality 1/10 Low 0 unhealthy d/yr today · 0 by 30 yrs out
Nearby sold comps map
Loading sold comps map…
Walkable amenities ~0.75 mi
Loading nearby amenities…
Taxation est. · year 1
- Rental income
- $30,722
- − Mortgage interest
- −$41,564
- − Property taxes
- −$5,985
- − Insurance
- −$3,710
- − Repairs & maintenance
- −$2,458
- − Management
- −$2,458
- − HOA
- −$876
- − Depreciation
- −$21,585
- Taxable loss
- −$47,914
- Est. tax savings @ 24.0%
- +$11,499
- After-tax cash flow
- $-21,495/yr
For passive investors: Depreciation is non-cash, so a rental often shows a tax loss while cash-flowing — sheltering income. Rental losses are passive: they offset passive income freely, and up to $25,000/yr can offset ordinary (W-2) income if you actively participate and your MAGI is under $100k (phasing out to $0 by $150k); unused losses carry forward. On sale, claimed depreciation is recaptured at up to 25%, and gains may owe capital-gains tax (a 1031 exchange can defer both). Figures are a year-1 estimate at your 24.0% rate — not tax advice; consult a CPA.
Schools (NCES district)
- District
- Albemarle County Public School District
- NCES district ID
- 5100090
- Math proficiency
- 66% ▼ -16.00%
- Reading proficiency
- 77% ▼ -2.00%
- Median HH income
- $67,851
- Composite
- 62.28/100
- National rank
- #698
- State rank
- #14 of 131 in VA
Livability — Rivanna
- Score
- 64/100
- State rank
- #343
- US rank
- #13658
Category grades
Schools grade is shown separately in the Schools card above.
Census & demographics
- Census place
- Rivanna, VA
- Population (ZIP)
- 5,201
Population outlook (Albemarle County) Hauer SSP2
- Today (2025)
- 119,403 people
- By 2030
- 125,829 · +5.4%
- By 2040
- 137,705 · +15.3%
- By 2050
- 148,058 · +24.0%
- By 2075
- 172,223 · +44.2%
- By 2100
- 185,628 · +55.5%
Race, ethnicity, and origin ACS 2023
- Neighborhood character
- Predominantly White (81%)
- Race & ethnicity
- White 81% Black 13% Two or more races 5% Hispanic / Latino 1%
- Common ancestry
- Slovak 5% Serbian 3% Romanian 2%
- Foreign-born
- 4% · Canada, South Korea
- Languages at home
- 94% English-only · Spanish 4% German/W. Germanic 1% Other Indo-European 1%
Political lean MEDSL · Albemarle
- 2024 margin
- Solid D (+34.1) · D 66.3% · R 32.2% · Other 1.4%
- 2008→2024 swing
- +16.1pp toward D · 2008: 18.0pp · 2024: 34.1pp
- All cycles
- 2024: D+34.1 2020: D+33.5 2016: D+25.1 2012: D+12.0 2008: D+18.0
Not yet ingested
- Civics
- —
Market trends
- HPI YoY
- ▼ -14.71%
- Current HPI
- 240.3797
- Rent YoY
- —
- Metro
- —
- State GDP YoY
- ▲ 2.40%
- F500 in state
- 50
Industry mix (Fortune 500 HQ in VA)
| Industry | F500 HQs | Revenue |
|---|---|---|
| Aerospace / Defense | 4 | $236B |
|
||
| Technology / Defense | 3 | $32B |
|
||
| Financial Services | 2 | $176B |
|
||
| Utilities | 2 | $27B |
|
||
| Insurance | 2 | $25B |
|
||
| Technology | 2 | $15B |
|
||
Price history
+47.9% since first listed10 events — show timeline
- 2026-06-11 Coming Soon $742,000 CAAR
- 2025-05-17 Rental Removed $3,500 CAAR
- 2025-05-06 Listed for Rent $3,500 CAAR
- 2025-04-16 Rental Removed $3,500 CAAR
- 2025-04-11 Price Changed $3,500 CAAR
- 2025-04-11 Listed for Rent $3,400 CAAR
- 2020-11-18 Sold (MLS) $485,500 CAAR
- 2020-09-01 Listing Removed — CAAR
- 2020-05-09 Listed $485,000 CAAR
- 2020-03-11 Listed $501,640 CAAR
Property tax history
+9.8%/yrLatest (2025): $5,985 · +7.2% YoY. Source: county tax records.
Cash-flow waterfall
monthlySold comps — $/sqft
last 12 mo · ≤1 miLoading sold comps…