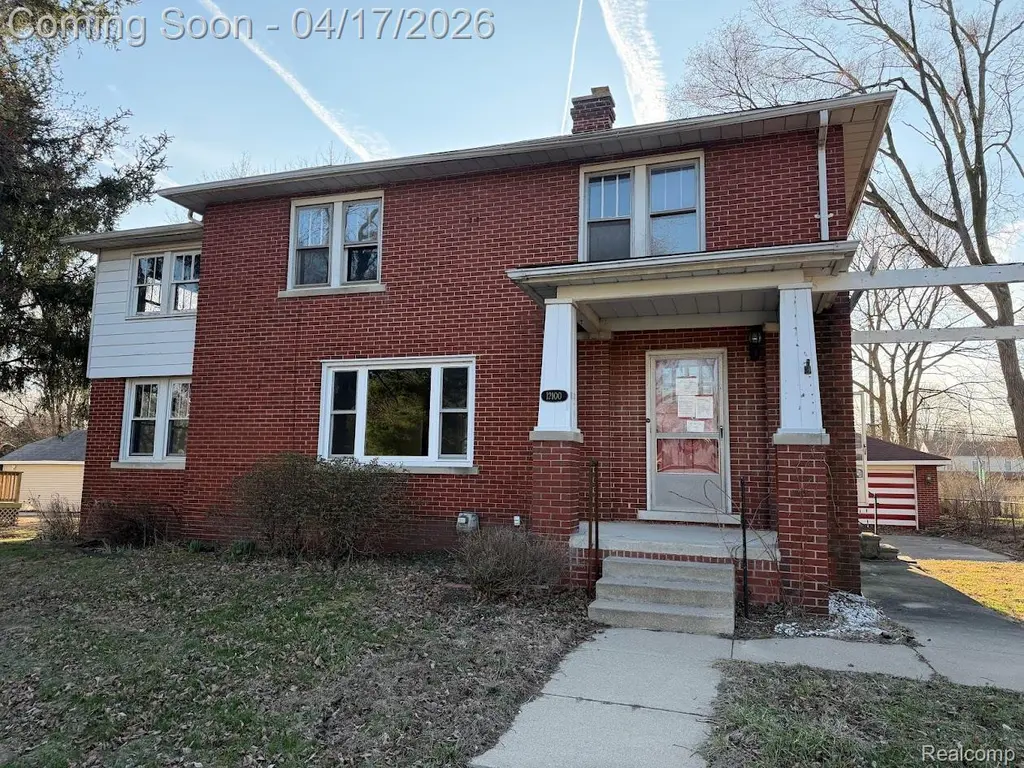
12100 Elmview St · Romulus, MI
Flood risk 1/10 · Minimal
- FEMA flood zone
- X (unshaded)
- Chance of flooding over 30 yrs
- 0.0%
- Est. flood insurance / yr
- $473 – $860
Fire risk 3/10 · Minor
- Est. fire insurance / yr
- $784 – $1,456
Heat risk 3/10 · Minor
- Hot days now (above 97°F)
- 7 days/yr
- Hot days in 30 yrs
- 15 days/yr
Wind risk 2/10 · Minimal
- Chance of severe wind over 30 yrs
- —
Air-quality risk 2/10 · Minimal
- Unhealthy air days now
- 1 days/yr
- Unhealthy air days in 30 yrs
- 2 days/yr
Risk factors via First Street. Map © Google.
Why this score? — see what drove the D grade
The composite is a weighted blend of 9 inputs, each scored 0–100. Each bar is that input's sub-score; the figure is the points it added to the 100-point composite (weight × sub-score).
- ARV discount +15.0/15.0
- Cash flow +11.0/30.0
- 1% rule +4.2/10.0
- DSCR +3.2/10.0
- Livability +3.0/5.0
- Rent growth +2.5/5.0
- Condition / age +2.5/5.0
- Schools +1.3/10.0
- Appreciation +0.0/10.0
$179,900
🖨 Deal sheet 📄 Offer letter ✓ Due diligence
Listing remarks MLS
Calling all first-time home buyers, investors, and DIY enthusiasts - this is the opportunity you've been waiting for! Welcome to this charming all-brick 3-bedroom Colonial situated on a spacious quarter-acre lot. This home offers solid bones and timeless character, providing the perfect canvas to bring your vision to life. With ample space to accommodate a growing or multi-sized family, the possibilities here are endless. Conveniently located near parks, schools, shopping centers, and major freeways, this property combines potential with prime location. Don't miss your chance to turn this house into your dream home or next great investment - schedule your showing today!
Key facts
- 0.23 acre lot
- 2 garage spots
- Built 1925
Neighborhood map
What this means for you Summary
Snapshot
- This is a 3-bed/1.0-bath single-family listed at $180k.
Deal economics
- At list price, monthly cash flow is $-75 ($-900/yr) — negative.
- To cash-flow at today's rent, offer at most $167k (7.4% below list).
- To meet the 1% rule (rent ≥ 1% of price), the offer needs to be $166k (7.9% below list).
- Recommended offer: $166k (7.9% below list) — sets the bar for 1% rule.
- Cap rate 5.8% vs local median 4.2% in Romulus — top-decile yield for the area; either an underpriced asset or a hidden risk that comps aren't pricing in. Stress-test before assuming the spread holds.
Location & tenants
- Location reads 60/100 on livability (#593 in MI) — a middle-class / working-renter tenant base. Strengths: cost of living A+, housing A+; Watch: commute D+, schools F, crime F.
- Romulus Community Schools (suburban): math 9% / reading 21% proficiency, ranked #498 of 540 in MI (top 92%) — low school quality limits family demand, transient renter base, plan for 1-2y turnover; 69% free/reduced lunch — lower-income household profile, screen leases tightly.
- Market conditions: 215 active listings in the ZIP; 2,639 units permitted in Wayne County in 2024 (1,216 in 5+ unit buildings).
Forward outlook
- Local home prices are declining (-3.0%/yr); year-one equity from $1k of loan paydown is wiped out by about $5k of value loss. Plan a longer hold.
- Wayne County population projected at -17% by 2050 — secular population decline; favor cash flow + early exit over multi-decade hold.
Negotiation context
- It's been on market 35 days — a 3% lower offer ($175k) is reasonable based on typical stale-listing flexibility.
- 12 sale attempts since 23y ago with the ask held roughly flat each time — persistent listings suggest the price (not the market) is what's stuck; bring a comps-based counter.
- Current owner paid $150k; 20% above their basis — modest negotiation headroom, anchor on the comps not their cost.
Risks & watch-outs
- Watch-outs: built in 1925 — expect roof / HVAC / electrical / plumbing capex.
Questions for the listing agent
- What do current leases actually rent for vs. the listed asking? Can we see a recent rent roll and the last 12 months of T-12 income?
- It's been on market 35 days. Have you received any prior offers? Is the seller open to a 8% concession, seller financing, or rate buy-down credit?
- Built in 1925 — when were the roof, HVAC, electrical panel, plumbing, and water heater last replaced?
- Is there a deadline driving the sale (1031 exchange, divorce, estate, relocation)? That informs how much negotiation room exists.
- Schools are F-rated, which usually means shorter tenancies and higher turnover. Who's the typical renter profile here, and what's been the actual vacancy rate?
- Crime grade is F in this area — have there been break-ins, vandalism, or insurance claims at this property in the last 3 years? What carrier currently insures it and at what premium?
- The area grade is low — what's the realistic commute time and amenity access for the typical tenant pool here? Any planned neighborhood developments (good or bad) we should know about?
- What's the average days-on-market for RENTAL listings here right now (not sales)? A rising rental-DOM trend means longer vacancies and softer asking-rent achievability than the comps imply.
- What's the recent tenant-quality profile in this submarket — average credit score on applications, eviction rate, late-payment / NSF rate, and stable-employment percentage? A property-management company in the area should have these aggregated.
- How much new for-sale + rental construction is in the pipeline within 1–3 miles? Heavy new supply typically softens prices + rents 12–24 months out; constrained supply supports both.
Investment metrics
- 1% rule
- 0.92% ✗
- Cap rate
- 5.79%
- Cash-on-cash
- -1.79%
- DSCR
- 0.92
- GRM
- 9.0
CMA / ARV
- ARV (median comp)
- $242,416
- List price
- $179,900
- Delta
- -25.79%
- Verdict
- UNDERPRICED
- Comps
- 20 within 1.0 mi
Show comp detail 4 sales within ~0.75 mi
| Address | Dist | Beds/Ba | Sqft | Sold | Price | $/sf | Match |
|---|---|---|---|---|---|---|---|
| 12082 Craig St | 0.06mi | 3/2.0 | 2,168 (+12%) | 11mo | $226,100 | $104 | 65 |
| 38047 Wabash St | 0.61mi | 3/2.5 | 1,788 (-8%) | 0mo | $319,000 | $178 | 52 |
| 11128 Olive St | 0.54mi | 4/1.5 (+1) | 1,740 (-10%) | 10mo | $239,999 | $138 | 41 |
| 37726 Westvale St | 0.75mi | 3/1.0 | 1,664 (-14%) | 10mo | $177,000 | $106 | 33 |
Match score weights: distance 35% · size 25% · config 20% · recency 20%. Top-matched comps best support the ARV.
Projected returns pro-forma
-3.0% appreciation · 3.0% rent growth · sell at horizon
- IRR
- -19.2%
- Equity multiple
- 0.33×
- Total profit
- $-33,817
- Equity at exit
- $26,824
- IRR
- -11.6%
- Equity multiple
- 0.30×
- Total profit
- $-35,145
- Equity at exit
- $15,554
Cash invested: $50,372 (down + closing). Projections, not guarantees.
Landlord ↔ Tenant lean methodology
- Overall (STATE)
- 62 Landlord-Friendly
- State Michigan
- 62 Landlord-Friendly · EVEN
- County
- — inherits STATE
- City
- — inherits STATE
ZIP-level market 48174
- Active inventory
- 215
- Price-to-rent
- 9.0×
Monthly cashflow live
- Estimated rent
- $1,658 medium interval (Pro) →
- Mortgage (P&I)
- −$943
- Tax from tax record
- −$366 /mo · $4,394/yr
- Insurance
- −$75
- HOA
- −$0
- Vacancy / Maint / Mgmt
- −$348
- Net cashflow
- $-75
Break-even live
UW: 25.0% down · 7.5% · 30yr · 1.5% tax · 5.0% vac · 8.0% maint · 8.0% mgmt
Financing live
Cash to close
- Down payment
- $44,975
- Closing costs
- $5,397
- Reserves months
- —
- Total cash needed
- —
Loan-product check · same deal, 3 products live
Conventional
25% down · 7.5% · 30yr
- Down + closing
- —
- Monthly P&I
- —
- Monthly cashflow
- —
- DSCR
- —
- Eligible?
- —
Personal DTI + credit; lowest rate.
DSCR
20% down · 8.5% · 30yr
- Down + closing
- —
- Monthly P&I
- —
- Monthly cashflow
- —
- DSCR
- —
- Eligible?
- —
No personal income docs; deal must DSCR.
Hard money
10% down · 12.0% · 12mo
- Down + closing
- —
- Monthly P&I
- —
- Monthly cashflow
- —
- DSCR
- —
- Eligible?
- —
Short-term bridge; refi at stabilization.
Listing history 44 events
-
2026-04-17$179,900 Active 678-char remark
Show marketing remark (698 chars)
Calling all first-time home buyers, investors, and DIY enthusiasts—this is the opportunity you’ve been waiting for! Welcome to this charming all-brick 3-bedroom Colonial situated on a spacious quarter-acre lot. This home offers solid bones and timeless character, providing the perfect canvas to bring your vision to life. With ample space to accommodate a growing or multi-sized family, the possibilities here are endless. Conveniently located near parks, schools, shopping centers, and major freeways, this property combines potential with prime location. Don’t miss your chance to turn this house into your dream home or next great investment—schedule your showing today!
-
2026-04-17$179,900 Active 698-char remark
Show marketing remark (698 chars)
Calling all first-time home buyers, investors, and DIY enthusiasts—this is the opportunity you’ve been waiting for! Welcome to this charming all-brick 3-bedroom Colonial situated on a spacious quarter-acre lot. This home offers solid bones and timeless character, providing the perfect canvas to bring your vision to life. With ample space to accommodate a growing or multi-sized family, the possibilities here are endless. Conveniently located near parks, schools, shopping centers, and major freeways, this property combines potential with prime location. Don’t miss your chance to turn this house into your dream home or next great investment—schedule your showing today!
-
2026-04-14historical $179,900 678-char remark
Show marketing remark (678 chars)
Calling all first-time home buyers, investors, and DIY enthusiasts - this is the opportunity you've been waiting for! Welcome to this charming all-brick 3-bedroom Colonial situated on a spacious quarter-acre lot. This home offers solid bones and timeless character, providing the perfect canvas to bring your vision to life. With ample space to accommodate a growing or multi-sized family, the possibilities here are endless. Conveniently located near parks, schools, shopping centers, and major freeways, this property combines potential with prime location. Don't miss your chance to turn this house into your dream home or next great investment - schedule your showing today!
-
2025-10-20soldstatus $150,000
-
2025-10-02soldstatus $150,000 Closed
-
2025-10-02soldstatus $150,000 Closed
-
2025-08-30status Pending
-
2025-08-30status Pending
-
2025-08-28price $156,600
-
2025-08-28price $156,600
-
2025-07-10$174,000 Active
-
2025-07-10$174,000 Active
-
2025-01-31historical
-
2025-01-31historical
-
2024-12-23price $188,900
-
2024-12-22price $188,900
-
2024-11-07price $194,900
-
2024-11-07price $194,900
-
2024-09-30$209,900 Active
-
2024-09-30$209,900 Active
-
2018-04-16soldstatus $138,000
-
2018-03-30soldstatus $138,000 Sold
-
2018-03-30soldstatus $138,000 Closed
-
2018-02-05status Pending
-
2018-02-05status Pending
-
2018-01-05price $149,900
-
2018-01-04price $149,900
-
2017-12-05$159,900 Active
-
2017-12-05$159,900 Active
-
2017-11-23historical
-
2017-11-23historical
-
2017-09-15price $169,900
-
2017-09-14price $169,900
-
2017-08-31price $179,900
-
2017-08-30price $179,900
-
2017-07-18price $189,900
-
2017-07-17price $189,900
-
2017-06-22$199,900 Active
-
2017-06-22$199,900 Active
-
2004-09-07soldstatus $145,000
-
2004-07-14soldstatus $145,000
-
2004-01-07$150,000
-
2004-01-07historical
-
2003-07-01$150,000
ⓘ Source: listings_history table (triggers on properties + properties_extension) + one-shot
backfill from property_details.listing_events for pre-trigger history.
Tax reassessment forecast MI · Partial reset (capped growth)
- Current annual tax
- $4,394 · $366/mo
- Projected year-2 tax
- $4,394 · $366/mo
- Expected delta
- $0/yr ($0/mo · 0.0%)
ⓘ Screening estimate from a state-policy table — verify with the county assessor before closing.
Climate risk First Street
- Flood 1/10 Low FEMA zone X (unshaded) · 0% chance over 30 yrs
- Wildfire 3/10 Moderate
- Heat 3/10 Moderate 7 d/yr ≥97°F today · 15 d/yr by 30 yrs out
- Wind 2/10 Low
- Air quality 2/10 Low 1 unhealthy d/yr today · 2 by 30 yrs out
Nearby sold comps map
Loading sold comps map…
Walkable amenities ~0.75 mi
Loading nearby amenities…
Taxation est. · year 1
- Rental income
- $19,892
- − Mortgage interest
- −$10,077
- − Property taxes
- −$4,394
- − Insurance
- −$900
- − Repairs & maintenance
- −$1,591
- − Management
- −$1,591
- − Depreciation
- −$5,233
- Taxable loss
- −$3,895
- Est. tax savings @ 24.0%
- +$935
- After-tax cash flow
- $35/yr
For passive investors: Depreciation is non-cash, so a rental often shows a tax loss while cash-flowing — sheltering income. Rental losses are passive: they offset passive income freely, and up to $25,000/yr can offset ordinary (W-2) income if you actively participate and your MAGI is under $100k (phasing out to $0 by $150k); unused losses carry forward. On sale, claimed depreciation is recaptured at up to 25%, and gains may owe capital-gains tax (a 1031 exchange can defer both). Figures are a year-1 estimate at your 24.0% rate — not tax advice; consult a CPA.
Schools (NCES district)
- District
- Romulus Community Schools
- NCES district ID
- 2630120
- Math proficiency
- 9% ▼ -14.00%
- Reading proficiency
- 21% ▼ -9.00%
- Median HH income
- $44,165
- Composite
- 13.17/100
- National rank
- #9556
- State rank
- #498 of 540 in MI
Livability — Romulus
- Score
- 60/100
- State rank
- #593
- US rank
- #19387
Category grades
Schools grade is shown separately in the Schools card above.
Census & demographics
- Census place
- Romulus, MI
- County
- Wayne County · 1,562,939 people
- City population
- 32,211
- Metro
- Detroit-Warren-Dearborn, MI
- Population (ZIP)
- 32,211
- Household income
- $67,056
- Rent vs Own
- Severe rent burden
- 755.0
Population outlook (Wayne County) Hauer SSP2
- Today (2025)
- 1,675,273 people
- By 2030
- 1,620,300 · -3.3%
- By 2040
- 1,502,341 · -10.3%
- By 2050
- 1,384,039 · -17.4%
- By 2075
- 1,124,592 · -32.9%
- By 2100
- 881,193 · -47.4%
Race, ethnicity, and origin ACS 2023
- Neighborhood character
- Diverse neighborhood (Simpson 0.59)
- Race & ethnicity
- White 52% Black 37% Two or more races 8% Hispanic / Latino 2% Asian 1%
- Common ancestry
- Romanian 6% Lithuanian 3% Italian 2%
- Foreign-born
- 4% · Canada, Vietnam
- Languages at home
- 94% English-only · Spanish 2% Other Indo-European 1% Other Asian/Pacific 1%
Political lean MEDSL · Wayne
- 2024 margin
- Strong D (+29.0) · D 62.7% · R 33.7% · Other 3.6%
- 2008→2024 swing
- -20.5pp toward R · 2008: 49.5pp · 2024: 29.0pp
- All cycles
- 2024: D+29.0 2020: D+38.1 2016: D+37.3 2012: D+46.9 2008: D+49.5
Not yet ingested
- Civics
- —
Market trends
- HPI YoY
- ▼ -171.93%
- Current HPI
- 207.8345
- Rent YoY
- —
- Metro
- Detroit-Warren-Dearborn, MI
- State GDP YoY
- ▲ 1.37%
- F500 in state
- 28
Industry mix (Fortune 500 HQ in MI)
| Industry | F500 HQs | Revenue |
|---|---|---|
| Automotive Parts | 3 | $48B |
|
||
| Automotive | 2 | $372B |
|
||
| Chemicals | 1 | $45B |
|
||
| Automotive Retail | 1 | $29B |
|
||
| Healthcare / Medical Devices | 1 | $23B |
|
||
| Automotive Technology | 1 | $20B |
|
||
Price history
+19.9% since first listed44 events — show timeline
- 2026-04-17 Listed $179,900 MiRealSource-MiMLS
- 2026-04-17 Listed $179,900 REALCOMP
- 2026-04-14 Coming Soon $179,900 MiRealSource-MiMLS
- 2025-10-20 Sold (Public Records) $150,000 Public Records
- 2025-10-02 Sold (MLS) $150,000 REALCOMP
- 2025-10-02 Sold (MLS) $150,000 MiRealSource-MiMLS
- 2025-08-30 Pending — MiRealSource-MiMLS
- 2025-08-30 Pending — REALCOMP
- 2025-08-28 Price Changed $156,600 MiRealSource-MiMLS
- 2025-08-28 Price Changed $156,600 REALCOMP
- 2025-07-10 Listed $174,000 REALCOMP
- 2025-07-10 Listed $174,000 MiRealSource-MiMLS
- 2025-01-31 Listing Removed — MiRealSource-MiMLS
- 2025-01-31 Listing Removed — REALCOMP
- 2024-12-23 Price Changed $188,900 MiRealSource-MiMLS
- 2024-12-22 Price Changed $188,900 REALCOMP
- 2024-11-07 Price Changed $194,900 MiRealSource-MiMLS
- 2024-11-07 Price Changed $194,900 REALCOMP
- 2024-09-30 Listed $209,900 REALCOMP
- 2024-09-30 Listed $209,900 MiRealSource-MiMLS
- 2018-04-16 Sold (Public Records) $138,000 Public Records
- 2018-03-30 Sold (MLS) $138,000 MiRealSource-MiMLS
- 2018-03-30 Sold (MLS) $138,000 REALCOMP
- 2018-02-05 Pending — MiRealSource-MiMLS
- 2018-02-05 Pending — REALCOMP
- 2018-01-05 Price Changed $149,900 MiRealSource-MiMLS
- 2018-01-04 Price Changed $149,900 REALCOMP
- 2017-12-05 Listed $159,900 MiRealSource-MiMLS
- 2017-12-05 Listed $159,900 REALCOMP
- 2017-11-23 Listing Removed — MiRealSource-MiMLS
- 2017-11-23 Listing Removed — REALCOMP
- 2017-09-15 Price Changed $169,900 MiRealSource-MiMLS
- 2017-09-14 Price Changed $169,900 REALCOMP
- 2017-08-31 Price Changed $179,900 MiRealSource-MiMLS
- 2017-08-30 Price Changed $179,900 REALCOMP
- 2017-07-18 Price Changed $189,900 MiRealSource-MiMLS
- 2017-07-17 Price Changed $189,900 REALCOMP
- 2017-06-22 Listed $199,900 MiRealSource-MiMLS
- 2017-06-22 Listed $199,900 REALCOMP
- 2004-09-07 Sold (Public Records) $145,000 Public Records
- 2004-07-14 Sold (MLS) $145,000 REALCOMP
- 2004-01-07 Listing Removed — REALCOMP
- 2004-01-07 Listed $150,000 REALCOMP
- 2003-07-01 Listed $150,000 REALCOMP
Property tax history
+6.7%/yrLatest (2025): $4,394 · +12.4% YoY. Source: county tax records.
Cash-flow waterfall
monthlySold comps — $/sqft
last 12 mo · ≤1 miLoading sold comps…