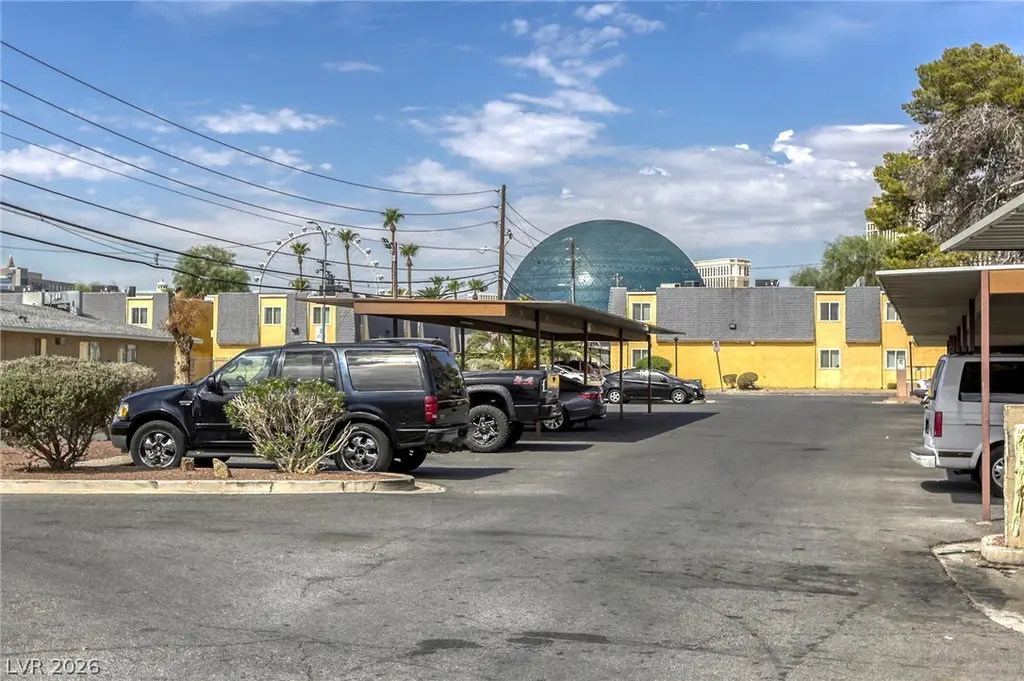
585 S Royal Crest Cir #20 · Paradise, NV
Flood risk 1/10 · Minimal
- FEMA flood zone
- X (unshaded)
- Chance of flooding over 30 yrs
- 0.0%
- Est. flood insurance / yr
- $507 – $1,088
Fire risk 1/10 · Minimal
- Est. fire insurance / yr
- $490 – $910
Heat risk 8/10 · Major
- Hot days now (above 106°F)
- 7 days/yr
- Hot days in 30 yrs
- 17 days/yr
Wind risk 1/10 · Minimal
- Chance of severe wind over 30 yrs
- —
Air-quality risk 3/10 · Minor
- Unhealthy air days now
- 3 days/yr
- Unhealthy air days in 30 yrs
- 4 days/yr
Risk factors via First Street. Map © Google.
Why this score? — see what drove the B- grade
The composite is a weighted blend of 9 inputs, each scored 0–100. Each bar is that input's sub-score; the figure is the points it added to the 100-point composite (weight × sub-score).
- Cash flow +28.2/30.0
- DSCR +10.0/10.0
- 1% rule +9.2/10.0
- ARV discount +7.5/15.0
- Livability +3.8/5.0
- Schools +2.6/10.0
- Condition / age +2.5/5.0
- Rent growth +1.4/5.0
- Appreciation +0.0/10.0
$109,900
🖨 Deal sheet 📄 Offer letter ✓ Due diligence
Listing remarks
Welcome home to this stylish one-bedroom condo featuring stainless steel appliances and an open layout that maximizes comfort and convenience. Perfectly located just minutes from UNLV, the Las Vegas Strip, shopping, dining, and entertainment, this condo offers unbeatable access to everything the city has to offer. Community pool! Whether you’re looking for a personal retreat, a low-maintenance lifestyle, or a great investment opportunity, this property is a must-see! Ask about down payment assitance options for this home!
Key facts
- Minutes from unlv
- Community pool
- Access to shopping
Tags
Property features AI
Finance
- Other: Zoned for multi-family
- HOA & community: Homeowners association (Royal Crest Arms HOA); HOA fee $240 per month; Association management included
Exterior
- Parking: Assigned covered parking; Detached carport with 1 carport space
- Utilities: Public water; Public sewer; Cable available; No photovoltaics
- Home design: Multi-family property; Single-story; Has attached property
- Construction: Tile roof; Resale property
- Exterior features: Desert landscaping; Landscaped; Less than quarter acre; No additional exterior features listed; Faces south
Interior
- Kitchen: Custom cabinets; Disposal; Gas range; Refrigerator
- Bedrooms: 1 possible bedroom
- Flooring: Carpet; Laminate
- Bathrooms: 1 full bathroom
- Heating & cooling: Central heating; Central air (electric)
- Interior features: Primary bedroom on the downstairs level; Unfurnished
- Laundry & utility: Washer; Dryer; Gas dryer hookup; Laundry on main level
Neighborhood map
What this means for you Summary
Snapshot
- This is a 1-bed/1.0-bath condo listed at $110k.
Deal economics
- At list price, monthly cash flow is $348 ($4k/yr) — positive.
- The deal already cash-flows at list — no discount required.
- Meets the 1% rule at list price ($2k rent vs $110k).
- Recommended offer: $107k (3.0% below list) — sets the bar for market timing.
Location & tenants
- Location reads 76/100 on livability (#10 in NV, #3,494 nationally) — a middle-class / working-renter tenant base. Strengths: commute A+, housing A-, cost of living B; Watch: employment D+, schools F, crime D-.
- Clark County School District (urban): math 21% / reading 39% proficiency, ranked #11 of 17 in NV (top 65%) — families likely to look elsewhere, expect single-tenant / working-renter base with shorter leases.
- Market conditions: Rents falling (-4.4%/yr); 178 active listings in the ZIP; 16 comparable units currently listed for rent nearby; rentals lingering (median 44d on market — plan ~5-8 weeks vacancy on turnover, expect pricing pressure); 50% of comp listings sitting > 30 days — soft ceiling on asking rent; lower-income renter base — watch delinquency; 14,754 units permitted in Clark County in 2024 (2,301 in 5+ unit buildings).
- At $1,564/mo this rent would consume 46% of the median local household income ($41k/yr) (locally 2744% of renters already pay >50% of income on rent) — very limited rent-growth headroom before tenants either downsize or default.
Forward outlook
- Local home prices are declining (-3.0%/yr); year-one equity from $760 of loan paydown is wiped out by about $3k of value loss. Plan a longer hold.
- Clark County population projected at +36% by 2050 — long-run rental-demand tailwind backs the buy-and-hold thesis.
Negotiation context
- It's been on market 37 days — a 3% lower offer ($107k) is reasonable based on typical stale-listing flexibility.
- 5 sale attempts since 10y ago with the ask held roughly flat each time — persistent listings suggest the price (not the market) is what's stuck; bring a comps-based counter.
- Current owner paid $25k; list at $110k implies a 340% gain — meaningful room to come down on a strong offer.
Risks & watch-outs
- Climate carrying-cost: extreme-heat days projected 7→17/yr by 2055 (HVAC capex compounding) — expect insurance premiums to compound above CPI over the hold.
Questions for the listing agent
- It's been on market 37 days. Have you received any prior offers? Is the seller open to a 3% concession, seller financing, or rate buy-down credit?
- Built in 1963 — when were the roof, HVAC, electrical panel, plumbing, and water heater last replaced?
- What does the HOA fee cover, when was the last increase, and are there any pending special assessments or reserve-fund shortfalls?
- Any open or pending special assessments — roof, HVAC, plumbing, elevator, façade? What's the per-unit balance and payoff schedule, and is the seller paying it off at close or rolling it to the buyer?
- Is there a deadline driving the sale (1031 exchange, divorce, estate, relocation)? That informs how much negotiation room exists.
- Schools are F-rated, which usually means shorter tenancies and higher turnover. Who's the typical renter profile here, and what's been the actual vacancy rate?
- Crime grade is D in this area — have there been break-ins, vandalism, or insurance claims at this property in the last 3 years? What carrier currently insures it and at what premium?
- What's the average days-on-market for RENTAL listings here right now (not sales)? A rising rental-DOM trend means longer vacancies and softer asking-rent achievability than the comps imply.
- What's the recent tenant-quality profile in this submarket — average credit score on applications, eviction rate, late-payment / NSF rate, and stable-employment percentage? A property-management company in the area should have these aggregated.
- How much new apartment / multifamily construction is in the pipeline within 1–3 miles? Heavy new supply (>2% of stock underway) typically softens rents 12–24 months out; light construction supports rent growth.
Investment metrics
- 1% rule
- 1.42% ✓
- Cap rate
- 10.09%
- Cash-on-cash
- 13.56%
- DSCR
- 1.60
- GRM
- 5.9
CMA / ARV
No comps found within radius.
Projected returns pro-forma
-3.0% appreciation · 0.0% rent growth · sell at horizon
- IRR
- -0.1%
- Equity multiple
- 1.00×
- Total profit
- $-144
- Equity at exit
- $16,386
- IRR
- 5.7%
- Equity multiple
- 1.36×
- Total profit
- $11,091
- Equity at exit
- $9,502
Cash invested: $30,772 (down + closing). Projections, not guarantees.
Landlord ↔ Tenant lean methodology
- Overall (STATE)
- 71 Landlord-Friendly
- State Nevada
- 71 Landlord-Friendly · R+1
- County
- — inherits STATE
- City
- — inherits STATE
ZIP-level market 89169
- Home prices YoY
- -33.4%
- Rents YoY
- -4.4%
- Active inventory
- 178
- Price-to-rent
- 5.9×
Monthly cashflow live
- Estimated rent
- $1,564 high interval (Pro) →
- Mortgage (P&I)
- −$576
- Tax from tax record
- −$26 /mo · $312/yr
- Insurance
- −$46
- HOA
- −$240
- Vacancy / Maint / Mgmt
- −$329
- Net cashflow
- $348
Break-even live
UW: 25.0% down · 7.5% · 30yr · 1.5% tax · 5.0% vac · 8.0% maint · 8.0% mgmt
Financing live
Cash to close
- Down payment
- $27,475
- Closing costs
- $3,297
- Reserves months
- —
- Total cash needed
- —
Loan-product check · same deal, 3 products live
Conventional
25% down · 7.5% · 30yr
- Down + closing
- —
- Monthly P&I
- —
- Monthly cashflow
- —
- DSCR
- —
- Eligible?
- —
Personal DTI + credit; lowest rate.
DSCR
20% down · 8.5% · 30yr
- Down + closing
- —
- Monthly P&I
- —
- Monthly cashflow
- —
- DSCR
- —
- Eligible?
- —
No personal income docs; deal must DSCR.
Hard money
10% down · 12.0% · 12mo
- Down + closing
- —
- Monthly P&I
- —
- Monthly cashflow
- —
- DSCR
- —
- Eligible?
- —
Short-term bridge; refi at stabilization.
Rent comps 16 comps
| Address | Beds | Baths | Sqft | Rent | $/sqft | DOM | Units | Dist |
|---|---|---|---|---|---|---|---|---|
| 3550 Paradise Rd Las Vegas, NV | 3.0 | 1.0–2.0 | 947 | $1,100 | $1.16 | 43d | 20 | 0.24mi |
| 3930 Paradise Rd Las Vegas, NV | 3.0 | 1.0–2.0 | 999 | $2,241 | $2.24 | 2d | 87 | 0.36mi |
| 3776 Howard Hughes Pkwy Las Vegas, NV | 3.0 | 1.0–2.5 | 1548 | $2,357 | $1.52 | 1d | 9 | 0.42mi |
| 818 E Flamingo Rd Las Vegas, NV | 1.0–2.0 | 1.0–2.5 | 1158 | $1,395 | $1.20 | 2d | 34 | 0.51mi |
| 1061 E Flamingo Rd Las Vegas, NV | 1.0–2.0 | 1.0–2.0 | 967 | $1,117 | $1.15 | 14d | 35 | 0.79mi |
| 260 E Flamingo Rd Las Vegas, NV | 1.0–2.0 | 1.0–2.0 | 881 | $1,600 | $1.82 | 43d | 4 | 0.84mi |
| 270 E Flamingo Rd Las Vegas, NV | 1.0–2.0 | 1.0–2.0 | 877 | $1,695 | $1.93 | 43d | 7 | 0.86mi |
| 230 E Flamingo Rd #335 Las Vegas, NV | 1.0 | 1.0 | 727 | $1,600 | $2.20 | 43d | 1 | 0.86mi |
| 210 E Flamingo Rd Las Vegas, NV | 1.0–2.0 | 1.0–2.0 | 833 | $1,795 | $2.15 | 43d | 6 | 0.91mi |
| 220 E Flamingo Rd #229 Las Vegas, NV | 1.0 | 1.0 | 692 | $2,195 | $3.17 | 23d | 1 | 0.92mi |
| 220 E Flamingo Rd #229 Las Vegas, NV | 1.0 | 1.0 | 692 | $2,195 | $3.17 | 21d | 1 | 0.92mi |
| 220 E Flamingo Rd Las Vegas, NV | 1.0–2.0 | 1.0–2.0 | 863 | $1,595 | $1.85 | 43d | 7 | 0.94mi |
| 1601 E Katie Ave Las Vegas, NV | 1.0–2.0 | 1.0–2.0 | 809 | $1,325 | $1.64 | 43d | 13 | 1.00mi |
| 2000 Fashion Show Dr Unit 1501424P Las Vegas, NV | 1.0 | 1.0 | 592 | $5,942 | $10.04 | 2d | 1 | 1.38mi |
| 135 E Harmon Ave Unit 25707 Las Vegas, NV | — | 1.0 | 520 | $2,750 | $5.29 | 21d | 1 | 1.49mi |
| 4700 S Maryland Pkwy Las Vegas, NV | 1.0 | 1.0 | 409 | $1,382 | $3.37 | 43d | 48 | 1.50mi |
HOA detail condo
- Monthly dues
- $240 · $2,880/yr
- Likely covers
- gaspool
- Assessments
- None detected in remarks — confirm with the listing agent.
Listing history 20 events
-
2026-06-18days on market $109,900 Active 37 DOM
-
2026-06-17days on market $109,900 Active 36 DOM
-
2026-06-16days on market $109,900 Active 35 DOM
-
2026-06-15days on market $109,900 Active 34 DOM
-
2026-06-13days on market $109,900 Active 32 DOM
-
2026-06-09days on market $109,900 Active 28 DOM
-
2026-06-08days on market $109,900 Active 27 DOM
-
2026-06-07days on market $109,900 Active 26 DOM
-
2026-06-03days on market $109,900 Active 22 DOM
-
2026-06-02days on market $109,900 Active 21 DOM
-
2026-06-01days on market $109,900 Active 20 DOM
-
2026-05-31days on market $109,900 Active 19 DOM
-
2026-05-11$109,900 Active 533-char remark
-
2026-04-08historical
-
2026-04-07status Active
-
2025-12-17status Active
-
2025-08-22$109,900 Active
-
2016-06-03historical
-
2016-04-10$49,900 Exclusive Right
-
2014-07-08soldstatus $25,000
ⓘ Source: listings_history table (triggers on properties + properties_extension) + one-shot
backfill from property_details.listing_events for pre-trigger history.
Tax reassessment forecast NV · Resets to sale price
- Current annual tax
- $312 · $26/mo
- Projected year-2 tax
- $648 · $54/mo
- Expected delta
- +$336/yr (+$28/mo · 107.8%)
ⓘ Screening estimate from a state-policy table — verify with the county assessor before closing.
Climate risk First Street
- Flood 1/10 Low FEMA zone X (unshaded) · 0% chance over 30 yrs
- Wildfire 1/10 Low
- Heat 8/10 Severe 7 d/yr ≥106°F today · 17 d/yr by 30 yrs out
- Wind 1/10 Low
- Air quality 3/10 Moderate 3 unhealthy d/yr today · 4 by 30 yrs out
Nearby sold comps map
Loading sold comps map…
Walkable amenities ~0.75 mi
Loading nearby amenities…
Taxation est. · year 1
- Rental income
- $18,772
- − Mortgage interest
- −$6,156
- − Property taxes
- −$312
- − Insurance
- −$550
- − Repairs & maintenance
- −$1,502
- − Management
- −$1,502
- − HOA
- −$2,880
- − Depreciation
- −$3,197
- Taxable income
- $2,674
- Est. tax owed @ 24.0%
- −$642
- After-tax cash flow
- $3,531/yr
For passive investors: Depreciation is non-cash, so a rental often shows a tax loss while cash-flowing — sheltering income. Rental losses are passive: they offset passive income freely, and up to $25,000/yr can offset ordinary (W-2) income if you actively participate and your MAGI is under $100k (phasing out to $0 by $150k); unused losses carry forward. On sale, claimed depreciation is recaptured at up to 25%, and gains may owe capital-gains tax (a 1031 exchange can defer both). Figures are a year-1 estimate at your 24.0% rate — not tax advice; consult a CPA.
Schools (NCES district)
- District
- Clark County School District
- NCES district ID
- 3200060
- Math proficiency
- 21% ▼ -13.00%
- Reading proficiency
- 39% ▼ -8.00%
- Median HH income
- $53,611
- Composite
- 26.48/100
- National rank
- #7211
- State rank
- #11 of 17 in NV
Livability — Paradise
- Score
- 76/100
- State rank
- #10
- US rank
- #3494
Category grades
Schools grade is shown separately in the Schools card above.
Census & demographics
- Census place
- Paradise, NV
- County
- Clark County · 2,306,105 people
- City population
- 227,885
- Metro
- Las Vegas-Henderson-Paradise, NV
- Population (ZIP)
- 22,171
- Household income
- $40,904
- Rent vs Own
- Severe rent burden
- 2744.0
Population outlook (Clark County) Hauer SSP2
- Today (2025)
- 2,504,101 people
- By 2030
- 2,693,770 · +7.6%
- By 2040
- 3,061,208 · +22.2%
- By 2050
- 3,400,072 · +35.8%
- By 2075
- 4,139,522 · +65.3%
- By 2100
- 4,596,916 · +83.6%
Race, ethnicity, and origin ACS 2023
- Neighborhood character
- Highly diverse neighborhood (Simpson 0.74)
- Race & ethnicity
- Hispanic / Latino 33% White 30% Black 23% Two or more races 13% Asian 9% Native American 2%
- Hispanic origin (detail)
- Mexican 21% Cuban 5%
- Common ancestry
- Iranian 1% Italian 1% Slovak 1%
- Foreign-born
- 30% · Canada, China
- Languages at home
- 59% English-only · Spanish 27% Tagalog/Filipino 4% Other Asian/Pacific 3%
Political lean MEDSL · Clark
- 2024 margin
- Toss-up / Even · D 50.4% · R 47.8% · Other 1.7%
- 2008→2024 swing
- -16.5pp toward R · 2008: 19.1pp · 2024: 2.6pp
- All cycles
- 2024: D+2.6 2020: D+9.3 2016: D+10.7 2012: D+14.5 2008: D+19.1
Not yet ingested
- Civics
- —
Market trends
- HPI YoY
- ▼ -136.91%
- Current HPI
- 272.6449
- Rent YoY
- ▼ -4.43%
- Metro
- Las Vegas-Henderson-Paradise, NV
- State GDP YoY
- ▲ 3.08%
- F500 in state
- 6
Industry mix (Fortune 500 HQ in NV)
| Industry | F500 HQs | Revenue |
|---|---|---|
| Hotels / Casinos | 3 | $36B |
|
||
Price history
+339.6% since first listed8 events — show timeline
- 2026-05-11 Listed $109,900 GLVAR
- 2026-04-08 Listing Removed — GLVAR
- 2026-04-07 Relisted — GLVAR
- 2025-12-17 Relisted — GLVAR
- 2025-08-22 Listed $109,900 GLVAR
- 2016-06-03 Listing Removed — GLVAR
- 2016-04-10 Listed $49,900 GLVAR
- 2014-07-08 Sold (Public Records) $25,000 Public Records
Property tax history
-0.4%/yrLatest (2025): $312 · -30.2% YoY. Source: county tax records.
Cash-flow waterfall
monthlySold comps — $/sqft
last 12 mo · ≤1 miLoading sold comps…