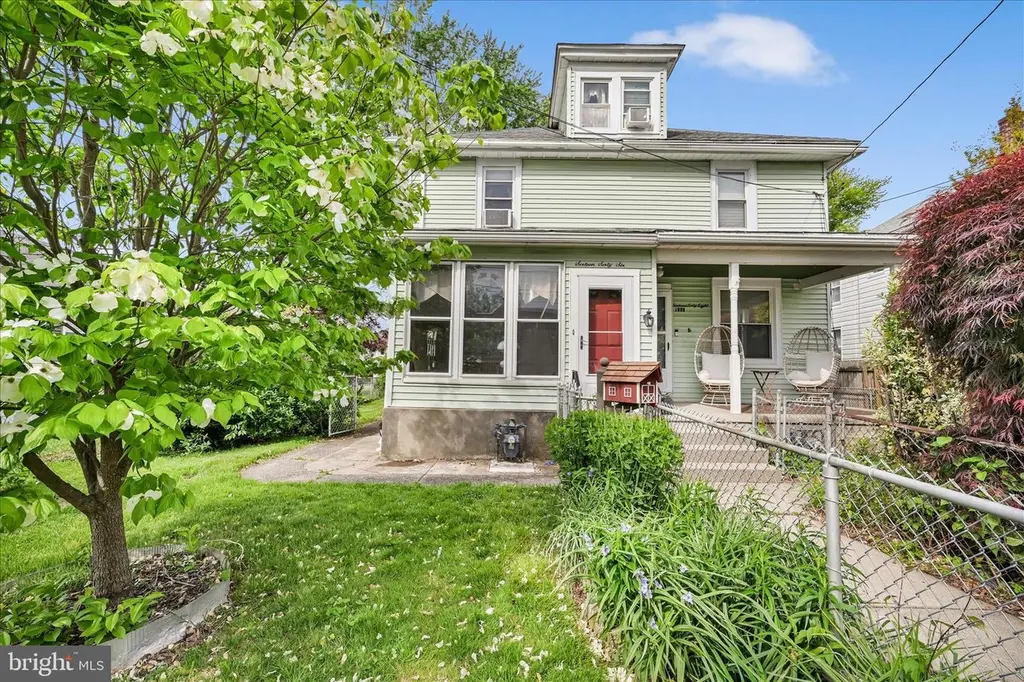
1666 Ward St · Linwood, PA
Flood risk 1/10 · Minimal
- FEMA flood zone
- X (unshaded)
- Chance of flooding over 30 yrs
- 0.0%
- Est. flood insurance / yr
- $473 – $860
Fire risk 1/10 · Minimal
- Est. fire insurance / yr
- $511 – $949
Heat risk 7/10 · Major
- Hot days now (above 104°F)
- 7 days/yr
- Hot days in 30 yrs
- 15 days/yr
Wind risk 6/10 · Moderate
- Chance of severe wind over 30 yrs
- 27.0%
Air-quality risk 4/10 · Minor
- Unhealthy air days now
- 4 days/yr
- Unhealthy air days in 30 yrs
- 7 days/yr
Risk factors via First Street. Map © Google.
Why this score? — see what drove the D- grade
The composite is a weighted blend of 9 inputs, each scored 0–100. Each bar is that input's sub-score; the figure is the points it added to the 100-point composite (weight × sub-score).
- Cash flow +14.5/30.0
- ARV discount +5.2/15.0
- DSCR +4.4/10.0
- Livability +4.0/5.0
- 1% rule +3.1/10.0
- Rent growth +3.0/5.0
- Schools +2.7/10.0
- Condition / age +2.5/5.0
- Appreciation +0.0/10.0
$225,000
🖨 Deal sheet 📄 Offer letter ✓ Due diligence
Listing remarks
Charm and character abound in this Marcus Hook twin nestled on Ward Street in the desirable Linwood section of the Chichester School District. Lovingly maintained by the same family since the early 1970s, this home reflects decades of pride in ownership and impeccable care throughout. Spacious yet warm and manageable, it offers the perfect blend of comfort, functionality, and timeless appeal. The first floor features a generously sized living room, formal dining room, eat-in kitchen, and both front and rear enclosed porch areas—perfect for relaxing, entertaining, or creating additional flex space. Upstairs, you’ll find three generously sized bedrooms and a full bath, while the w
Key facts
- Enclosed porch areas
- Bonus storage shed
- Walk up third floor
Tags
Property features AI
Exterior
- Parking: Alley access; On-street parking
- Utilities: Public water; Public sewer; Municipal trash collection
- Home design: Semi-detached property; Fee simple ownership
- Construction: Vinyl and aluminum siding; Architectural shingle roof; Other type foundation; Built according to assessor records
- Exterior features: Lot approximately 35 x 147; Shed on property; No tidal water; Pets allowed with no restrictions
Interior
- Kitchen: Built-in range; Stove; Refrigerator
- Bedrooms: Three bedrooms on the first upper level
- Flooring: Fully carpeted
- Bathrooms: One full bathroom
- Heating & cooling: Hot water heating (oil-fired); Window air conditioning units; Electric cooling; Circuit breaker electrical service
- Interior features: Carpeted surfaces; Combination dining and living area; Separate dining area; Traditional floor plan; Eat-in kitchen; Unfinished basement
- Laundry & utility: Washer; Dryer; Main-floor laundry; 60+ gallon hot water tank
Neighborhood map
What this means for you Summary
Snapshot
- This is a 3-bed/1.0-bath townhouse listed at $225k.
Deal economics
- At list price, monthly cash flow is $50 ($601/yr) — positive.
- The deal already cash-flows at list — no discount required.
- To meet the 1% rule (rent ≥ 1% of price), the offer needs to be $183k (18.6% below list).
- Recommended offer: $183k (18.6% below list) — sets the bar for 1% rule.
Location & tenants
- Location reads 79/100 on livability (#234 in PA, #2,020 nationally) — a middle-class / working-renter tenant base. Strengths: cost of living A+, housing A+, crime A; Watch: commute D+, amenities F.
- Chichester SD (suburban): math 19% / reading 41% proficiency, ranked #438 of 539 in PA (top 81%) — families likely to look elsewhere, expect single-tenant / working-renter base with shorter leases.
- Zoned schools: Chichester Ms (math 8% / reading 38%, grade F, #426 of 512 statewide, top 83%, 952 students, 100% FRL); Chichester Shs (math 47% / reading 15%, grade F, #340 of 437 statewide, top 78%, 996 students, 90% FRL) — zoned schools average 95% FRL vs 52% district-wide (43 pts higher); higher-poverty schools than district average — tighter screening recommended.
- Market conditions: Rents rising (+1.8%/yr); 68 active listings in the ZIP; 11 comparable units currently listed for rent nearby; rentals at typical pace (median 19d on market — plan ~3-4 weeks tenant-placement turnaround); solid renter incomes; 299 units permitted in Delaware County in 2024 (5 in 5+ unit buildings).
Forward outlook
- Local home prices are declining (-3.0%/yr); year-one equity from $2k of loan paydown is wiped out by about $7k of value loss. Plan a longer hold.
Negotiation context
- It's been on market 29 days — a 2% lower offer ($222k) is reasonable based on typical stale-listing flexibility.
- 3 sale attempts with the ask held roughly flat each time — persistent listings suggest the price (not the market) is what's stuck; bring a comps-based counter.
Risks & watch-outs
- Watch-outs: built in 1940 — expect roof / HVAC / electrical / plumbing capex.
- Climate carrying-cost: major wind risk, 27% chance of damaging wind over 30y; extreme-heat days projected 7→15/yr by 2055 (HVAC capex compounding) — expect insurance premiums to compound above CPI over the hold.
Questions for the listing agent
- Built in 1940 — when were the roof, HVAC, electrical panel, plumbing, and water heater last replaced?
- Is there a deadline driving the sale (1031 exchange, divorce, estate, relocation)? That informs how much negotiation room exists.
- The area grade is low — what's the realistic commute time and amenity access for the typical tenant pool here? Any planned neighborhood developments (good or bad) we should know about?
- What's the average days-on-market for RENTAL listings here right now (not sales)? A rising rental-DOM trend means longer vacancies and softer asking-rent achievability than the comps imply.
- What's the recent tenant-quality profile in this submarket — average credit score on applications, eviction rate, late-payment / NSF rate, and stable-employment percentage? A property-management company in the area should have these aggregated.
- How much new for-sale + rental construction is in the pipeline within 1–3 miles? Heavy new supply typically softens prices + rents 12–24 months out; constrained supply supports both.
Investment metrics
- 1% rule
- 0.81% ✗
- Cap rate
- 6.56%
- Cash-on-cash
- 0.95%
- DSCR
- 1.04
- GRM
- 10.2
CMA / ARV
- ARV (median comp)
- $214,152
- List price
- $225,000
- Delta
- 5.07%
- Verdict
- FAIR
- Comps
- 20 within 1.0 mi
Show comp detail 12 sales within ~0.75 mi
| Address | Dist | Beds/Ba | Sqft | Sold | Price | $/sf | Match |
|---|---|---|---|---|---|---|---|
| 1637 Huddell | 0.04mi | 3/1.5 | 1,386 (-0%) | 6mo | $250,000 | $180 | 90 |
| 160 W Ridge Rd | 0.36mi | 3/1.5 | 1,374 (-1%) | 3mo | $217,000 | $158 | 77 |
| 1927 Pleasantview Ave | 0.21mi | 3/1.0 | 1,306 (-6%) | 7mo | $200,000 | $153 | 74 |
| 1425 Hewes | 0.35mi | 3/1.5 | 1,316 (-5%) | 4mo | $220,000 | $167 | 70 |
| 303 Johnson Ave | 0.14mi | 3/1.5 | 1,245 (-10%) | 8mo | $249,000 | $200 | 67 |
| 1570 Market St | 0.08mi | 3/2.0 | 1,558 (+12%) | 8mo | $160,000 | $103 | 66 |
| 1471 Tallylynn Ave | 0.51mi | 3/1.5 | 1,340 (-4%) | 4mo | $250,000 | $187 | 65 |
| 1421 Bradley St | 0.44mi | 3/1.5 | 1,448 (+4%) | 8mo | $279,900 | $193 | 64 |
| 630 Taylor Ave | 0.22mi | 2/1.0 (-1) | 1,200 (-14%) | 0mo | $235,500 | $196 | 62 |
| 1118 Green St | 0.58mi | 2/1.0 (-1) | 1,302 (-6%) | 2mo | $100,000 | $77 | 56 |
| 1024 Washington Ave | 0.63mi | 3/1.0 | 1,238 (-11%) | 9mo | $190,000 | $153 | 45 |
| 1128 Green St | 0.56mi | 3/1.0 | 1,188 (-15%) | 9mo | $159,900 | $135 | 42 |
Match score weights: distance 35% · size 25% · config 20% · recency 20%. Top-matched comps best support the ARV.
Projected returns pro-forma
-3.0% appreciation · 1.83% rent growth · sell at horizon
- IRR
- -16.0%
- Equity multiple
- 0.44×
- Total profit
- $-35,471
- Equity at exit
- $33,548
- IRR
- -9.7%
- Equity multiple
- 0.43×
- Total profit
- $-35,606
- Equity at exit
- $19,454
Cash invested: $63,000 (down + closing). Projections, not guarantees.
Landlord ↔ Tenant lean methodology
- Overall (STATE)
- 62 Landlord-Friendly
- State Pennsylvania
- 62 Landlord-Friendly · EVEN
- County
- — inherits STATE
- City
- — inherits STATE
ZIP-level market 19061
- Rents YoY
- 1.8%
- Active inventory
- 68
- Price-to-rent
- 10.2×
Monthly cashflow live
- Estimated rent
- $1,832 high interval (Pro) →
- Mortgage (P&I)
- −$1,180
- Tax from tax record
- −$124 /mo · $1,486/yr
- Insurance
- −$94
- HOA
- −$0
- Vacancy / Maint / Mgmt
- −$385
- Net cashflow
- $50
Break-even live
UW: 25.0% down · 7.5% · 30yr · 1.5% tax · 5.0% vac · 8.0% maint · 8.0% mgmt
Financing live
Cash to close
- Down payment
- $56,250
- Closing costs
- $6,750
- Reserves months
- —
- Total cash needed
- —
Loan-product check · same deal, 3 products live
Conventional
25% down · 7.5% · 30yr
- Down + closing
- —
- Monthly P&I
- —
- Monthly cashflow
- —
- DSCR
- —
- Eligible?
- —
Personal DTI + credit; lowest rate.
DSCR
20% down · 8.5% · 30yr
- Down + closing
- —
- Monthly P&I
- —
- Monthly cashflow
- —
- DSCR
- —
- Eligible?
- —
No personal income docs; deal must DSCR.
Hard money
10% down · 12.0% · 12mo
- Down + closing
- —
- Monthly P&I
- —
- Monthly cashflow
- —
- DSCR
- —
- Eligible?
- —
Short-term bridge; refi at stabilization.
Rent comps 11 comps
| Address | Beds | Baths | Sqft | Rent | $/sqft | DOM | Units | Dist |
|---|---|---|---|---|---|---|---|---|
| 119 E Laughead Ave Marcus Hook, PA | 3.0 | 1.5 | 1080 | $1,530 | $1.42 | 3d | 1 | 0.19mi |
| 130 Harvey Ave Unit 1 Linwood, PA | 3.0 | 1.0 | 1173 | $1,750 | $1.49 | 10d | 1 | 0.26mi |
| 151 Chadwick Ave Marcus Hook, PA | 3.0 | 1.5 | 1080 | $1,600 | $1.48 | 10d | 1 | 0.29mi |
| 1015 McClenahan Ter Marcus Hook, PA | 3.0 | 2.5 | 1456 | $2,400 | $1.65 | 10d | 1 | 0.69mi |
| 15 Marshall Ave Marcus Hook, PA | 3.0 | 1.0 | 1204 | $1,600 | $1.33 | 24d | 1 | 0.75mi |
| 8 W 8th St Marcus Hook, PA | 3.0 | 1.0 | 1120 | $1,600 | $1.43 | 18d | 1 | 0.84mi |
| 7 W 6th St Marcus Hook, PA | 3.0 | 1.0 | 1287 | $1,815 | $1.41 | 15d | 1 | 0.97mi |
| 36 Andrews Ct Media, PA | 3.0 | 2.5 | 1632 | $2,600 | $1.59 | 43d | 1 | 1.02mi |
| 237 Ridge Rd Claymont, DE | 2.0 | 1.0 | 950 | $1,700 | $1.79 | 22d | 1 | 1.31mi |
| 3312 W 13th St Chester, PA | 2.0 | 1.0 | 936 | $1,499 | $1.60 | 21d | 1 | 1.36mi |
| 49 Story Rd Upper Chichester, PA | 3.0 | 1.5 | 1742 | $2,450 | $1.41 | 43d | 1 | 1.41mi |
Listing history 13 events
-
2026-06-18days on market $225,000 Active 29 DOM
-
2026-06-17days on market $225,000 Active 28 DOM
-
2026-06-16days on market $225,000 Active 27 DOM
-
2026-06-15days on market $225,000 Active 26 DOM
-
2026-06-13days on market $225,000 Active 24 DOM
-
2026-06-13statusdays on market $225,000 Active 23 DOM
-
2026-06-04statusdays on market $225,000 Active Under Contract 21 DOM
-
2026-06-03days on market $225,000 Active 20 DOM
-
2026-06-02days on market $225,000 Active 19 DOM
-
2026-06-01days on market $225,000 Active 18 DOM
-
2026-05-31days on market $225,000 Active 17 DOM
-
2026-05-18historical Active Under Contract 1462-char remark
-
2026-05-12$225,000 Active 1462-char remark
ⓘ Source: listings_history table (triggers on properties + properties_extension) + one-shot
backfill from property_details.listing_events for pre-trigger history.
Tax reassessment forecast PA · Partial reset (capped growth)
- Current annual tax
- $1,486 · $124/mo
- Projected year-2 tax
- $2,521 · $210/mo
- Expected delta
- +$1,034/yr (+$86/mo · 69.6%)
ⓘ Screening estimate from a state-policy table — verify with the county assessor before closing.
Climate risk First Street
- Flood 1/10 Low FEMA zone X (unshaded) · 0% chance over 30 yrs
- Wildfire 1/10 Low
- Heat 7/10 Severe 7 d/yr ≥104°F today · 15 d/yr by 30 yrs out
- Wind 6/10 Major 27% chance of damaging wind over 30 yrs
- Air quality 4/10 Moderate 4 unhealthy d/yr today · 7 by 30 yrs out
Nearby sold comps map
Loading sold comps map…
Walkable amenities ~0.75 mi
Loading nearby amenities…
Taxation est. · year 1
- Rental income
- $21,989
- − Mortgage interest
- −$12,603
- − Property taxes
- −$1,486
- − Insurance
- −$1,125
- − Repairs & maintenance
- −$1,759
- − Management
- −$1,759
- − Depreciation
- −$6,545
- Taxable loss
- −$3,289
- Est. tax savings @ 24.0%
- +$789
- After-tax cash flow
- $1,391/yr
For passive investors: Depreciation is non-cash, so a rental often shows a tax loss while cash-flowing — sheltering income. Rental losses are passive: they offset passive income freely, and up to $25,000/yr can offset ordinary (W-2) income if you actively participate and your MAGI is under $100k (phasing out to $0 by $150k); unused losses carry forward. On sale, claimed depreciation is recaptured at up to 25%, and gains may owe capital-gains tax (a 1031 exchange can defer both). Figures are a year-1 estimate at your 24.0% rate — not tax advice; consult a CPA.
Schools (NCES district)
- District
- Chichester SD
- NCES district ID
- 4205910
- Math proficiency
- 19% ▼ -12.00%
- Reading proficiency
- 41% ▼ -17.00%
- Median HH income
- $57,612
- Composite
- 26.84/100
- National rank
- #7110
- State rank
- #438 of 539 in PA
Livability — Linwood
- Score
- 79/100
- State rank
- #234
- US rank
- #2020
Category grades
Schools grade is shown separately in the Schools card above.
Census & demographics
- Census place
- Linwood, PA
- County
- Delaware County · 399,863 people
- City population
- 20,135
- Metro
- Philadelphia-Camden-Wilmington, PA-NJ-DE-MD
- Population (ZIP)
- 19,896
- Household income
- $82,005
- Rent vs Own
- Severe rent burden
- 612.0
Population outlook (Delaware County) Hauer SSP2
- Today (2025)
- 577,490 people
- By 2030
- 581,243 · +0.6%
- By 2040
- 584,700 · +1.2%
- By 2050
- 586,581 · +1.6%
- By 2075
- 598,706 · +3.7%
- By 2100
- 590,823 · +2.3%
Race, ethnicity, and origin ACS 2023
- Neighborhood character
- Predominantly White (74%)
- Race & ethnicity
- White 74% Black 11% Hispanic / Latino 5% Two or more races 5% Asian 4%
- Hispanic origin (detail)
- Mexican 1% Puerto Rican 2%
- Common ancestry
- Romanian 5% Subsaharan African 3% Polish 2%
- Foreign-born
- 8% · Canada, China, South Korea
- Languages at home
- 90% English-only · Spanish 3% Chinese 3% Other Indo-European 1%
Political lean MEDSL · Delaware
- 2024 margin
- Strong D (+23.7) · D 61.4% · R 37.6% · Other 1.0%
- 2008→2024 swing
- +2.3pp toward D · 2008: 21.4pp · 2024: 23.7pp
- All cycles
- 2024: D+23.7 2020: D+26.7 2016: D+22.0 2012: D+21.8 2008: D+21.4
Not yet ingested
- Civics
- —
Market trends
- HPI YoY
- ▼ -187.71%
- Current HPI
- 265.507
- Rent YoY
- ▲ 1.83%
- Metro
- Philadelphia-Camden-Wilmington, PA-NJ-DE-MD
- State GDP YoY
- ▲ 1.68%
- F500 in state
- 34
Industry mix (Fortune 500 HQ in PA)
| Industry | F500 HQs | Revenue |
|---|---|---|
| Healthcare | 2 | $309B |
|
||
| Insurance | 2 | $27B |
|
||
| Telecommunications / Media | 1 | $124B |
|
||
| Industrial Distribution | 1 | $22B |
|
||
| Financial Services | 1 | $20B |
|
||
| Chemicals / Materials | 1 | $18B |
|
||
Price history
5 events — show timeline
- 2026-06-10 Relisted — BRIGHT MLS
- 2026-06-04 Contingent — BRIGHT MLS
- 2026-05-20 Relisted — BRIGHT MLS
- 2026-05-18 Contingent — BRIGHT MLS
- 2026-05-12 Listed $225,000 BRIGHT MLS
Property tax history
-3.9%/yrLatest (2026): $1,486 · -67.7% YoY. Source: county tax records.
Cash-flow waterfall
monthlySold comps — $/sqft
last 12 mo · ≤1 miLoading sold comps…