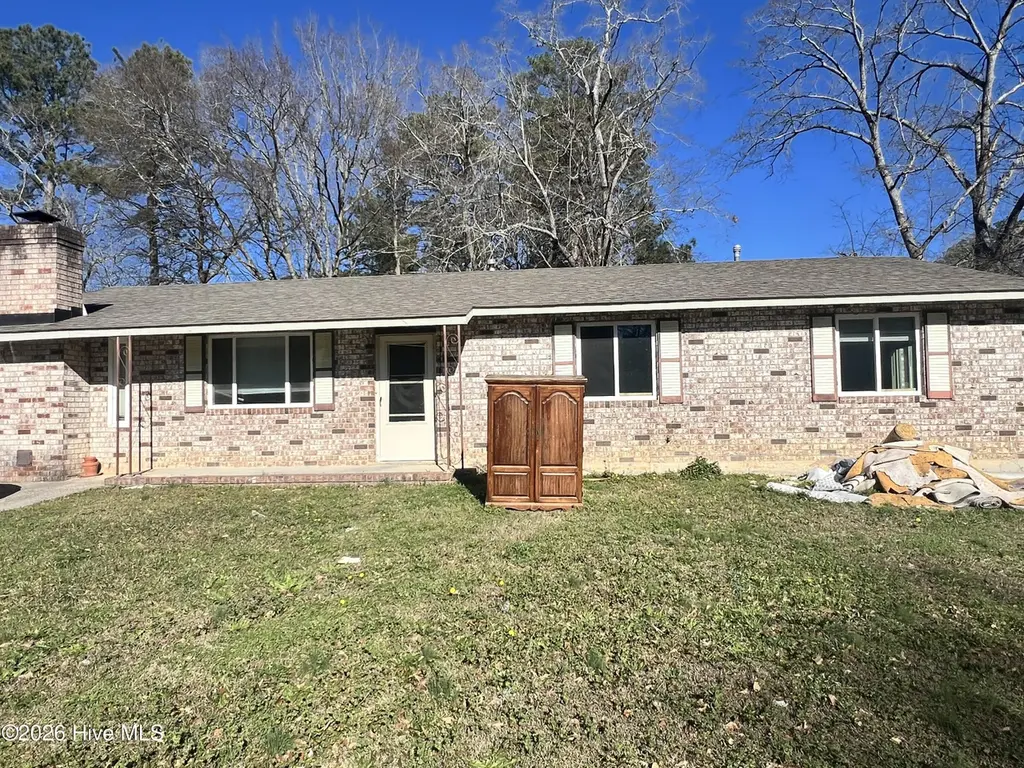
2603 Brookshire Rd · Augusta-Richmond County consolidated government (balance), GA
Flood risk 1/10 · Minimal
- FEMA flood zone
- X (unshaded)
- Chance of flooding over 30 yrs
- 0.0%
- Est. flood insurance / yr
- $507 – $1,088
Fire risk 4/10 · Minor
- Est. fire insurance / yr
- $963 – $1,789
Heat risk 7/10 · Major
- Hot days now (above 107°F)
- 7 days/yr
- Hot days in 30 yrs
- 17 days/yr
Wind risk 6/10 · Moderate
- Chance of severe wind over 30 yrs
- 65.0%
Air-quality risk 3/10 · Minor
- Unhealthy air days now
- 3 days/yr
- Unhealthy air days in 30 yrs
- 3 days/yr
Risk factors via First Street. Map © Google.
Why this score? — see what drove the B- grade
The composite is a weighted blend of 9 inputs, each scored 0–100. Each bar is that input's sub-score; the figure is the points it added to the 100-point composite (weight × sub-score).
- Cash flow +30.0/30.0
- 1% rule +10.0/10.0
- DSCR +10.0/10.0
- ARV discount +7.5/15.0
- Livability +2.5/5.0
- Condition / age +2.5/5.0
- Rent growth +2.4/5.0
- Schools +1.3/10.0
- Appreciation +0.0/10.0
$75,000
🖨 Deal sheet 📄 Offer letter ✓ Due diligence
Listing remarks MLS
BANK RESALE. SOLD "AS IS" SEPARATE FAMILY ROOM WITH FIREPLACE, LARGE EATING AREA IN KITCHEN, NEEDS COSMETIC REPAIRS. GOOD INVESTMENT OPPORTUNITY
Key facts
- 0.25 acre lot
- Built 1970
Property features AI
Exterior
- Parking: Other parking
- Utilities: Other utilities
- Home design: Single family residence; One story, entry level 1; Residential property
- Construction: Brick and frame construction; Block foundation; Composition roof; Built on one level
- Exterior features: Patio/porch (other); No fencing; Has a view
Interior
- Bathrooms: 1 full bathroom; 1 half bathroom
- Heating & cooling: Has heating (other); Has cooling (other)
- Interior features: Other interior features
Neighborhood map
What this means for you Summary
Snapshot
- This is a 3-bed/1.5-bath single-family listed at $75k.
Deal economics
- At list price, monthly cash flow is $579 ($7k/yr) — positive.
- The deal already cash-flows at list — no discount required.
- Meets the 1% rule at list price ($1k rent vs $75k).
- Cap rate 15.6% vs local median 5.3% in Augusta-Richmond County consolidated government (balance) — top-decile yield for the area; either an underpriced asset or a hidden risk that comps aren't pricing in. Stress-test before assuming the spread holds.
Location & tenants
- Location reads: area grade B — affects rentability + tenant quality, not the cash-flow math above.
- Richmond County (urban): math 12% / reading 20% proficiency, ranked #154 of 174 in GA (top 88%) — low school quality limits family demand, transient renter base, plan for 1-2y turnover; 72% free/reduced lunch — lower-income household profile, screen leases tightly.
- Zoned schools: Meadowbrook Elementary School (math 12% / reading 12%, grade F, #1,041 of 1,228 statewide, top 87%, 497 students, 98% FRL); Glenn Hills Middle School (math 2% / reading 6%, grade F, #467 of 470 statewide, top 99%, 762 students, 98% FRL); Glenn Hills High School (math 2% / reading 2%, grade F, #421 of 424 statewide, top 100%, 883 students, 98% FRL) — zoned schools average 98% FRL vs 72% district-wide (26 pts higher); higher-poverty schools than district average — tighter screening recommended.
- Market conditions: Rents soft (-0.2%/yr); 364 active listings in the ZIP; 25 comparable units currently listed for rent nearby; rentals at typical pace (median 23d on market — plan ~3-4 weeks tenant-placement turnaround); 44% of comp listings sitting > 30 days — soft ceiling on asking rent; 561 units permitted in Richmond County in 2024 (0 in 5+ unit buildings).
- This rent runs 38% of the median local income ($46k/yr) — at the standard rent-burdened threshold; future hikes will face affordability resistance.
Forward outlook
- Local home prices are declining (-3.0%/yr); year-one equity from $519 of loan paydown is wiped out by about $2k of value loss. Plan a longer hold.
- Richmond County population projected to shrink 5% by 2050 — rents likely to lag national; underwrite the cash flow, not the appreciation.
- At projected returns (-3.0% appreciation + 0.0% rent growth), your $21k cash investment doubles in ~4 years — after that, you're playing with house money.
Negotiation context
- Only 1 days on market — expect competitive offers; lowballing is unlikely to land.
- 3 sale attempts since 19y ago with the ask held roughly flat each time — persistent listings suggest the price (not the market) is what's stuck; bring a comps-based counter.
- Current owner paid $39k; list at $75k implies a 92% gain — meaningful room to come down on a strong offer.
Risks & watch-outs
- Watch-outs: property tax is 2.5% of price.
- Climate carrying-cost: major wind risk, 65% chance of damaging wind over 30y; extreme-heat days projected 7→17/yr by 2055 (HVAC capex compounding) — expect insurance premiums to compound above CPI over the hold.
Questions for the listing agent
- Built in 1970 — when were the roof, HVAC, electrical panel, plumbing, and water heater last replaced?
- Property tax is high relative to price — has the assessment been appealed recently, and will the sale trigger a re-assessment?
- Is there a deadline driving the sale (1031 exchange, divorce, estate, relocation)? That informs how much negotiation room exists.
- What's the average days-on-market for RENTAL listings here right now (not sales)? A rising rental-DOM trend means longer vacancies and softer asking-rent achievability than the comps imply.
- What's the recent tenant-quality profile in this submarket — average credit score on applications, eviction rate, late-payment / NSF rate, and stable-employment percentage? A property-management company in the area should have these aggregated.
- How much new for-sale + rental construction is in the pipeline within 1–3 miles? Heavy new supply typically softens prices + rents 12–24 months out; constrained supply supports both.
Investment metrics
- 1% rule
- 1.96% ✓
- Cap rate
- 15.56%
- Cash-on-cash
- 33.11%
- DSCR
- 2.47
- GRM
- 4.2
CMA / ARV
- ARV (on-the-fly)
- $176,358
- Comps found
- 12
Show comp detail 12 sales within ~0.75 mi
| Address | Dist | Beds/Ba | Sqft | Sold | Price | $/sf | Match |
|---|---|---|---|---|---|---|---|
| 3614 Brookshire Ct | 0.08mi | 3/1.5 | 1,450 (-2%) | 2mo | $130,000 | $90 | 91 |
| 3617 Lofwood Dr | 0.19mi | 3/2.0 | 1,432 (-3%) | 8mo | $166,000 | $116 | 76 |
| 2525 Meadowbrook Dr | 0.21mi | 3/2.0 | 1,507 (+2%) | 12mo | $265,000 | $176 | 75 |
| 3497 Bullock Avenue Ave | 0.51mi | 3/2.0 | 1,491 (+1%) | 11mo | $149,900 | $101 | 64 |
| 3609 Lofwood Ct | 0.16mi | 3/2.0 | 1,273 (-14%) | 7mo | $165,000 | $130 | 61 |
| 2701 Gardenbrook Ct | 0.38mi | 3/2.0 | 1,380 (-7%) | 11mo | $164,000 | $119 | 60 |
| 2509 Drumcliff Ct | 0.63mi | 3/2.0 | 1,412 (-5%) | 2mo | $174,000 | $123 | 59 |
| 2603 Crosscreek Rd | 0.74mi | 3/2.0 | 1,377 (-7%) | 3mo | $115,000 | $84 | 49 |
| 2633 Crosscreek Rd | 0.74mi | 4/2.0 (+1) | 1,404 (-5%) | 1mo | $175,000 | $125 | 49 |
| 2804 Sturnidae Ct | 0.54mi | 4/2.0 (+1) | 1,649 (+11%) | 4mo | $189,900 | $115 | 46 |
| 3611 Sturnidae Dr | 0.53mi | 3/2.0 | 1,300 (-12%) | 9mo | $150,000 | $115 | 46 |
| 3481 Bullock Ave | 0.66mi | 3/2.0 | 1,288 (-13%) | 1mo | $163,900 | $127 | 44 |
Match score weights: distance 35% · size 25% · config 20% · recency 20%. Top-matched comps best support the ARV.
Projected returns pro-forma
-3.0% appreciation · 0.0% rent growth · sell at horizon
- IRR
- 24.7%
- Equity multiple
- 1.98×
- Total profit
- $20,500
- Equity at exit
- $11,183
- IRR
- 30.4%
- Equity multiple
- 3.33×
- Total profit
- $48,951
- Equity at exit
- $6,485
Cash invested: $21,000 (down + closing). Projections, not guarantees.
Landlord ↔ Tenant lean methodology
- Overall (STATE)
- 90 Strongly Landlord-Friendly
- State Georgia
- 90 Strongly Landlord-Friendly · R+3
- County
- — inherits STATE
- City
- — inherits STATE
ZIP-level market 30906
- Home prices YoY
- -21.6%
- Rents YoY
- -0.2%
- Active inventory
- 364
- Price-to-rent
- 4.2×
Monthly cashflow live
- Estimated rent
- $1,473 high interval (Pro) →
- Mortgage (P&I)
- −$393
- Tax from tax record
- −$159 /mo · $1,911/yr
- Insurance
- −$31
- HOA
- −$0
- Vacancy / Maint / Mgmt
- −$309
- Net cashflow
- $579
Break-even live
UW: 25.0% down · 7.5% · 30yr · 1.5% tax · 5.0% vac · 8.0% maint · 8.0% mgmt
Financing live
Cash to close
- Down payment
- $18,750
- Closing costs
- $2,250
- Reserves months
- —
- Total cash needed
- —
Loan-product check · same deal, 3 products live
Conventional
25% down · 7.5% · 30yr
- Down + closing
- —
- Monthly P&I
- —
- Monthly cashflow
- —
- DSCR
- —
- Eligible?
- —
Personal DTI + credit; lowest rate.
DSCR
20% down · 8.5% · 30yr
- Down + closing
- —
- Monthly P&I
- —
- Monthly cashflow
- —
- DSCR
- —
- Eligible?
- —
No personal income docs; deal must DSCR.
Hard money
10% down · 12.0% · 12mo
- Down + closing
- —
- Monthly P&I
- —
- Monthly cashflow
- —
- DSCR
- —
- Eligible?
- —
Short-term bridge; refi at stabilization.
Rent comps 25 comps
| Address | Beds | Baths | Sqft | Rent | $/sqft | DOM | Units | Dist |
|---|---|---|---|---|---|---|---|---|
| 3517 Byron Pl Augusta, GA | 3.0 | 2.0 | 1300 | $1,350 | $1.04 | 43d | 1 | 0.38mi |
| 2707 Gardenbrook Ct Augusta, GA | 3.0 | 2.0 | 1728 | $1,606 | $0.93 | 43d | 1 | 0.41mi |
| 3528 Woodlake Rd Hephzibah, GA | 3.0 | 2.0 | 1276 | $1,400 | $1.10 | 13d | 1 | 0.46mi |
| 2808 Nighthawk Dr Augusta, GA | 3.0 | 2.0 | 1314 | $1,450 | $1.10 | 43d | 1 | 0.51mi |
| 3504 Osage Ct Augusta, GA | 4.0 | 1.5 | 1425 | $1,556 | $1.09 | 13d | 1 | 0.55mi |
| 2104 Julius Dr Augusta, GA | 2.0 | 2.0 | 1128 | $1,200 | $1.06 | 21d | 1 | 0.59mi |
| 2531 Crosscreek Rd Hephzibah, GA | 3.0 | 2.0 | 1400 | $1,400 | $1.00 | 23d | 1 | 0.74mi |
| 2531 Crosscreek Rd Hephzibah, GA | 3.0 | 2.0 | 1400 | $1,400 | $1.00 | 43d | 1 | 0.74mi |
| 2242 Winston Way Augusta, GA | 3.0 | 1.5 | 1292 | $1,050 | $0.81 | 43d | 1 | 0.74mi |
| 2242 Winston Way Augusta, GA | 3.0 | 1.5 | 1292 | $1,050 | $0.81 | 23d | 1 | 0.74mi |
| 3519 Evangeline Dr Augusta, GA | 4.0 | 1.5 | 1800 | $1,595 | $0.89 | 43d | 1 | 0.77mi |
| 2604 Edmonton Ct Hephzibah, GA | 3.0 | 2.0 | 1343 | $1,190 | $0.89 | 13d | 1 | 0.90mi |
| 3532 Edmonton St Hephzibah, GA | 3.0 | 2.0 | 1377 | $1,425 | $1.03 | 23d | 1 | 0.96mi |
| 3532 Edmonton St Hephzibah, GA | 3.0 | 2.0 | 1377 | $1,425 | $1.03 | 43d | 1 | 0.96mi |
| 2704 Cranbrook Dr Hephzibah, GA | 3.0 | 2.0 | 1377 | $1,650 | $1.20 | 43d | 1 | 1.04mi |
| 2914 Cumberland Dr Augusta, GA | 4.0 | 1.5 | 1650 | $1,400 | $0.85 | 21d | 1 | 1.07mi |
| 2727 Barclay St Hephzibah, GA | 4.0 | 2.0 | 1430 | $1,234 | $0.86 | 43d | 1 | 1.13mi |
| 1017 Caddenwoods Dr Augusta, GA | 3.0 | 2.0 | 1496 | $1,430 | $0.96 | 43d | 1 | 1.15mi |
| 2941 Rollingwood Dr Augusta, GA | 3.0 | 2.0 | 1297 | $1,750 | $1.35 | 23d | 1 | 1.24mi |
| 2813 Leawood Ct Hephzibah, GA | 3.0 | 2.0 | 1377 | $1,250 | $0.91 | 43d | 1 | 1.28mi |
| 3320 Hillis Rd Augusta, GA | 4.0 | 3.0 | 1788 | $1,850 | $1.03 | 13d | 1 | 1.29mi |
| 3613 Alene Cir Augusta, GA | 3.0 | 2.0 | 1260 | $1,325 | $1.05 | 13d | 1 | 1.31mi |
| 3001 Alene Ct Augusta, GA | 4.0 | 2.0 | 1288 | $1,631 | $1.27 | 23d | 1 | 1.33mi |
| 3200 Deans Bridge Rd Augusta, GA | 1.0–4.0 | 1.0–1.5 | 1075 | $970 | $0.90 | 23d | 6 | 1.36mi |
| 3412 Kensington Dr N Augusta, GA | 3.0 | 2.0 | 1225 | $1,350 | $1.10 | 23d | 1 | 1.36mi |
Listing history 2 events
-
2026-06-14remarks 46-char remark
-
2026-06-14$75,000 Pending 1 DOM
ⓘ Source: listings_history table (triggers on properties + properties_extension) + one-shot
backfill from property_details.listing_events for pre-trigger history.
Tax reassessment forecast GA · Resets to sale price
- Current annual tax
- $1,911 · $159/mo
- Projected year-2 tax
- $1,911 · $159/mo
- Expected delta
- $0/yr ($0/mo · 0.0%)
ⓘ Screening estimate from a state-policy table — verify with the county assessor before closing.
Climate risk First Street
- Flood 1/10 Low FEMA zone X (unshaded) · 0% chance over 30 yrs
- Wildfire 4/10 Moderate
- Heat 7/10 Severe 7 d/yr ≥107°F today · 17 d/yr by 30 yrs out
- Wind 6/10 Major 65% chance of damaging wind over 30 yrs
- Air quality 3/10 Moderate 3 unhealthy d/yr today · 3 by 30 yrs out
Nearby sold comps map
Loading sold comps map…
Walkable amenities ~0.75 mi
Loading nearby amenities…
Taxation est. · year 1
- Rental income
- $17,670
- − Mortgage interest
- −$4,201
- − Property taxes
- −$1,911
- − Insurance
- −$375
- − Repairs & maintenance
- −$1,414
- − Management
- −$1,414
- − Depreciation
- −$2,182
- Taxable income
- $6,174
- Est. tax owed @ 24.0%
- −$1,482
- After-tax cash flow
- $5,472/yr
For passive investors: Depreciation is non-cash, so a rental often shows a tax loss while cash-flowing — sheltering income. Rental losses are passive: they offset passive income freely, and up to $25,000/yr can offset ordinary (W-2) income if you actively participate and your MAGI is under $100k (phasing out to $0 by $150k); unused losses carry forward. On sale, claimed depreciation is recaptured at up to 25%, and gains may owe capital-gains tax (a 1031 exchange can defer both). Figures are a year-1 estimate at your 24.0% rate — not tax advice; consult a CPA.
Schools (NCES district)
- District
- Richmond County
- NCES district ID
- 1304380
- Math proficiency
- 12% ▼ -9.00%
- Reading proficiency
- 20% ▼ -6.00%
- Median HH income
- $38,069
- Composite
- 13.43/100
- National rank
- #9524
- State rank
- #154 of 174 in GA
Livability — Augusta-Richmond County consolidated government (balance)
No livability data for this city. (Only ~50 U.S. cities are tracked.)
Census & demographics
- Census place
- Augusta-Richmond County consolidated government (balance), GA
- County
- Richmond County · 190,917 people
- City population
- 154,035
- Metro
- Augusta-Richmond County, GA-SC
- Population (ZIP)
- 60,423
- Household income
- $45,999
- Rent vs Own
- Severe rent burden
- 3363.0
Population outlook (Richmond County) Hauer SSP2
- Today (2025)
- 200,753 people
- By 2030
- 200,232 · -0.3%
- By 2040
- 196,813 · -2.0%
- By 2050
- 190,347 · -5.2%
- By 2075
- 172,496 · -14.1%
- By 2100
- 146,284 · -27.1%
Race, ethnicity, and origin ACS 2023
- Neighborhood character
- Majority Black (64%)
- Race & ethnicity
- Black 64% White 27% Two or more races 5% Hispanic / Latino 5%
- Common ancestry
- Lithuanian 1%
- Foreign-born
- 2% · Canada
- Languages at home
- 95% English-only · Spanish 3% German/W. Germanic 1%
Political lean MEDSL · Richmond
- 2024 margin
- Solid D (+36.1) · D 67.8% · R 31.7%
- 2008→2024 swing
- +4.3pp toward D · 2008: 31.8pp · 2024: 36.1pp
- All cycles
- 2024: D+36.1 2020: D+37.2 2016: D+32.4 2012: D+33.8 2008: D+31.8
Not yet ingested
- Civics
- —
Market trends
- HPI YoY
- ▼ -58.99%
- Current HPI
- 213.5733
- Rent YoY
- ▼ -0.25%
- Metro
- Augusta-Richmond County, GA-SC
- State GDP YoY
- ▲ 2.66%
- F500 in state
- 28
Industry mix (Fortune 500 HQ in GA)
| Industry | F500 HQs | Revenue |
|---|---|---|
| Paper / Packaging | 2 | $29B |
|
||
| Retail | 1 | $160B |
|
||
| Transportation / Logistics | 1 | $91B |
|
||
| Airlines | 1 | $62B |
|
||
| Consumer Goods | 1 | $47B |
|
||
| Utilities | 1 | $25B |
|
||
Price history
+66.7% since first listed10 events — show timeline
- 2026-06-13 Pending — Hive MLS
- 2026-06-13 Listed $75,000 Hive MLS
- 2026-02-13 Price Changed $49,900 Hive MLS
- 2023-10-10 Sold (MLS) $39,000 Hive MLS
- 2023-09-06 Listed $289,000 Hive MLS
- 2008-05-06 Sold (MLS) $39,000 Hive MLS
- 2008-05-06 Sold (MLS) $39,000 Hive MLS
- 2007-12-27 Listed $49,900 Hive MLS
- 2006-01-06 Sold (Public Records) $79,900 Public Records
- 2005-08-31 Sold (Public Records) $45,000 Public Records
Property tax history
+3.7%/yrLatest (2025): $1,911 · +15.4% YoY. Source: county tax records.
Cash-flow waterfall
monthlySold comps — $/sqft
last 12 mo · ≤1 miLoading sold comps…